June 23, 2026
The Safe Haven Playbook Has Shifted Before. It Could Shift Again.
Throughout the twentieth century, investors assumed that government bonds and the US dollar were the bedrock of portfolio defence during periods of economic stress. That assumption hardened into orthodoxy during the 1990s and 2000s, when dollar dominance was at its peak and inflation felt like a solved problem. Yet the 1970s told a completely different story.
During that decade of persistent price erosion, bonds failed to protect purchasing power, the dollar declined in real terms, and physical gold and silver emerged as the primary assets capable of holding real value. The question investors should be grappling with right now is not whether silver fell on June 17, 2026. It is whether the macro regime that made metals irrelevant for thirty years is quietly reversing.
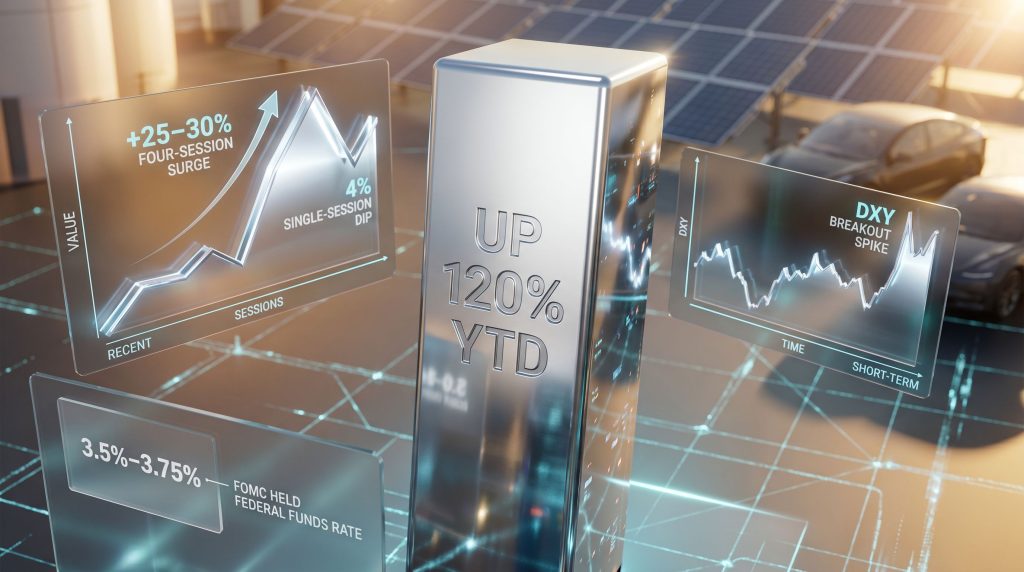
That is the analytical lens through which the so-called Warsh selloff deserves to be examined. A single-session decline of more than 4% in spot silver, following a period when silver had risen more than 120% year-to-date, does not answer the question of whether is the silver rally over after the Warsh selloff. It barely qualifies as a ripple in the context of a multi-year structural move.
When big ASX news breaks, our subscribers know first
Why Momentum Mathematics Made a Correction Inevitable
Before attributing the June 17 pullback to any particular policy signal, it is worth understanding what the setup looked like heading into the FOMC meeting. Silver miners had surged between 25% and 30% across just four consecutive trading sessions prior to the press conference. That is an extraordinary compression of gains into an extremely short window, and it created the kind of technically overextended environment where a reversal becomes mathematically probable regardless of the triggering catalyst.
BMO Capital Markets characterised the move as a mid-cycle correction following an unusually steep runup, not a structural market top. This distinction matters enormously. Precious metal bull markets have historically absorbed corrections of 15% to 30% without reversing the primary trend. A 4% single-session decline sitting on top of a 120%+ year-to-date advance fits comfortably within that historical tolerance band.
There was also a notable behavioural signal worth registering. During the dip, retail investors across Asian markets were reportedly queuing at bullion dealers to purchase physical silver at reduced prices. This kind of behaviour, buying on weakness rather than selling into it, has historically been associated with strong underlying demand conviction rather than thesis abandonment.
The more honest framing is this: without Kevin Warsh's press conference, this same correction would likely have been labelled a routine profit-taking event after an extraordinary surge. The hawkish tone from an incoming Fed chair landed on top of an already overextended position and amplified a move that was coming regardless. Historical data shows gold and silver often bounce back strongly after such sharp corrections, which reinforces the importance of keeping the longer-term trend in view.
Decoding the Warsh Debut: Posture vs. Policy Trajectory
The FOMC voted 12-0 to hold the federal funds rate at 3.5% to 3.75% at the June 17, 2026 meeting. Chair Warsh removed forward guidance from the policy statement, declined to submit a personal dot plot projection, and made price stability the central theme of his first public appearance. Markets interpreted the combination as a hawkish pivot and sold precious metals accordingly.
That interpretation deserves scrutiny. Citi's pre-meeting analysis documented a well-established institutional pattern: incoming Federal Reserve chairs consistently use their inaugural press conference to project hawkish inflation-fighting credibility, largely independent of their actual intended policy trajectory. The data supports this pattern clearly.
| Meeting Type | Average 2-Year Treasury Selloff |
|---|---|
| New Fed Chair debut meeting | ~6 basis points |
| Standard FOMC meeting | ~1 basis point |
The debut hawkishness functions as a credibility-establishment move, not a binding policy commitment. What ultimately determines the policy path is the incoming sequence of employment and inflation data, not the tone of a first press conference.
The parallel to Jerome Powell's debut is instructive. The same analytical community now characterising Warsh as a committed inflation hawk made near-identical characterisations about Powell at his first press conference. The certainty in the language was comparable. Powell's actual policy trajectory diverged substantially from those early assessments. This recurring pattern of misreading inaugural positioning as durable commitment represents a well-documented analytical blind spot in Fed-watching circles.
Warsh also acknowledged publicly that inflation had missed the Fed's 2% target for five consecutive years. Simultaneously, one of five newly announced task forces from the June 17 meeting is specifically focused on how the Fed measures inflation. A methodological revision to the measurement framework, particularly to PCE or CPI components, could bring headline figures closer to target without any corresponding reduction in real-world purchasing power erosion. If that scenario materialises, the structural engine driving metals demand remains fully intact regardless of what the official readings show.
Four Market Internals That Defined the Session
Reading a selloff correctly requires looking beneath the headline price move. On June 17, four specific market signals provided a more granular picture of what was actually happening.
Signal 1: Silver and Gold Miners Held Relative to Spot
In genuine systemic selloffs, mining equities amplify the decline in the underlying metal. They lead to the downside and often fall faster than spot prices. On June 17, that pattern did not materialise. Miners held their ground relative to spot, a bullish divergence indicating that institutional investors maintained their structural position beneath the surface volatility rather than executing broad-based liquidation.
Signal 2: Copper Remained Resilient
Precious metals and base metals tend to decline in tandem when the actual driver is macro stress or genuine risk-off positioning. Copper's stability during the same session isolated the silver move as likely profit-taking rather than a signal of broader economic concern.
Signal 3: 10-Year Treasury Yields Moved the Wrong Way for a Hawkish Narrative
If market participants genuinely believed Warsh intended to tighten aggressively, long-end Treasury yields should have risen in response. They fell instead. A central bank that markets actually believe will tighten pushes yields higher at the long end. The counterintuitive direction of yields suggests the market remained sceptical that the debut hawkish posture would translate into real sustained policy action.
Signal 4: Strait of Hormuz Supply Flows Were Normalising
Energy price inflation from Middle East supply disruptions had been a core pillar of the inflationary narrative in the months preceding the June meeting. Early signals that Strait of Hormuz supply flows were beginning to normalise suggested that inflationary pressure from the energy channel could ease organically, reducing the fundamental case for aggressive Fed intervention even without a change in the Fed's stated intention.
The framework for distinguishing a correction from a genuine reversal can be summarised as follows:
| Signal | Correction Indicator | Reversal Indicator |
|---|---|---|
| Miner performance vs. spot | Miners hold or outperform | Miners lead the decline |
| Copper price action | Copper remains resilient | Copper falls in tandem |
| 10-year Treasury yield direction | Yields fall or hold steady | Yields surge aggressively |
| Emerging market currencies | EM currencies hold | EM currencies sell off sharply |
| Institutional bid | Visible in miner stability | Absent, broad liquidation evident |
Three of the four primary signals from June 17 pointed toward correction rather than reversal.
The US Dollar: The One Genuine Risk Worth Monitoring
Not every signal from June 17 was benign. The US Dollar Index, which measures dollar strength against a basket of six major currencies including the euro, Japanese yen, and British pound, was breaking out to short-term highs during the same session. That is the most credible near-term headwind for silver, and it deserves honest attention.
Silver is denominated in US dollars across global markets. When the dollar appreciates, the effective cost of silver rises for buyers operating in other currencies, which mechanically compresses international demand. Furthermore, the broader erosion of trust in the US dollar as the global reserve currency remains a key structural tailwind for precious metals over the medium term. A sustained DXY rally represents a genuine pressure point.
The critical analytical distinction, however, is between a short-term daily chart breakout and a sustained multi-week or multi-month structural move. These carry fundamentally different implications for precious metals positioning. The countervailing signal during the June 17 session was the relative stability of emerging market currencies. A genuine systemic dollar surge typically transmits rapidly and forcefully into emerging market currency weakness. That transmission did not occur, suggesting the DXY move reflected short-term positioning adjustment rather than a structural shift in global dollar demand.
| DXY Scenario | Duration | Implied Silver Impact | Strategic Response |
|---|---|---|---|
| Short-term pop, reversal within weeks | Days to 2 weeks | Limited, recoverable | Hold position, monitor closely |
| Sustained multi-week rally | 3 to 6 weeks | Meaningful headwind | Reduce exposure, raise cash |
| Structural multi-month breakout | 2+ months | Significant sustained pressure | Reassess metals allocation |
| EM currency contagion develops | Concurrent with DXY | Amplified downside | Defensive repositioning warranted |
Silver's Dual-Engine Demand Structure
Understanding why a single-session pullback cannot invalidate the silver thesis requires understanding the architecture of silver demand itself. Silver's dual role as both an industrial commodity and a monetary asset is precisely what makes it unusual among investable assets, because it carries two structurally independent demand engines running simultaneously.
The Industrial Demand Foundation
According to BlackRock's 2026 outlook, approximately 60% of annual silver consumption is tied to industrial end uses. The primary demand categories include:
- Solar photovoltaic panel manufacturing, where silver paste is used in cell conductivity
- Electric vehicle production, which requires silver in battery management systems and electrical contacts
- Consumer electronics, including semiconductors, switches, and display technologies
- Medical devices and antimicrobial applications
This industrial demand base creates a structural floor that is largely insulated from monetary policy cycles. Even in an environment where the Fed successfully tightened and reduced monetary demand for silver, the energy transition investment trajectory globally would need to collapse dramatically before industrial consumption reversed. That scenario is inconsistent with current capital deployment patterns across the renewable energy and EV sectors.
Silver supply deficits have persisted across multiple years, furthermore compounding the structural demand-supply imbalance that underpins the longer-term price thesis.
The Monetary Demand Engine
Silver's role as a monetary metal predates the modern financial system by thousands of years. The current macro environment, characterised by five consecutive years of above-target inflation, a structurally debt-constrained central bank, and elevated sovereign debt levels globally, mirrors the conditions that historically drove precious metals outperformance during the 1970s inflationary cycle.
The dollar's status as the default safe haven is a construct that solidified primarily during the 1990s and 2000s. It reflects a specific set of conditions, not a permanent feature of the global financial architecture. During the prior inflationary decade, physical metals performed that function instead.
The deeper structural question, which the Warsh selloff merely obscured rather than answered, is whether the global monetary regime is transitioning back toward the 1970s framework where physical assets rather than paper instruments preserved real purchasing power. Five consecutive years of above-target inflation, acknowledged by the incoming Fed chair himself, and a central bank constrained by the economy's elevated debt load from implementing the aggressive tightening required to genuinely resolve it, creates precisely the kind of environment where that transition becomes relevant. In addition, central bank gold demand has been accelerating globally, reinforcing the institutional case for hard assets across both gold and silver.
The next major ASX story will hit our subscribers first
A Disciplined Approach to Volatile Precious Metal Markets
How sophisticated investors navigated the June 17 session offers a practical framework for thinking about position management through precious metal corrections.
Tavi Costa of Azoria Capital, speaking with GoldSilver anchor Maggie Lake the day after the move, described a disciplined three-phase approach that is worth examining on its merits:
Phase 1: Trim into accelerating strength. When an asset surges 25% to 30% in four trading sessions, the probability of a sharp reversal increases substantially. Disciplined position management involves reducing exposure as momentum accelerates rather than increasing it. Costa had already trimmed his metals exposure into the prior rally, which meant he was holding more cash than usual when the correction arrived.
Phase 2: Resist reactive decisions during the correction itself. Neither panic selling into a decline nor aggressive dip-buying before confirmation is appropriate. The distinction between a correction and a structural reversal requires monitoring the internal signals described above before committing capital in either direction.
Phase 3: Wait for confirmation before redeploying capital. Costa noted he was watching for specific signals before adding back to his position, including stabilisation or reversal of the DXY, continued miner strength relative to spot, and clarity on the Fed's inflation measurement task force direction. This patience-based framework, acting on confirmation rather than anticipation, is the operational expression of distinguishing between short-term catalysts and long-term thesis changes.
The most common error during precious metal corrections is treating a short-term triggering event, a Fed press conference, a currency move, as evidence of a long-term thesis change. These are categorically different analytical problems that require different response frameworks.
Three Scenarios That Could Permanently End the Silver Rally
For investors asking whether is the silver rally over after the Warsh selloff, the more useful question is what conditions would actually need to materialise to produce a structural reversal rather than a cyclical correction.
Scenario A: Credible and Sustained Fed Tightening. This requires multiple consecutive rate hikes, a sustained DXY breakout above multi-year resistance levels, and real interest rates moving decisively into positive territory. The constraint here is significant. Aggressive tightening in an economy carrying the current level of sovereign and private debt risks triggering severe economic damage, which limits the Fed's practical latitude to tighten as aggressively as the 1970s Volcker response required.
Scenario B: Structural Resolution of Purchasing Power Erosion. This requires inflation sustainably returning to 2% with genuine real-world price stability, not just methodological adjustments to how headline figures are calculated. Given Warsh's own acknowledgement of five consecutive years of above-target inflation, this scenario represents a multi-year challenge at minimum.
Scenario C: Industrial Demand Collapse. This requires a dramatic and sustained deceleration in global solar, EV, and electronics manufacturing. This scenario is structurally inconsistent with current energy transition investment trajectories and the capital commitments already made by governments and corporations globally.
None of these three scenarios were triggered or materially advanced by the events of June 17, 2026.
Key Variables to Monitor in the Weeks Ahead
Three specific data points deserve close attention as the post-Warsh dust settles:
-
US Dollar Index trajectory. The DXY is the single most important near-term variable for silver price direction. Whether the mid-June breakout sustains above key resistance or fails and reverts will determine how much of a headwind the currency channel creates. Emerging market currency stability remains the most important confirming or disconfirming signal for the durability of any dollar strength.
-
Silver miners relative to spot price. Mining equities remain the most reliable real-time barometer of institutional conviction in the metals complex. Miners maintaining their ground or leading the next leg higher signals that the structural bid is intact. Miners underperforming spot on a subsequent rally would be a legitimate warning worth taking seriously.
-
Fed inflation measurement task force outcomes. The task force examining how the Federal Reserve measures inflation carries significant implications. Any proposed changes to PCE or CPI measurement frameworks that bring headline figures toward target without addressing real purchasing power erosion would leave the structural metals demand thesis fully intact, regardless of what the official numbers ultimately show.
Frequently Asked Questions
Is the silver rally over after the Warsh selloff?
The weight of market evidence from June 17 points toward a mid-cycle correction rather than a structural reversal. Silver miners held their ground relative to spot, the opposite behaviour of genuine institutional exits. Silver remained up more than 120% year-to-date at the time of the pullback, and BMO Capital Markets characterised the move as a correction following a major runup. The structural case, dual industrial and monetary demand in a purchasing power erosion environment, remained unchanged following the session. Gold and silver losses eased in the subsequent sessions, consistent with a corrective episode rather than a trend-ending event.
Why did silver fall more than gold after Warsh's first press conference?
Silver carries a structurally higher volatility coefficient relative to gold, a characteristic that amplifies both advances and declines. The 4%+ single-session decline compared to a smaller move in gold reflects this beta differential rather than a divergence in the underlying investment thesis. The prior four-session surge of 25% to 30% in silver miners created an unusually overextended technical setup that amplified the correction when it arrived. However, the gold-silver ratio remains a valuable lens for understanding the relative valuation between the two metals throughout volatile periods such as this.
What does the FOMC rate hold at 3.5% to 3.75% mean for silver?
A rate hold is broadly neutral to mildly supportive for precious metals. The market reaction was driven by the hawkish tone of Warsh's debut press conference rather than the rate decision itself. Historical data shows new Fed chairs average a 6 basis point selloff in the 2-year Treasury at their debut meeting versus just over 1 basis point at standard meetings. The actual policy path depends on incoming data, not first-meeting positioning.
What percentage of silver demand is industrial?
According to BlackRock's 2026 outlook, approximately 60% of annual silver consumption is driven by industrial applications, primarily solar photovoltaic manufacturing, electric vehicle production, and consumer electronics. This industrial base provides a structural demand floor that is largely independent of monetary policy cycles.
This article is for informational and educational purposes only. It does not constitute financial or investment advice. All investment decisions should be made in consultation with a qualified financial adviser. Past performance is not indicative of future results. All financial figures and dates referenced reflect information available at the time of the source events discussed.
Want to Stay Ahead of the Next Major ASX Mineral Discovery?
Discovery Alert's proprietary Discovery IQ model delivers real-time alerts on significant ASX mineral discoveries, cutting through complex data to provide actionable insights for both short-term traders and long-term investors — explore historic discoveries and their exceptional returns, then begin your 14-day free trial to position yourself ahead of the broader market.