
July 1, 2026
Critical Energy Transit Vulnerabilities in Modern Portfolio Management
Global financial markets operate within an interconnected framework where geographic chokepoints create systemic vulnerabilities that extend far beyond their immediate operational scope. The concentration of energy transit routes through narrow waterways represents one of the most significant structural risks facing contemporary investment strategies. Understanding these vulnerabilities requires examining how supply chain dependencies, energy security concerns, and geopolitical tensions converge to create portfolio-wide exposure that many investors fail to recognise until crisis conditions emerge.
Modern economies rely on complex energy distribution networks that funnel critical resources through a limited number of transit corridors. When these pathways face disruption, the resulting market dynamics create both immediate shock effects and longer-term structural adjustments that reshape entire sectors. The forward-looking nature of financial markets means that even the threat of disruption begins repricing assets across multiple geographies and industries, creating investment opportunities and risks that demand sophisticated analytical frameworks.
When big ASX news breaks, our subscribers know first
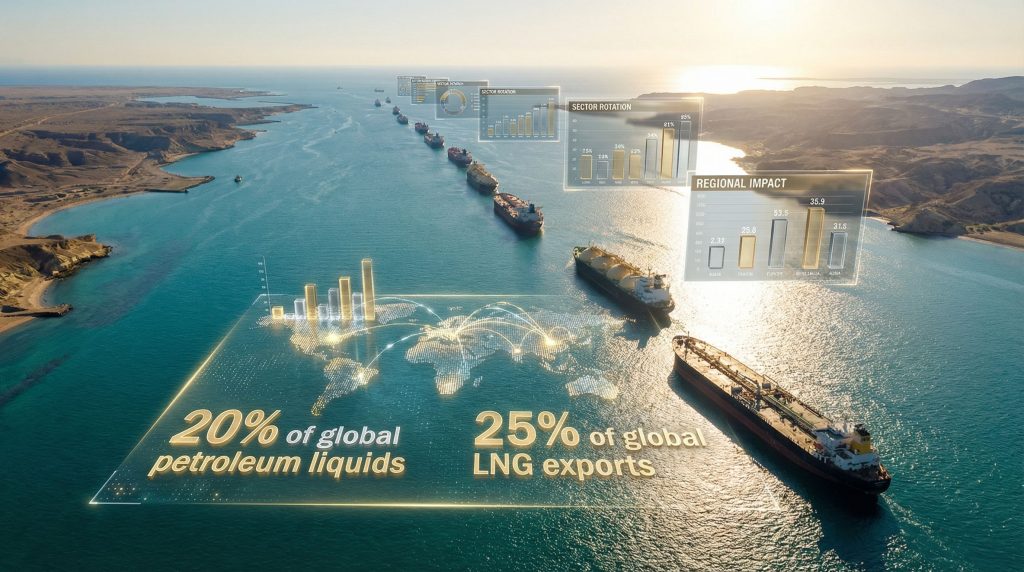
Understanding the Strait of Hormuz as a Strategic Investment Chokepoint
The Strait of Hormuz functions as the world's most critical energy bottleneck, channelling approximately 20-21 million barrels of crude oil daily through a waterway spanning just 21 miles at its narrowest point. This geographic constraint represents roughly 20% of global petroleum liquids shipments and 25% of global LNG exports, making it an indispensable component of international energy infrastructure.
Global Energy Dependencies Through the Strait:
| Resource Category | Daily Volume | Global Market Share | Primary Consuming Regions |
|---|---|---|---|
| Crude Oil | 20-21 million barrels | 20% | Asia-Pacific, Europe, North America |
| Liquefied Natural Gas | 25% of exports | 25% | Japan, South Korea, India, China |
| Refined Petroleum Products | 15% of trade | 15% | Distributed globally |
| Petrochemical Feedstocks | 30% of trade | 30% | Manufacturing centres worldwide |
The strait's strategic importance stems from its role connecting Persian Gulf producers including Saudi Arabia, Iraq, Kuwait, and Iran to global consuming markets. Alternative routing options exist but lack the capacity to replace Hormuz transit volumes completely. Pipeline systems through Saudi Arabia to the Red Sea, the Suez Canal route, and overland alternatives through Turkey can handle partial volumes but would create severe bottlenecks if required to absorb full Strait of Hormuz traffic.
Supply Chain Integration and Hidden Portfolio Exposure
Investment portfolios contain layers of Strait of Hormuz closure impact on investments that extend beyond direct energy sector holdings. Manufacturing companies across automotive, pharmaceutical, consumer electronics, and food processing industries rely on petrochemical inputs that transit the waterway. Transportation and logistics companies face immediate cost pressures from fuel price spikes, while consumer discretionary businesses experience demand destruction as household spending shifts toward essential goods.
Cascading Investment Vulnerabilities:
- Industrial Manufacturing Stocks: Petrochemical input costs surge, compressing margins across plastics, fertilisers, and synthetic materials production
- Airlines and Shipping Companies: Fuel represents 20-30% of operating costs for major carriers, creating immediate earnings pressure
- Consumer Goods Manufacturers: Both input costs and distribution expenses increase simultaneously
- Emerging Market Bonds: Energy-importing nations face current account deterioration and currency pressure
Analysis from RBC Wealth Management indicates that wars impact your investments typically creating market bottoms within 13 days and recovery within 28 days, with average peak-to-trough declines of approximately 6%. However, these historical patterns apply to conflicts with visible resolution paths. Extended disruptions without clear de-escalation timelines create fundamentally different market dynamics where confidence erosion compounds economic damage through multiple transmission channels.
Systemic Investment Risk Transmission Mechanisms
Energy Price Shock Dynamics
During periods of Strait closure concerns, oil prices can surge toward $120-140 per barrel from baseline levels, representing increases of 50-75% above normal trading ranges. This price action creates immediate repricing across energy-sensitive sectors while forcing central banks to reconsider monetary policy accommodation.
Recent analysis during March 2026 tensions showed oil prices approaching $120 per barrel, representing the highest levels in over 15 years and steeper increases than observed during early stages of the Ukraine conflict. Furthermore, Qatar's warning that Gulf production could halt within days, combined with JPMorgan expectations of production cessation weeks into any sustained conflict, illustrates how supply-side concerns amplify the transit disruption risk.
Inflation and Monetary Policy Implications
Sustained energy price increases force central banks to balance growth support against inflation control. The Federal Reserve's March 2026 position with rates at 3.5%-3.75% demonstrates this challenge, as futures markets pushed rate cut expectations from spring 2026 to July 2026 or later in response to energy-driven inflation concerns.
Regional Inflation Vulnerabilities:
- Australia: Westpac projections indicate petrol price increases of A$0.25-1.00 per litre, adding one percentage point to CPI and reducing GDP growth by 0.2 percentage points for disruptions exceeding one month
- European Union: Manufacturing-heavy economies face dual pressures from energy costs and reduced competitiveness against energy exporters
- Asian Economies: Net energy importers including China, India, Japan, and South Korea experience particularly severe equity market repricing
Currency and Capital Flow Disruptions
Strait of Hormuz closure concerns trigger significant capital reallocation patterns. The US dollar typically strengthens as a safe haven despite longer-term structural challenges, while emerging market currencies face pressure from risk-off sentiment and deteriorating current account positions for energy importers.
Asian equity markets demonstrate this vulnerability most clearly, with net energy importers experiencing particularly severe sell-offs as investors recognise the asymmetric exposure to energy cost increases. Hardware-focused developed Asian markets, which had benefited from diversification away from US concentration while maintaining AI-driven growth exposure, face reversal of these positive dynamics during sustained energy crises.
Strategic Investment Scenario Framework for Strait Disruptions
Scenario 1: Rapid Diplomatic Resolution (35% Probability Weight)
Timeline: 6-8 weeks of intermittent disruption
This scenario assumes de-escalation emerges through diplomatic channels or military objectives achievement without sustained blockade. Historical precedents from the 1991 Gulf War and 2003 Iraq War support this probability weighting, where clarity about conflict resolution enabled rapid market recovery.
Investment Market Dynamics:
- Oil Price Trajectory: Initial spike to $120-140/barrel, correcting to $85-95 within three months as supply normalisation occurs
- Equity Market Pattern: 15-20% peak-to-trough decline followed by V-shaped recovery as crisis resolution becomes apparent
- Interest Rate Environment: Central banks resume accommodation as inflation pressures subside, supporting growth-sensitive sectors
- Currency Impacts: Dollar strength moderates while emerging market currencies stabilise on reduced risk premium
Sector Performance Expectations:
| Industry Segment | Initial Impact | 6-Month Recovery |
|---|---|---|
| Energy Producers | +25% to +40% | Normalise to +10% above baseline |
| Technology Stocks | -15% to -20% | Full recovery to pre-crisis levels |
| Consumer Staples | -5% to -8% | Outperform through defensive characteristics |
| Financial Services | -10% to -15% | Benefit from eventual rate environment |
| Transportation | -20% to -25% | Recover as fuel costs normalise |
Scenario 2: Extended Regional Conflict (45% Probability Weight)
Timeline: 3-6 months of periodic closure attempts
This intermediate scenario reflects persistent military tensions with intermittent Strait access rather than complete sustained blockade. Market psychology shifts from acute crisis response to chronic uncertainty accommodation, creating different investment dynamics than either rapid resolution or complete closure scenarios.
Economic Transmission Effects:
- Inflation Entrenchment: Energy costs remain elevated long enough to influence wage negotiations and broader price-setting behaviour
- Growth-Inflation Trade-off: Central banks face sustained pressure between supporting growth and controlling inflation, leading to policy uncertainty
- Regional Market Divergence: Energy exporters experience relative outperformance while importers face sustained headwinds
- Supply Chain Reorientation: Companies accelerate alternative sourcing and nearshoring strategies, creating infrastructure investment opportunities
Portfolio Rebalancing Requirements:
- Reduce exposure to energy-intensive manufacturing sectors
- Increase allocation to domestic energy production assets
- Implement currency hedging for emerging market exposure
- Consider inflation-protected securities for defensive positioning
- Evaluate infrastructure investments in alternative energy transit routes
Scenario 3: Prolonged Strategic Blockade (20% Probability Weight)
Timeline: 6+ months of sustained closure
This tail-risk scenario assumes sustained military capability to maintain closure despite international pressure and economic consequences. While least likely due to mutual economic destruction, the scenario requires consideration given the magnitude of potential impact.
Systemic Economic Risks:
- Recession Probability: Exceeds 70% across major developed economies as energy costs destroy demand and constrain production
- Corporate Earnings Pressure: Dual impact from input cost increases and demand destruction creates widespread margin compression
- Credit Market Stress: Energy-dependent companies face refinancing challenges while emerging market sovereigns experience debt sustainability concerns
- Financial System Stability: Banking sector faces loan portfolio deterioration across energy-sensitive industries and geographies
Investment Survival Strategies:
- Maximum liquidity preservation through cash and short-term government securities
- Concentration in essential services sectors (utilities, healthcare, food production)
- Geographic diversification toward energy-exporting regions
- Defensive equity positioning with strong balance sheet requirements
- Alternative asset consideration including real estate and commodities
Regional Investment Impact Assessment and Geographic Arbitrage
Asia-Pacific: Maximum Economic Vulnerability
Asian equity markets face disproportionate impact from Strait of Hormuz disruptions due to energy import dependencies and manufacturing sector concentration. China, India, Japan, and South Korea represent particularly vulnerable markets where sell-offs during energy crises tend to be more severe and recovery more dependent on conflict resolution.
Country-Specific Investment Risks:
- Japan: Manufacturing equity valuations face compression of 25-35% due to energy input costs affecting automotive, electronics, and steel production
- South Korea: Petrochemical and heavy industry sectors experience margin destruction from feedstock cost increases
- India: Current account deficit expansion threatens rupee stability and foreign investment flows
- China: Export competitiveness deteriorates while domestic energy costs pressure manufacturing profitability
European Markets: Industrial Production Challenges
European investment markets confront energy security concerns that predate any specific Strait crisis, making them particularly sensitive to additional supply disruptions. Germany's industrial base faces acute vulnerability, while countries with North Sea energy production experience mixed impacts.
Sector-Specific European Impacts:
- German DAX: Industrial production declines threaten automotive, chemical, and machinery sectors that drive index performance
- Netherlands AEX: Port and logistics investments face volume declines as energy trade routes shift
- UK FTSE: North Sea energy assets benefit while manufacturing suffers, creating intra-market divergence
- French CAC: Nuclear power advantage provides relative energy security but export industries still face input cost pressures
North American Energy Security Advantages
US and Canadian markets benefit from domestic energy production capabilities that provide both direct investment opportunities and broader economic resilience during global energy supply disruptions. Consequently, the tariff impact on investments during such crises becomes more complex as trade policies intersect with energy security considerations.
Strategic Investment Beneficiaries:
- US Shale Energy: Renewed capital inflows as global energy security concerns drive investment toward domestic production
- Canadian Oil Sands: Projects gain economic viability as global oil prices sustainably exceed $100/barrel thresholds
- Mexican Manufacturing: Nearshoring acceleration benefits from energy security advantages relative to Asian alternatives
- North American Infrastructure: Pipeline, refining, and storage capacity investments gain strategic premium valuation
Australian Market: Mixed Energy Profile
Australia's position as a net energy exporter creates complex investment dynamics during Strait disruptions. While overall energy balance provides economic benefits, specific oil import requirements for transportation and industrial uses create targeted vulnerabilities.
Market attention during sustained energy crises typically shifts from Middle East headlines toward domestic economic fundamentals, including retail spending patterns, housing market dynamics, and pass-through benefits from Chinese economic stimulus affecting Australian mining exports.
Tactical Portfolio Positioning for Energy Transit Risk
Defensive Portfolio Architecture
Core Holdings Strategy for Energy Security:
- Energy Infrastructure Assets: Domestic oil and gas producers, renewable energy installations, pipeline networks
- Inflation Hedge Instruments: Treasury Inflation-Protected Securities (TIPS), commodity exposure, real estate investment trusts
- Currency Diversification: Multi-currency exposure reducing dollar concentration while avoiding energy-importing emerging markets
- Quality Equity Bias: Companies with strong balance sheets, pricing power, and minimal energy input sensitivity
Dynamic Sector Allocation Framework
Tactical Positioning by Scenario Probability:
| Market Scenario | Overweight Allocation | Underweight Allocation | Neutral Positioning |
|---|---|---|---|
| Rapid Resolution | Technology, Consumer Discretionary | Traditional Energy, Utilities | Healthcare, Financials |
| Extended Conflict | Energy, Materials, Infrastructure | Consumer Discretionary, Industrials | Telecommunications, REITs |
| Prolonged Crisis | Utilities, Consumer Staples | Most Cyclical Sectors | Precious Metals, Defence |
Options Strategies for Volatility Management
Energy crisis periods create elevated volatility premiums that sophisticated investors can harvest through systematic strategies. In addition, understanding why the Strait of Hormuz closure matters so much to the global economy helps inform these tactical approaches:
- Protective Put Strategies: Downside protection for core equity holdings during uncertainty periods
- Covered Call Writing: Income generation from elevated option premiums on stable holdings
- Volatility Selling: Systematic capture of fear premiums when option prices exceed historical volatility norms
- Straddle Strategies: Profit from directional uncertainty while market pricing adjusts to new information
The next major ASX story will hit our subscribers first
Long-Term Structural Investment Implications
Energy Transition Acceleration
Strait of Hormuz vulnerabilities consistently accelerate investment flows toward energy independence and security themes that provide strategic returns beyond crisis periods. This acceleration aligns with broader energy security transition trends driving long-term structural changes.
Investment Theme Beneficiaries:
- Renewable Energy Infrastructure: Solar, wind, and hydroelectric projects gain strategic premium beyond pure economic returns
- Energy Storage Technology: Battery systems, pumped hydro, and grid-scale storage receive increased capital allocation priority
- Nuclear Power Revival: Small modular reactors and advanced nuclear technologies experience renewed investor interest
- Critical Minerals Mining: Lithium, cobalt, rare earth elements required for energy transition gain security premium valuations
Supply Chain Regionalisation Trends
Energy security concerns drive structural changes in global trade patterns that create sustained investment opportunities:
Regionalisation Investment Themes:
- Nearshoring Infrastructure: Port facilities, manufacturing centres, and transportation networks in proximity to major consuming markets
- Regional Trade Integration: Investment opportunities in trade bloc development and regional economic integration
- Alternative Transit Routes: Pipeline networks, shipping infrastructure, and overland transportation systems bypassing traditional chokepoints
- Strategic Resource Stockpiling: Warehouse facilities, storage infrastructure, and inventory management systems
Geopolitical Risk Premium Integration
Financial markets increasingly incorporate geopolitical stability as a fundamental valuation factor, creating permanent shifts in relative asset pricing. Meanwhile, developments in Saudi exploration licenses demonstrate how regional production capacity affects global energy security calculations:
- Emerging Market Risk Premiums: Permanently elevated discount rates for countries with energy security vulnerabilities
- Defence Sector Revaluation: Security and defence technology companies experience sustained multiple expansion
- Resource Nationalism Impact: Mining and energy companies face increased political risk considerations in investment decisions
Risk Management Principles During Energy Crisis Periods
Liquidity Management Protocols
Energy crisis periods demand elevated cash positions beyond normal portfolio optimisation recommendations:
Liquidity Requirements:
- Cash Allocation: Maintain 15-25% cash positions during elevated crisis risk, compared to typical 5-10% recommendations
- Instrument Liquidity: Prioritise exchange-traded funds and highly liquid securities over private market investments
- Credit Line Availability: Establish margin facilities and credit lines for opportunistic investment during market dislocations
Systematic Rebalancing During Volatility
Market dislocations create opportunities for disciplined investors willing to implement systematic approaches. However, implementing effective portfolio investment strategies requires careful consideration of crisis timing and magnitude:
Rebalancing Frequency Adjustment:
- Normal Markets: Quarterly rebalancing maintains cost efficiency
- Crisis Periods: Monthly or bi-weekly rebalancing captures volatility premiums and mean reversion opportunities
- Recovery Phases: Return to quarterly frequency as volatility normalises
Factor Rotation Strategies:
- Crisis Periods: Value factors often outperform as fear premiums create pricing dislocations
- Recovery Phases: Growth factors regain leadership as economic uncertainty diminishes
- Post-Crisis: Quality factors provide sustained outperformance as market confidence rebuilds
Investment Market Psychology During Energy Security Crises
Market Efficiency Breakdown Patterns
Energy security crises create systematic inefficiencies that informed investors can exploit:
Behavioural Finance Factors:
- Fear Premium Overreaction: Initial market responses typically overshoot fundamental impact by 20-40%
- Sector Rotation Lags: Defensive sectors often underperform initially before outperforming during sustained crises
- Geographic Bias: Investors systematically underweight energy-exporting regions during crisis periods despite fundamental benefits
Recovery Phase Investment Dynamics
Historical analysis demonstrates that markets begin recovery before complete crisis resolution, creating opportunities for positioned investors. Furthermore, oil price rally insights provide additional context for understanding how energy prices interact with broader economic policies during recovery phases.
Early Recovery Signals:
- Volatility Index Normalisation: VIX readings below crisis peaks signal returning confidence
- Credit Spread Compression: Corporate bond spreads tightening indicates improving risk appetite
- Sector Rotation Patterns: Cyclical sectors beginning outperformance suggests growth expectations improving
Market psychology during energy crises follows predictable patterns where initial panic gives way to analytical assessment of fundamental impacts. Investors who maintain disciplined approaches and avoid emotional decision-making during peak uncertainty periods typically achieve superior long-term returns through crisis cycles.
Important Investment Disclaimers: This analysis contains forward-looking statements and scenario projections that involve significant uncertainty. Strait of Hormuz closure impact on investments depends on numerous unpredictable factors including geopolitical developments, military capabilities, diplomatic interventions, and global economic conditions. Historical performance patterns may not predict future results during unprecedented crisis scenarios. Investors should conduct thorough due diligence and consider professional financial advice before implementing investment strategies based on geopolitical risk scenarios. All percentage projections and timeline estimates represent analytical frameworks rather than guaranteed outcomes.
Could Your Portfolio Weather a Strait of Hormuz Disruption?
Discovery Alert's proprietary Discovery IQ model delivers real-time alerts on significant ASX mineral discoveries, helping investors identify actionable opportunities ahead of the broader market during times of global uncertainty. Position yourself for historic discovery returns and begin your 14-day free trial today to secure your market-leading advantage.