July 27, 2026
The Fear Premium That Wasn't: Understanding How Geopolitical Risk Gets Priced Into Crude Oil
Every barrel of crude oil traded on global markets carries two embedded values: the fundamental cost of extracting and delivering that oil, and an additional layer of pricing that reflects the world's current level of fear. This second component, widely referred to among energy traders as the geopolitical risk premium, can add anywhere from a few dollars to tens of dollars per barrel depending on the severity of perceived supply threats. When that fear subsides, even temporarily, markets do not adjust gradually. They reprice instantly, and the magnitude of the correction can be startling.
That dynamic played out in dramatic fashion on July 27, 2026, when Brent and WTI oil prices fell over 5 percent in a single session, unwinding weeks of accumulated tension-driven gains in the span of a few trading hours. Understanding why this happened requires more than tracking a single headline. It demands a structured look at how geopolitical pricing works, what the U.S. housing market has to do with diesel consumption, and why two of the world's most influential energy bodies cannot agree on where demand is headed.
When big ASX news breaks, our subscribers know first
How the Geopolitical Risk Premium Gets Built Into Crude Benchmarks
Oil markets are forward-looking by design. Futures contracts price in not just current supply and demand conditions, but the probability distribution of future disruptions. When conflict escalates near critical energy infrastructure or shipping corridors, traders assign a higher probability to supply disruption scenarios. That elevated probability gets priced in as a premium above fundamental value. Understanding the geopolitical oil price drivers behind these movements is essential for any serious market participant.
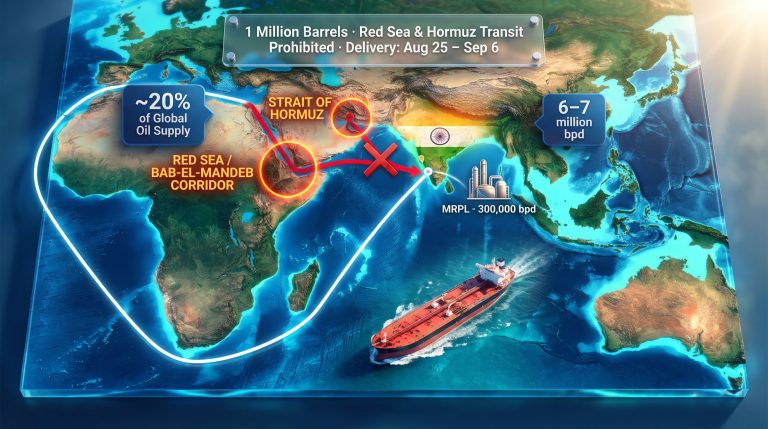
The Strait of Hormuz sits at the centre of this calculus. This narrow maritime passage between Iran and Oman handles approximately 20 percent of the world's traded oil, making it the single most consequential chokepoint in the global energy system. Iranian military posturing near this corridor, attacks on tankers in the Persian Gulf, or threats to regional energy infrastructure all feed directly into crude pricing models. Even partial disruption scenarios carry enormous implied costs when applied to the volumes transiting that waterway daily.
What a Military Pause Actually Communicates to Energy Markets
A temporary halt in military exchanges does not eliminate the underlying risk. What it does is shift the probability weighting traders assign to near-term supply disruption. When the perceived likelihood of an immediate Hormuz closure falls, the premium associated with that scenario compresses rapidly. The result is a price correction that can look outsized relative to the actual change in physical supply conditions, because the premium being unwound was itself forward-looking and probabilistic.
Analysis from Zaye Capital Markets noted that the immediate price decline in this session reflected precisely this mechanism: a compression of the risk premium following a temporary pause in U.S.-Iran hostilities, which reduced fears around Gulf export disruptions and passage conditions through the Strait. Critically, ongoing U.S. statements maintaining a posture of readiness for further military action prevented markets from treating the de-escalation as a permanent resolution. That distinction mattered for how deeply traders were willing to sell.
Brent Crude vs. WTI: The Benchmarks Behind the Headlines
When Brent and WTI oil prices are down over 5 percent simultaneously, it signals a systemic shift in sentiment rather than a supply event affecting one particular region. The two benchmarks serve different but complementary functions in global energy pricing.
| Benchmark | Geographic Origin | Primary Role | Price (July 27, 2026) | Session Change |
|---|---|---|---|---|
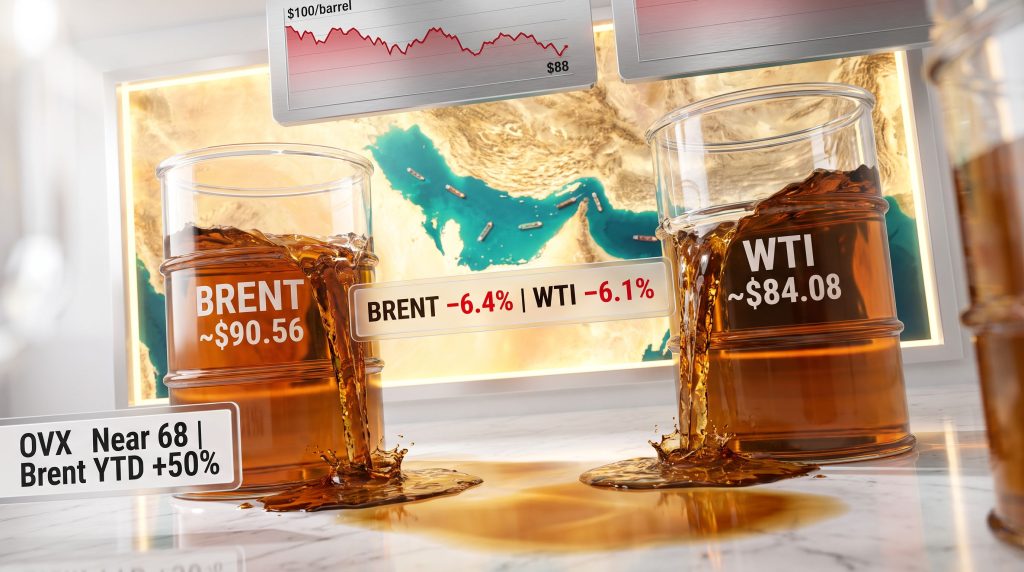
| Brent Crude | North Sea | Global pricing reference | ~$90.56/barrel | -5.2% to -6.4% |
| WTI Crude | Cushing, Oklahoma | U.S. domestic reference | ~$84.08/barrel | -5.4% to -6.1% |
| Natural Gas | Henry Hub | Power and heating | ~$2.77/MMBtu | -3.38% |
At the session's most extreme point, Brent fell as much as 7.4 percent, briefly trading below $90 per barrel before stabilising near $88 during European morning trading, according to analysis published by Saxo Bank. WTI declined approximately 5 percent to trade near $85. Natural gas, which carries its own sensitivity to broader energy sentiment, fell 3.38 percent to $2.77/MMBtu. For a detailed breakdown of these moves, CNN News18 reported on Brent crude falling to $87.3 while WTI dropped to $84.88 at various session points.
The simultaneous decline across all three commodities reflects how geopolitical de-escalation affects the entire energy complex, not just crude. When the Gulf risk premium compresses, energy traders reassess correlated positions across the board.
The Escalation That Created the Premium: A 2026 Rally in Context
To appreciate the significance of a single-session decline of this magnitude, the prior rally must be understood in full. In late July 2026, Brent crude briefly surpassed $100 per barrel, a level last observed in late May 2026. In the weeks leading up to the correction, the benchmark had risen approximately 38 percent in a single month, representing one of the most compressed and violent upswings in crude pricing in recent memory.
Even after the July 27 correction, Brent remained up more than 50 percent year-to-date as of late July 2026, as noted in Saxo Bank's market commentary. That context is essential. A 5 to 7 percent single-session decline sounds alarming in isolation. Against a backdrop of a 50-plus percent annual gain, it reads differently: a partial reversion from a highly elevated risk-premium state, not a structural reversal of trend.
The factors that built the premium were significant. Houthi attacks on Red Sea tankers, threats from U.S. leadership regarding potential large-scale military action against Iran, and strikes on the Caspian Pipeline Consortium terminal, which handles the majority of Kazakh crude exports, all converged to create an environment of genuine supply disruption concern. Houthi claims of continued attacks on Saudi targets kept a residual risk premium embedded in prices even after the session-low correction, with the oil volatility index (OVX) holding near 68, a reading that represents one of the most elevated corners of the broader volatility complex.
The OVX Reading and What Elevated Volatility Signals
The OVX measures implied volatility in crude oil options markets and functions as a fear gauge for energy traders. A reading near 68 is significantly above historical averages and indicates that options market participants are pricing in a wide distribution of potential outcomes for crude prices. High OVX readings are associated with conditions where binary outcomes, such as military escalation versus diplomatic resolution, dominate the pricing environment rather than fundamental supply-demand analysis.
Three Bearish Catalysts Converging on a Single Session
The July 27 session did not decline on a single trigger. Three distinct bearish forces arrived simultaneously, amplifying the selling pressure:
- Diplomatic de-escalation from the temporary U.S.-Iran military pause compressed the geopolitical risk premium that had been building for weeks.
- Softer U.S. housing data provided a mildly bearish demand signal, indicating that construction-related petroleum consumption was unlikely to accelerate in the near term.
- Divergent global demand forecasts from OPEC and the IEA created positioning uncertainty, prompting traders to reduce exposure ahead of later-week economic releases.
Each of these factors would have generated moderate market movement in isolation. Together, they created a compounding effect that pushed the decline well beyond what any single variable would have produced.
The Housing Market Connection: Why Construction Data Moves Oil Prices
The relationship between residential construction activity and petroleum demand is less intuitive than the Gulf shipping connection but equally real. Housing development generates demand across the downstream fuel chain: diesel for construction equipment, freight fuel for materials logistics, and broader household energy consumption as newly built homes enter the grid.
| Housing Metric | June 2026 Reading | Year-Over-Year Change |
|---|---|---|
| New Home Sales (Annualized Rate) | 628,000 units | -5.6% vs. June 2025 |
| Month-over-Month Change | +1.6% | Stabilizing |
| Median Selling Price | $398,300 | -3.3% |
| Average Selling Price | $475,400 | Elevated |
| Months of Supply Available | 9.3 months | Above historical norms |
The June 2026 data showed a 1.6 percent month-over-month increase in new home sales to an annualised rate of 628,000 units, which might initially appear constructive. However, the year-over-year reading tells a more cautious story: sales remained 5.6 percent below June 2025 levels. The median selling price fell 3.3 percent to $398,300, and available supply sat at 9.3 months, a level associated with excess inventory rather than a healthy demand-driven market.
A housing market in stabilisation mode, rather than expansion, generates limited incremental demand for construction fuels and freight energy. When layered on top of geopolitical de-escalation, this creates a compounding bearish environment for crude pricing that can accelerate selling beyond what either factor would produce alone.
Analysis from Zaye Capital Markets characterised these figures as indicating stabilisation without strong expansion, suggesting that construction, freight, and household activity are not generating sufficient momentum to drive a meaningful increase in petroleum consumption. That framing captures precisely why housing data, typically considered a macro-economic indicator, carries genuine relevance for short-term crude pricing.
The next major ASX story will hit our subscribers first
OPEC and the IEA: A Forecast Divergence That Creates Market Uncertainty
One of the less-discussed structural dynamics in current oil markets is the widening gap between the demand projections published by the two most closely watched energy institutions in the world. Furthermore, OPEC's influence on oil markets extends well beyond simple supply decisions, shaping how traders interpret global consumption trends.
OPEC projects global oil demand growth of approximately 0.8 million barrels per day in 2026, reflecting a relatively constructive view of consumption recovery across developing economies and continued industrial expansion. The International Energy Agency (IEA) maintains a softer consumption outlook, with continued uncertainty around the pace of supply recovery and demand trajectory across advanced economies.
This divergence is more than an academic disagreement. When traders cannot anchor to a consensus demand forecast, they are forced to hold a wider range of price scenarios simultaneously. That uncertainty increases the volatility of positioning decisions, particularly ahead of scheduled data releases or policy decisions. Divergent forecasts effectively keep the market in a state of perpetual re-evaluation, where a single data point can trigger disproportionate position adjustments.
The Tariff Variable: How U.S. Trade Policy Creates a Two-Way Oil Price Effect
U.S. tariff policy has become an increasingly significant variable in crude oil pricing models, and its effect operates in both directions simultaneously. The trade war impact on oil is particularly complex because, unlike traditional supply shocks, tariff-driven dynamics introduce structural ambiguity rather than directional clarity.
Analysis from Zaye Capital Markets articulated this clearly: domestic investment and industrial expansion driven by tariff-induced reshoring may support energy consumption growth, while the higher costs, weaker global trade volumes, and tighter financial conditions that tariffs generate in offshore trading partners could reduce overall fuel demand internationally. Consequently, the trade tensions and oil prices relationship remains one of the most contested analytical questions in current energy markets.
The net effect on oil demand depends on which force dominates, and that balance can shift depending on the scope, duration, and retaliatory responses to any given tariff regime.
Upside Risk Scenarios: What Could Reverse the Decline
The current price environment should not be interpreted as a settled equilibrium. Several credible scenarios exist that could rapidly restore the supply-risk premium:
- Renewed attacks on Gulf tankers or Saudi energy infrastructure would immediately reintroduce fears of supply disruption at scale, likely pushing Brent back above $95 within a single session.
- A breakdown in U.S.-Iran diplomatic positioning that restores full military escalation expectations would unwind the de-escalation premium reduction and return crude toward recent highs.
- Stronger-than-expected U.S. economic data later in the week, particularly any reading that shifts Federal Reserve rate expectations or signals accelerating industrial activity, could lift demand forecasts and support prices.
- Houthi escalation in the Red Sea remains an ongoing residual risk that keeps a baseline premium in place regardless of U.S.-Iran positioning.
Crude oil markets remain acutely sensitive to shipping security conditions across the Strait of Hormuz, Red Sea tanker corridors, and Caspian export infrastructure. Any escalation involving these routes could rapidly restore the supply-risk premium that was unwound in this session.
Indeed, broader analysis of oil trade and geopolitics confirms that these shipping corridors represent the most consequential near-term risk variables for crude benchmarks globally.
Key Market Drivers to Watch Through the Rest of the Week
With no major economic releases scheduled for July 27, traders identified several catalysts with the potential to drive meaningful price movement in subsequent sessions:
- The Federal Reserve decision on Wednesday carries significant relevance for oil prices through two channels: interest rate signals affect broader economic activity and therefore energy demand expectations, while any shift in rate trajectory influences the strength of the U.S. dollar, which has an inverse relationship with dollar-denominated commodity prices.
- Inventory data releases from the EIA will provide real-time insight into whether physical demand is keeping pace with production levels. Rising stockpiles would reinforce downside pressure; drawdowns would provide support.
- Geopolitical headline risk from Houthi activity, Iran negotiation developments, and U.S. military posturing remains the primary variable. In an environment where OVX holds near 68, a single significant headline can generate multi-percent swings within hours.
- U.S. dollar strength warrants monitoring as a structural headwind or tailwind for crude. A stronger dollar raises the effective cost of oil for non-dollar buyers, typically suppressing demand and weighing on prices.
The Bigger Picture: What a 50-Percent Annual Gain Means for Energy Market Risk
Stepping back from the session-level volatility, the 2026 oil market tells a story about how geopolitical risk can fundamentally reshape commodity pricing over compressed timeframes. A benchmark that has gained more than 50 percent year-to-date while simultaneously experiencing intraday swings of 7 percent is not behaving according to traditional fundamental analysis frameworks. Moreover, reporting from OilPrice.com on the 5 percent tumble amid signs of U.S.-Iran de-escalation provides further context on how rapidly sentiment-driven corrections can unfold.
For energy investors and market participants, this environment demands a different analytical posture. The distinction between structural demand trends and cyclical geopolitical noise becomes critical. Structural factors, including global fleet electrification progress, non-OECD demand growth, and long-term production capacity investment decisions, operate on multi-year timescales. Geopolitical risk premiums, by contrast, can arrive and depart within days.
The current episode illustrates both the speed at which risk premiums can be built and the equally rapid pace at which they can be dismantled. With the OVX elevated, diplomatic outcomes uncertain, and demand forecasts split between two major institutions, the second half of 2026 appears likely to sustain the volatility conditions that have defined this market throughout the year. With Brent and WTI oil prices down over 5 percent in a single session, the episode serves as a timely reminder that in today's energy markets, fear itself carries a measurable price.
Readers seeking ongoing coverage of global oil market developments, price data, and geopolitical energy analysis can access reporting and professional resources at Rigzone.com, a leading information platform serving the oil and gas industry.
This article contains forward-looking statements, market analysis, and third-party forecasts. All price levels and percentage movements referenced reflect conditions reported as of July 27, 2026, and are subject to rapid change. Nothing in this article constitutes financial or investment advice. Readers should conduct independent research before making any investment decisions.
Want to Spot the Next Major Resource Discovery Before the Market Does?
Discovery Alert's proprietary Discovery IQ model scans ASX announcements in real time, instantly identifying significant mineral discoveries and translating complex data into actionable insights — explore the historic returns major discoveries have generated and begin your 14-day free trial to position yourself ahead of the broader market.