June 17, 2026
The Infrastructure Blind Spot That's Quietly Reshaping Global Metals Markets
Most commodity analysts tracking the artificial intelligence investment cycle have anchored their metals demand models to a familiar set of inputs: server counts, GPU deployments, rack densities, and cooling unit specifications. This facility-centric approach feels intuitive, but it systematically underestimates the true scale of metals consumption by capturing only the most visible and most bounded layer of a far larger system.
The deeper story behind data centre metals demand and grid infrastructure investment is not found inside the server room. It begins at the facility boundary and extends across thousands of kilometres of transmission networks, substations, and generation assets that most demand models treat as background noise rather than primary variables.
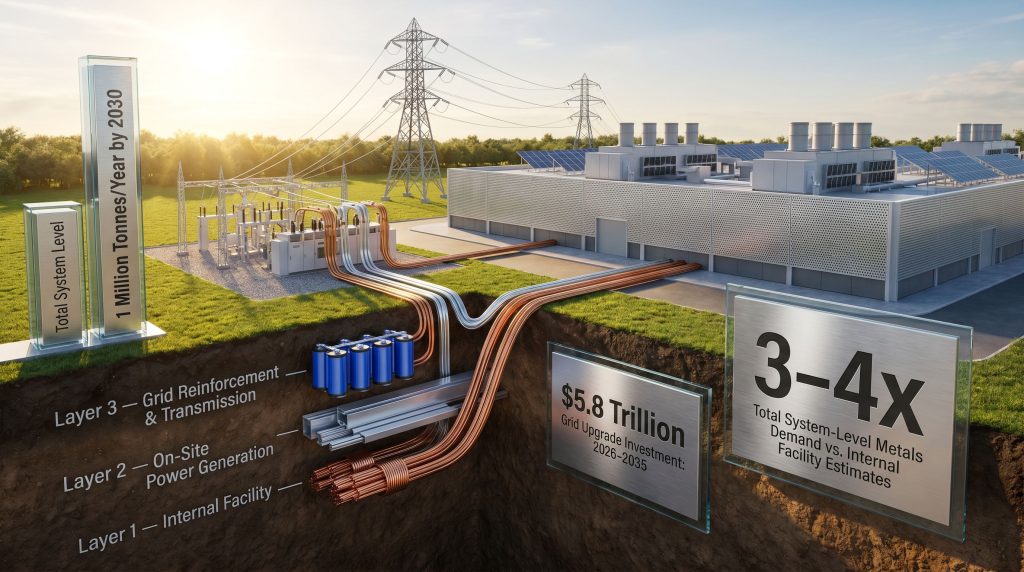
Research published by Wood Mackenzie titled Data centre metals demand: it's all about the infrastructure not internals makes this structural gap explicit. When grid reinforcement, on-site power generation, and transmission network upgrades are incorporated alongside internal facility requirements, total system-level metals consumption reaches an estimated three to four times the volume implied by the data centre asset alone. For investors and grid planners operating with facility-only assumptions, that multiplier represents a material analytical error.
When big ASX news breaks, our subscribers know first
A Three-Layer Framework for Understanding System-Level Metals Demand
The most useful way to understand data centre metals demand is through a layered architecture that maps consumption from the inside out. Each layer has a distinct growth profile, a different mix of primary metals, and a different relationship to underlying compute demand.
Layer One: What Sits Inside the Facility?
Internal facility requirements represent the most widely discussed component of data centre metals consumption, and paradoxically the most bounded. Aluminium dominates internal demand, concentrated in two primary applications:
- Cooling infrastructure, which accounts for approximately 55% of internal aluminium use
- Racking systems and structural enclosures, which account for approximately 25% of internal aluminium demand
Copper's role inside the facility is anchored by performance requirements at high-density compute nodes, where power density and system complexity drive specifications rather than structural considerations. Both metals are currently growing at approximately 8% to 10% per year into the early 2030s.
Total aluminium demand within the facility is expected to peak at 600,000 to 900,000 tonnes per year before declining toward the late 2030s. AI-driven design optimisation and efficiency improvements are projected to drive a reversal of approximately 2% to 3% per year from peak levels.
This is the critical structural insight that most facility-level analyses miss: internal demand is front-loaded and bounded. Compute demand may continue accelerating, but the metals intensity per unit of compute will decline as liquid cooling architectures mature and chip-level power efficiency improves.
Layer Two: On-Site Power Generation at the Facility Boundary
The second layer is where the demand multiplier effect begins. As grid connection queues lengthen and local power capacity tightens, data centre operators are engineering standalone power generation capacity directly into the facility footprint. This trend reflects a fundamental shift in how hyperscale infrastructure is being designed: uptime guarantees can no longer be delegated entirely to grid reliability.
On-site generation now spans a diverse and expanding technology mix:
- Solar and wind installations paired with battery energy storage systems
- Gas engines and open-cycle gas turbines
- Solid oxide fuel cells, which convert natural gas to electricity with high efficiency and low emissions
- Emerging small modular reactor (SMR) concepts, which remain at early feasibility stages but represent a credible long-term option for baseload on-site power
A crucial distinction separates this layer from internal facility demand: on-site generation does not scale proportionally with compute load. It is engineered independently to guarantee uptime regardless of external grid conditions. The physical infrastructure required to sustain 99.9999% availability (the "six nines" standard that hyperscale operators target) must be sized for worst-case scenarios, not average operating conditions.
Wood Mackenzie estimates that on-site power systems effectively double the metals demand implied by internal facility requirements alone. Aluminium expands across busways, structural housings, and power distribution systems. Copper scales across high-load interconnections and grounding infrastructure. Furthermore, battery backup systems simultaneously drive demand for lithium, cobalt, and nickel, extending the critical minerals demand footprint well beyond the base metals complex.
Layer Three: Grid Reinforcement and Transmission Networks
The third layer is where physics takes over from economics as the primary demand driver. Annual data centre-driven power capacity additions are projected to rise from approximately 15 to 20 GW today to a peak of 30 to 33 GW in the early 2030s, stabilising at structurally elevated levels thereafter.
Asia-Pacific is forecast to account for more than half of global capacity additions during the peak phase. North America leads early-stage deployment, where grid connection backlogs in markets like Northern Virginia now stretch beyond five years because physical infrastructure cannot yet accommodate approved project loads.
Wood Mackenzie's research makes clear that at this layer, metals demand is no longer driven by the data centre itself. It is driven by the power system required to sustain it. The data centre is the catalyst. The grid is the primary consumer.
Aluminium dominates at this layer, scaling across overhead transmission lines, conductor systems, and utility-scale generation frameworks. Copper scales across substations, underground cable connections, and generation-side electrical systems. Critically, the allocation between the two metals is not determined by relative commodity pricing. It is determined by the physical performance constraints of each application type.
Aluminium's conductivity-to-weight ratio makes it the rational choice for long-distance overhead transmission regardless of price differentials. Copper's superior conductivity in constrained spaces defines its role in underground and substation applications. The grid infrastructure buildout is forecast to require approximately $5.8 trillion between 2026 and 2035 to support AI infrastructure, electric vehicle integration, and renewable energy buildout. This represents one of the largest coordinated infrastructure investment cycles in history.
Aggregated System-Level Demand: The Numbers in Context
| Demand Layer | Primary Metals | Key Driver | Growth Trajectory |
|---|---|---|---|
| Internal Facility | Aluminium, Copper | Cooling, racking, compute density | Peaks early 2030s, then declines |
| On-Site Power Generation | Aluminium, Copper, Li, Co, Ni | Grid unreliability, uptime guarantees | Scales with capacity additions |
| Grid Reinforcement | Aluminium (dominant), Copper | Network load absorption, new connections | Peaks ~30-33 GW/yr early 2030s |
| Total System Level | Aluminium + Copper | All three layers combined | 3-4x internal-only estimates |
Global data centres are expected to consume over 1 million tonnes per year of copper and aluminium combined by 2030. Copper usage across the full data centre ecosystem is forecast to grow approximately six-fold by 2050, rising from roughly 0.5 million tonnes per year today toward 3 million tonnes per year. Every megawatt of added data centre capacity embeds an estimated 60 to 75 tonnes of minerals, concentrated in power and cooling systems rather than compute hardware. AI training facilities alone are projected to account for 58% of total data centre copper demand by 2030.
Is a Structural Copper Supply Crisis Forming Beneath the AI Buildout?
The Emerging Shortfall
Approximately 4.3 million tonnes of copper is expected to be associated with data centres and adjacent power infrastructure by 2035. Current mining and smelting capacity trajectories suggest a potential 25% to 30% copper supply shortfall by the mid-2030s if expansion does not accelerate commensurately. This is not a speculative scenario confined to bear-case modelling. It reflects the arithmetic of known demand projections against documented production pipelines.
The copper supply crunch is increasingly characterised by industry analysts as a physical ceiling on the AI infrastructure buildout — a constraint that price signals alone may not resolve quickly enough given the 10 to 15 year development cycles typical of large copper mining projects.
Real-World Intensity Benchmarks
The gap between theoretical demand models and real-world copper intensity becomes visible in documented project data:
- Microsoft's 80 MW Chicago data centre facility required approximately 2,100 tonnes of copper, equating to roughly 26 tonnes per MW including on-site and near-site connections
- Legacy facilities typically consumed 5,000 to 15,000 tonnes of copper across their operational lifetimes
- AI-ready hyperscale campuses require an estimated 3 to 4 times the copper volume of equivalent legacy facilities due to elevated power loads and liquid cooling infrastructure requirements
- Large hyperscale campuses covering approximately 75,000 m² require around 10,000 tonnes of steel, while multi-building sites approaching 1.7 million m² can require up to 200,000 tonnes of steel for structural requirements alone
The Grid Connection Queue as a Leading Indicator
One of the most revealing indicators of infrastructure stress is not a commodity price or a production statistic. It is the length of the grid connection queue. In Northern Virginia, the world's most concentrated data centre market, approved projects are waiting more than five years for physical grid connections because the transmission infrastructure to support them does not yet exist.
Data centres are forecast to consume more than 1,000 TWh of electricity annually by 2030, with potential to double by 2040. In Ireland, data centres already represent approximately 20% of total national electricity consumption, illustrating the acute and disproportionate grid pressure that concentrated data centre deployment places on smaller electricity markets. This localised strain is a preview of challenges that will emerge across multiple regions as the buildout accelerates.
Aluminium's Structural Role Across All Three Demand Layers
A common misconception in commodity market analysis frames aluminium as a potential price-driven substitute for copper in power infrastructure applications. However, the three-layer framework dismantles this narrative. Aluminium does not occupy copper's applications when copper becomes expensive. It occupies structurally distinct applications across all three demand layers simultaneously.
Data centre power capacity is projected to exceed 200 GW globally by 2030, driving sustained aluminium demand across:
- Overhead transmission conductors serving new grid connections
- Wire and cable systems within on-site generation facilities
- Extrusions for structural and thermal management applications
- Cooling system components and heat exchange infrastructure within facilities
The outcome, as Wood Mackenzie's research concludes, is not substitution between the two metals. It is co-dependent expansion across the base metals complex. Both metals are required at scale across all three demand layers, and the removal or shortage of either creates system-level bottlenecks rather than substitution opportunities.
Beyond Base Metals: The Critical Minerals Dimension
Compute Hardware and Specialised Mineral Requirements
The specialised minerals embedded in compute hardware represent a less discussed but equally significant demand category. According to the World Economic Forum, server boards, GPUs, and semiconductor components require a distinct set of critical minerals for conductivity, corrosion resistance, and performance at extreme operating temperatures:
- Germanium and gallium for semiconductor substrates and compound semiconductors
- Tantalum for capacitors in high-frequency electronic systems
- Silver, gold, and palladium for bonding wires, contact surfaces, and corrosion-resistant connections
A single high-performance GPU such as the Nvidia H100 draws in excess of 700 watts. A facility operating 100,000 such units generates gigawatt-scale compute demand alongside substantial critical mineral consumption embedded in the hardware itself.
Battery Storage and UPS Systems
As on-site renewable generation with battery storage becomes standard practice, uninterruptible power supply (UPS) systems scale proportionally with facility power capacity. This creates structural demand for the battery raw materials — specifically lithium, cobalt, and nickel — that grows alongside every megawatt of added on-site generation capacity. The battery metals dimension of the data centre buildout remains significantly underrepresented in mainstream commodity demand forecasts.
The next major ASX story will hit our subscribers first
Regional Demand Dynamics: Where the Buildout Is Most Concentrated
North America: First-Mover Stress Already Visible
North America leads early-phase deployment, and the grid stress that follows is already measurable. Connection backlogs in Northern Virginia demonstrate that infrastructure investment is lagging behind approved capacity. Copper and aluminium demand from grid reinforcement programmes is accelerating ahead of facility completions, creating near-term commodity demand pull that precedes the compute capacity it is designed to support.
Asia-Pacific: The Peak Phase Epicentre
Asia-Pacific is forecast to account for more than 50% of global data centre power capacity additions during the peak phase of the early 2030s. The scale of grid reinforcement required across markets including China, Japan, South Korea, India, and Southeast Asia represents one of the largest single-region metals demand catalysts in the commodity cycle.
Europe: Localised Grid Strain and Regulatory Complexity
Europe's data centre buildout is concentrated in a small number of markets where grid capacity and land availability are constrained. Ireland's situation, where a single sector now consumes approximately 20% of national electricity, illustrates how disproportionate the grid impact can become in smaller markets. European regulatory frameworks around land use, water consumption, and power allocation will shape the timing and geography of buildout, potentially redirecting capacity additions to markets with greater grid headroom.
Scenario Analysis: What the Demand Curve Looks Like to 2040
Base case: Internal facility demand peaks in the early 2030s and declines at 2% to 3% per year as AI-driven design optimisation reduces per-unit metals intensity. Grid and on-site generation demand remains structurally elevated through the mid-2030s, sustaining total system-level consumption well above pre-AI baselines. Data centres rise from approximately 2% to 9% of total global electricity demand between now and 2050.
Bull case: If the $5.8 trillion grid upgrade cycle accelerates under policy pressure, or if AI adoption exceeds current deployment forecasts, the copper demand drivers could materially outpace consensus projections. Given that copper mining projects require 10 to 15 years from discovery to production, supply-side response will be structurally delayed, potentially translating demand acceleration into commodity price pressure.
Bear case: Breakthrough efficiency gains in liquid cooling, chip architecture, or power conversion could compress the internal demand peak earlier than current models anticipate. However, grid reinforcement demand is largely independent of facility-level efficiency improvements. The infrastructure required to connect and sustain already-approved capacity will continue driving metals consumption regardless of how efficient individual compute units become.
Key Takeaways for Investors and Grid Planners
The following points summarise the structural conclusions that emerge from a full system-level analysis of data centre metals demand and grid infrastructure investment:
- The data centre metals demand story is a three-layer system problem, not a single-asset consumption question
- Internal facility demand is front-loaded and bounded; grid and generation-side demand is structural and durable through the mid-2030s
- Total system-level consumption is 3 to 4 times the volume implied by facility-level analysis alone — a material difference for commodity positioning
- Copper faces a potential 25% to 30% supply shortfall by the mid-2030s, representing a fundamental physical constraint on global AI infrastructure capacity
- Aluminium and copper are co-dependent, not competing. Both are required at scale across all three demand layers
- Asia-Pacific represents the peak-phase demand epicentre; North America is the early-deployment leading indicator where current grid stress is already measurable
- Grid upgrade investment of approximately $5.8 trillion over 2026 to 2035 will be the primary metals demand driver, not the data centres themselves
- Battery metals including lithium, cobalt, and nickel are embedded in the demand picture through UPS and on-site storage systems, extending the critical minerals footprint beyond base metals
This article contains forward-looking projections and demand forecasts sourced from Wood Mackenzie research and independent industry analysis. These projections involve assumptions about future technology adoption, capital investment, and commodity supply that are subject to material uncertainty. Nothing in this article constitutes financial advice. Readers should conduct independent research before making investment decisions.
For further analysis of base metals demand trends and grid infrastructure investment, Mining Weekly at miningweekly.com provides ongoing coverage of commodity market developments across the global mining and energy transition sectors.
Want to Position Ahead of the Next Major Copper or Aluminium Discovery?
Discovery Alert's proprietary Discovery IQ model scans ASX announcements in real time, instantly identifying significant mineral discoveries across copper, aluminium, and the broader critical minerals complex — turning complex data into actionable insights before the broader market reacts. Explore how historic discoveries have generated substantial returns on Discovery Alert's dedicated discoveries page, and begin your 14-day free trial today to secure a market-leading edge as the $5.8 trillion grid infrastructure cycle accelerates.