
July 23, 2026
When More Output Means Less Money: The Paradox Reshaping the Diamond Industry
In commodity markets, the relationship between production volume and revenue is rarely straightforward. When a producer increases output by nearly half yet watches its revenue contract by nearly a quarter in the same period, something structurally significant is occurring beneath the surface. The global rough diamond market in 2026 offers a masterclass in exactly this kind of disconnect, where operational improvements at the mine face are being systematically overwhelmed by forces operating at the demand and pricing level.
Understanding why De Beers rough diamond production increases but prices and demand remain under pressure requires looking beyond the headline carat numbers and into the mechanics of product mix, synthetic competition, and the evolving psychology of luxury consumers worldwide.
When big ASX news breaks, our subscribers know first
What the H1 2026 Numbers Actually Reveal
The raw data from De Beers' first-half 2026 performance presents a striking contradiction for anyone who expects volume and revenue to move in the same direction.
| Metric | H1 2026 | H1 2025 | Year-on-Year Change |
|---|---|---|---|
| Total rough diamond production | 14.91 million carats | ~10.21 million carats | +46% |
| Q2 rough diamond production | 7.8 million carats | ~4.15 million carats | +88% |
| Rough diamond sales volume (H1) | 14.78 million carats | ~12.32 million carats | +20% |
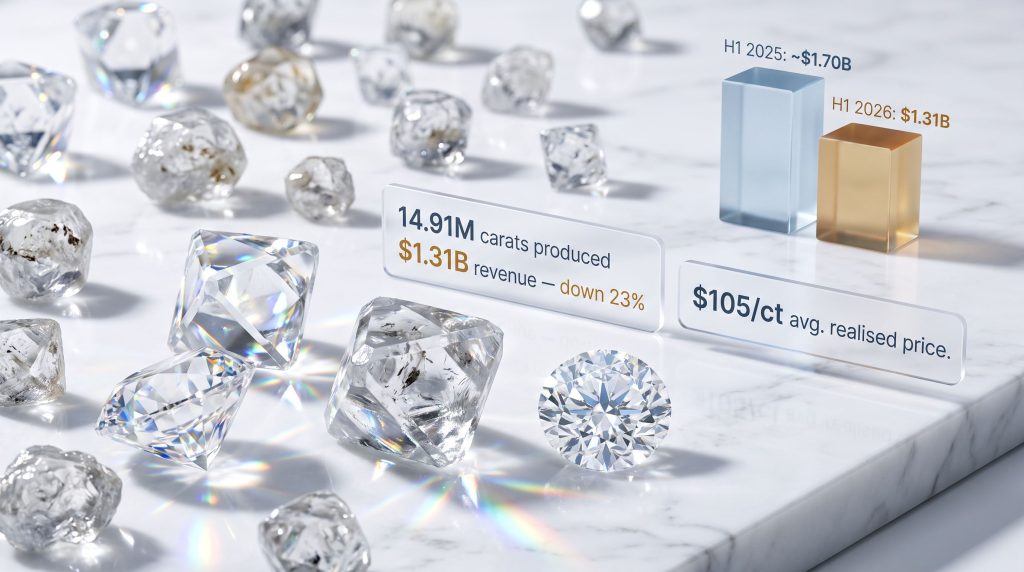
| Rough diamond sales revenue (H1) | $1.31 billion | ~$1.70 billion | -23% |
| Q2 rough diamond sales volume | 7.1 million carats | ~7.63 million carats | -7% |
| Q2 rough diamond sales revenue | $665 million | ~$1.19 billion | -44% |
| Consolidated average realised price | $105/ct | ~$155/ct | -32% |
| Average rough price index change | N/A | N/A | -16% |
The figures above tell a story that goes beyond simple market weakness. De Beers sold 20% more carats in H1 2026 than in the prior comparable period, yet generated 23% less revenue. In Q2 specifically, the divergence becomes even more stark: a 7% decline in sales volumes coincided with a 44% collapse in revenue, producing an average realised price of just $105 per carat compared with approximately $155 per carat a year earlier.
Two forces are driving the $105/ct average realised price: a shift toward lower-value goods within the sales mix, and a 16% decline in the average rough price index reflecting genuine market-wide pricing weakness rather than a company-specific issue.
Why the 88% Q2 Production Surge Is Largely a Statistical Artefact
The 88% year-on-year jump in Q2 production demands careful interpretation. The comparison period, Q2 2025, was significantly impacted by an extended maintenance shutdown at the Orapa mine in Botswana, which artificially depressed the base. When a mine of Orapa's scale undergoes prolonged maintenance, the comparative quarter becomes an anomalously low reference point, making any subsequent recovery appear far more dramatic than underlying operational trends would justify.
This is a classic base-effect distortion in commodity reporting, and investors who focus on the percentage change without accounting for the distorted denominator risk misreading the operational signal. The 46% half-year production increase tells a more measured story than the 88% Q2 figure, though both are significantly influenced by the Orapa maintenance comparison.
A Mine-by-Mine Breakdown: Where Production Is Coming From
Botswana: The Dominant Engine
Botswana remains the backbone of De Beers' global production portfolio, and H1 2026 performance from the country reflects both the base-effect dynamics and genuine ore quality improvements at the Jwaneng mine. Furthermore, understanding commodity prices and mining performance helps contextualise why increased output has not translated into proportional revenue gains.
- Q2 production: 5.5 million carats, up 107% year-on-year
- H1 production: 10.3 million carats, up 43% year-on-year
- Key drivers include planned processing of higher-grade ore at Jwaneng and the absence of the Orapa shutdown that constrained Q2 2025
Jwaneng is widely regarded as one of the highest-value diamond mines in the world, not merely because of its carat output but because of the gem quality and average stone value of its production. When Jwaneng processes higher-grade ore zones, the impact on revenue per carat can be meaningful, though this benefit is being offset by broader market pricing headwinds in the current cycle.
Namibia: Marine Mining's Unique Operational Variability
Namibia's offshore diamond operations introduce a category of operational risk that is entirely distinct from terrestrial mining, and H1 2026 illustrated this clearly.
- Q2 production: approximately 500,000 carats, broadly flat year-on-year
- H1 production: 1.09 million carats, down 7% year-on-year
- The retirement of the Coral Sea vessel and planned maintenance of the Mafuta vessel at Debmarine Namibia reduced output, partially offset by higher-grade area mining at Namdeb's land operations
Marine diamond mining along the Namibian coastline and seabed involves purpose-built diamond recovery vessels that use seabed crawlers, bulk sampling systems, and sophisticated processing plants aboard ship. The operational lifecycle of these vessels, their maintenance schedules, and their retirement timelines create production variability that has no equivalent in conventional open-pit or underground mining. The retirement of a vessel is a capital-intensive and strategically significant decision, not merely a maintenance event.
South Africa's Venetia: A Deliberately Engineered Pause
The Venetia mine's H1 2026 performance was strong on paper, with Q2 production rising 24% year-on-year to 700,000 carats and half-year output climbing 37% to 1.47 million carats, driven by higher underground ore volumes. However, the more consequential development is forward-looking rather than historical.
De Beers announced a two-year production halt at Venetia commencing in H2 2026, designed to reduce operating costs and rephase capital expenditure on the underground development project. This is a capital discipline decision, not an operational failure.
The distinction matters enormously for how investors interpret the signal. Venetia is undergoing a transformation from open-pit to underground mining, a transition that requires sustained capital investment over many years. Pausing production allows De Beers to reduce cash outflows during a period of compressed rough diamond pricing, preserving financial flexibility for when market conditions improve. The underground project itself remains intact; its timeline is being adjusted rather than abandoned.
Canada's Gahcho Kué: Geographic Diversification in Practice
Production at the Gahcho Kué joint venture in Canada's Northwest Territories reached approximately one million carats in Q2, driven by planned processing of higher-grade ore from a newly accessed mining area. Canada's contribution to De Beers' portfolio provides meaningful geographic diversification away from southern African operational and political risk concentrations. In an era of heightened awareness around geopolitical risks in mining, this diversification carries strategic value beyond its contribution to carat output.
Deconstructing the Pricing Collapse
Product Mix and the Blended Average Price Trap
The 32% decline in consolidated average realised price to $105 per carat is the result of two compounding mechanisms operating simultaneously.
-
Sales mix deterioration: A higher proportion of smaller, lower-quality carats in the H1 2026 sales portfolio mathematically reduces the blended average price, even if individual price categories remain stable. This is not a market price decline in isolation; it is a compositional shift in what is being sold.
-
Genuine market price weakness: A 16% decline in the average rough price index confirms that pricing weakness is real and market-wide, not merely a De Beers-specific or mix-related artefact.
When both forces act simultaneously, the resulting average price compression appears far more severe than either factor alone would produce, and the $105/ct figure reflects exactly this compounding dynamic.
Lab-Grown Diamonds and the Bifurcation of the Market
The competitive pressure from synthetic lab-grown diamonds (LGDs) on the natural diamond market is not uniformly distributed, and this nuance is critical to understanding where the structural damage is concentrated.
- LGDs have made the most significant inroads in lower-value, smaller-stone categories, where price sensitivity among consumers is highest
- The price of lab-grown diamonds has declined dramatically over the past five years as production technology has scaled, accelerating substitution at the value end of the market
- Higher-value, larger natural diamonds have demonstrated relative pricing resilience, and De Beers itself noted that stronger pricing for higher-value goods supported a stable overall average price index throughout H1 2026
- This creates a bifurcated market structure where the luxury tier and the value tier face fundamentally different competitive dynamics
The unresolved structural question facing the entire natural diamond industry is whether LGD penetration stabilises at current levels, concentrated in value-tier categories, or whether it continues expanding upward into mid-tier natural diamond segments as consumers normalise synthetic alternatives across a broader price spectrum.
Geopolitical and Macroeconomic Headwinds
Diamond jewellery purchases are among the most discretionary of all consumer expenditures, making the sector acutely sensitive to consumer confidence indices. The onset of conflict in the Middle East during this period added measurable uncertainty to global economic sentiment, compounding existing pressures from interest rate environments, currency volatility, and constrained discretionary spending across major consumer markets including the United States, China, and India.
China's recovery trajectory from its post-COVID consumption contraction remains a particularly critical variable. Chinese consumers have historically represented a significant driver of diamond jewellery demand growth, and any sustained underperformance in this market exerts disproportionate downward pressure on rough diamond pricing globally. Consequently, this dynamic mirrors broader commodity market turmoil seen across multiple resource sectors in recent years.
Cyclical Depression or Structural Disruption? Framing the Downturn
| Cycle Period | Primary Cause | Recovery Mechanism | Duration |
|---|---|---|---|
| 2008-2009 | Global financial crisis | Emerging market demand recovery | ~18 months |
| 2015-2016 | Oversupply and Indian polishing sector stress | Supply discipline and demand recovery | ~24 months |
| 2022-2024 | Post-COVID demand correction and LGD acceleration | Ongoing, structural LGD pressure persists | 3+ years |
| 2025-2026 | Geopolitical uncertainty, LGD penetration, price index weakness | To be determined | Ongoing |
Previous diamond market downturns were predominantly cyclical in character, driven by demand shocks or temporary oversupply that resolved as conditions normalised. The current cycle is more complex because it contains both cyclical components (macroeconomic and geopolitical headwinds that may ease over time) and structural components (LGD penetration that is unlikely to reverse).
The Sightholder System and the Inventory Accumulation Risk
A less commonly understood dynamic in rough diamond market analysis involves the mechanics of De Beers' Sightholder distribution system. Approved Sightholders, the major rough diamond buyers who commit to purchasing allocations at set prices across multiple sales cycles, can adjust their purchasing behaviour when market conditions weaken. When Sightholder demand softens, the gap between production volumes and sales volumes widens, and the difference accumulates as inventory on the producer's balance sheet.
In Q2 2026, this dynamic was visible: despite 88% higher production, rough diamond sales volumes actually declined by 7% year-on-year to 7.1 million carats. This divergence reflects Sightholders' reluctance to accumulate rough inventory in a low-price, uncertain environment, and it carries balance sheet implications for De Beers that extend beyond the income statement.
Full-Year 2026 Guidance and What It Signals
De Beers has maintained its full-year 2026 production guidance at 21-26 million carats. The width of the guidance range is itself informative, reflecting genuine operational uncertainty across several variables. In addition, broader mining industry consolidation trends are creating further strategic complexity across the sector.
Key factors that will shape H2 2026 output and revenue outcomes include:
- Planned plant maintenance at both Orapa and Jwaneng in Botswana, which will reduce the country's contribution in the second half
- The commencement of the two-year Venetia production pause in H2 2026, removing South Africa's output contribution for the remainder of the year
- Proportionally greater reliance on Gahcho Kué in Canada and Debmarine Namibia to carry the H2 production weight
- Revenue outcomes that remain heavily contingent on whether the rough price index stabilises or continues to deteriorate
De Beers has explicitly stated its intention to align output with actual trading conditions rather than pursue volume maximisation. This represents a meaningful philosophical shift from the company's historical model, which relied on supply control mechanisms including stockpiling and managed pricing to sustain rough diamond values. The current approach accepts market pricing as a given and adjusts supply accordingly, a posture more consistent with conventional commodity producers than with the monopolistic supply management De Beers practised for much of the twentieth century.
The next major ASX story will hit our subscribers first
The Anglo American Divestiture Dimension
Any analysis of De Beers' operational decisions in 2026 is incomplete without acknowledging the corporate context within which they are being made. Anglo American is in the process of divesting its stake in De Beers, a transaction process that introduces a layer of strategic complexity to operational decision-making. Revenue compression complicates asset valuation and may influence the timing and structure of any transaction.
The Venetia pause, the supply alignment strategy, and the careful management of full-year guidance all take on additional significance when viewed through the lens of an organisation preparing itself for a change in ownership and corporate governance structure.
The Long-Term Outlook: Can Natural Diamonds Recover?
The Supply Contraction Thesis
A genuine long-term bull case for natural diamonds exists, though it operates on a different timescale from current market dynamics. As existing diamond mines mature through their reserve depletion curves and new large-scale economic discoveries become increasingly rare, the total natural supply of mined diamonds is expected to decline structurally over the medium-to-long term. Several major mines globally are approaching the end of their productive lives, and the pipeline of replacement deposits capable of sustaining current production levels is thin.
Proponents of this thesis argue that supply contraction will eventually reassert pricing power for natural diamonds, particularly for higher-quality, larger stones where LGD substitution is least advanced. The rarity and provenance narrative carries the most weight in the premium segment, where consumers are making emotionally and symbolically significant purchases rather than purely price-driven decisions. For context, understanding which countries rank among the leading global diamond producers helps illustrate the scale of the supply-side challenge ahead.
What a Demand Recovery Would Require
For the natural diamond market to rebalance in a meaningful way, several conditions would need to align:
- A stabilisation or recovery in global consumer confidence, particularly across the United States, China, and India
- A moderation in LGD price declines that slows substitution momentum in mid-tier categories
- Geopolitical de-escalation in regions currently suppressing discretionary spending sentiment
- Sustained marketing investment by natural diamond producers to reinforce the emotional and provenance differentiation of mined stones from synthetic alternatives
Key Risks to Monitor
- Escalating geopolitical disruption deepening consumer confidence erosion across major markets
- Continued LGD price compression accelerating substitution into mid-tier natural diamond categories
- China demand trajectory remaining below historical trend, given the country's importance to global luxury goods markets
- Anglo American divestiture uncertainty creating governance ambiguity that affects long-term operational planning at De Beers
Key Takeaways
| Theme | Insight |
|---|---|
| Production recovery | Output growth is substantially base-effect driven, not a signal of genuine demand recovery |
| Pricing pressure | A 32% decline in average realised price reflects both structural (LGD competition) and cyclical (macroeconomic) forces |
| Revenue compression | Higher volume and lower revenue simultaneously create cash flow challenges despite operational improvements |
| Capital discipline | The Venetia pause signals deliberate cost and capex management, not operational distress |
| Market bifurcation | Higher-value natural diamonds are outperforming lower-value categories, a trend likely to persist |
| Supply alignment | De Beers is explicitly managing output to match demand rather than maximising production volumes |
| Long-term outlook | Recovery depends on the resolution of macroeconomic, geopolitical, and LGD penetration dynamics |
Disclaimer: This article is intended for informational purposes only and does not constitute financial advice. Forecasts, projections, and market outlook assessments involve inherent uncertainty and should not be relied upon as the basis for investment decisions. Past production performance and pricing trends are not necessarily indicative of future outcomes. Readers should conduct their own independent research and consult a qualified financial adviser before making any investment decisions.
Want to Stay Ahead of Significant Mineral Discoveries on the ASX?
While the diamond market grapples with structural pricing pressures and shifting demand dynamics, Discovery Alert's proprietary Discovery IQ model delivers real-time alerts on significant ASX mineral discoveries across more than 30 commodities, instantly turning complex data into actionable investment insights — explore historic discovery returns to understand the potential scale of major finds, and begin your 14-day free trial today to position yourself ahead of the broader market.