
June 10, 2026
The Behavioural Gap That Costs Precious Metals Investors the Most
Every major asset cycle produces the same pattern. Investors watch prices rise, convince themselves a correction is imminent, and wait. The correction arrives, and instead of buying, they freeze, unsure whether the bottom has been reached. Prices recover. The cycle repeats. By the time most investors act, they have either missed a substantial portion of the move or entered near a local peak, reinforcing the belief that precious metals are difficult to time.
This is not a knowledge problem. Most investors who delay buying gold and silver understand the macroeconomic case. They are aware of sovereign debt expansion, currency debasement, and the long-run erosion of fiat purchasing power. What defeats them is something more fundamental: the absence of a valuation anchor that makes timing decisions tractable.
Unlike equities, gold and silver generate no earnings, pay no dividends, and produce no analyst-modellable cash flows. There is no discounted cash flow model to run, no price-to-earnings multiple to compare against historical averages, no quarterly guidance to revise against. Without a fundamental floor, the search for the right entry price becomes an open-ended exercise that most investors never complete. The psychological result is paralysis, and the practical result is a position that never gets built.
Dollar-cost averaging into gold and silver resolves this problem not by improving timing, but by eliminating the timing decision entirely.
When big ASX news breaks, our subscribers know first
How Dollar-Cost Averaging Into Gold and Silver Actually Works
The Mechanism in Plain Terms
Dollar-cost averaging, commonly referred to as DCA, is the practice of deploying a fixed monetary amount into an asset at consistent, pre-scheduled intervals, irrespective of the prevailing price. The amount is fixed. The date is fixed. The purchase happens regardless of whether prices are rising, falling, or moving sideways.
The mathematical consequence of this approach is straightforward and often underappreciated. When prices decline, a fixed dollar amount acquires more physical metal. When prices rise, the same dollar amount acquires less. Over a sufficiently long accumulation window, this produces a blended average cost per ounce that tends to fall below the simple arithmetic average of the prices paid over the same period.
This is not a new concept invented for precious metals. It is the same principle that has governed 401(k) retirement contributions for decades, where fixed payroll deductions flow into investment accounts each month regardless of whether equity markets are at highs or lows. The logic transfers directly to bullion accumulation, and, as outlined in this straightforward guide to DCA in gold, arguably fits the metals particularly well, given that gold and silver carry no valuation ceiling and no income stream to distort the return calculation.
How the Numbers Play Out: A Three-Month Illustration
| Month | Gold Spot Price | Fixed Investment | Ounces Acquired |
|---|---|---|---|
| Month 1 | $4,200 | $300 | 0.071 oz |
| Month 2 | $3,900 | $300 | 0.077 oz |
| Month 3 | $4,500 | $300 | 0.067 oz |
| Total | Avg: $4,200 | $900 | 0.215 oz |
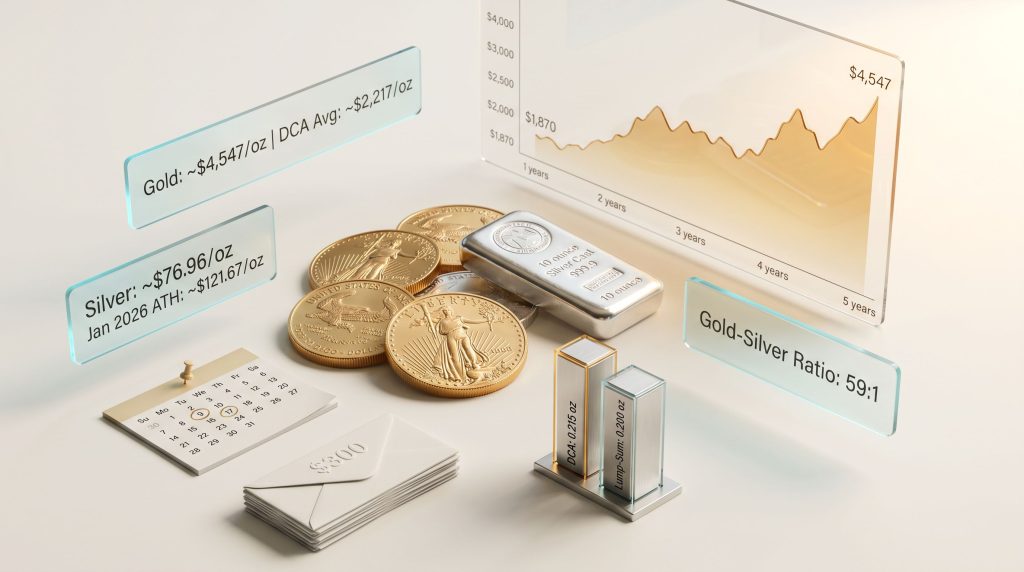
The DCA average cost across these three months works out to approximately $4,186 per ounce. An investor who deployed the same $900 as a lump sum at Month 3's price of $4,500 would have acquired only 0.200 ounces. The systematic buyer acquired 7.5% more metal for identical capital outlay, not through any forecasting skill, but because the Month 2 price weakness was captured automatically.
The Five-Year Performance Record
The three-month illustration becomes considerably more compelling when extended across a real market cycle. A simulated $200 per month DCA buyer who began purchasing in January 2021 holds a blended average cost of approximately $2,217 per ounce as of May 2026, against a spot price of approximately $4,547 per ounce [GoldSilver, 2026]. That gap of roughly $2,330 per ounce was not produced by correctly predicting gold's trajectory. It was the product of uninterrupted, mechanical execution across 65 months of volatile, news-driven price action.
Critically, every month within that five-year window contained some macroeconomic reason to delay. Inflationary surges, Federal Reserve tightening cycles, geopolitical shocks, and periodic gold price pullbacks all provided plausible grounds for inaction. Investors who proceeded anyway are now holding that $2,330 gap as real, unrealised wealth in physical metal.
Why Precious Metals Are Structurally Suited to This Approach
The Monetary Case for Gold and Silver
Gold and silver are not income-generating instruments, and understanding this distinction is fundamental to understanding why DCA is particularly well-matched to them. Their value is rooted in physical scarcity and their historical role as monetary reserves, not in any cash-flow generation. Consequently, every major fiat currency system in recorded history has experienced sustained, compounding purchasing power erosion. Gold and silver have preserved real value across millennia of currency cycles, empire collapses, and monetary regime changes.
The structural forces currently supporting precious metals are not single-event catalysts. Furthermore, gold as a safe haven has become increasingly relevant as the US national debt crossed $36 trillion by late 2024 [Committee for a Responsible Federal Budget]. In May 2025, Moody's removed the United States' last remaining AAA sovereign credit rating, a development reflecting the accumulated weight of fiscal expansion rather than any discrete policy failure. The Federal Reserve's balance sheet expansion since 2008 exceeded in absolute terms everything printed in all prior decades of that institution's history combined.
These are slow-moving structural forces. They do not resolve on short timescales. They accumulate, and they systematically reward investors who match their accumulation strategy to the pace at which these forces operate.
Gold's Five-Year Price Context
Gold moved from approximately $1,870 per ounce in early 2021 to approximately $4,547 per ounce as of May 2026, a gain of roughly 143% over five years [World Gold Council]. The metal reached an all-time peak of approximately $5,599 per ounce in January 2026, before pulling back roughly 19% to current levels. Each segment of that move generated its own set of reasons to wait: overextension concerns, rate hike fears, dollar strength, geopolitical de-escalation episodes.
Investors who applied DCA through all of it, treating rising months and falling months identically, built the position that now reflects that 143% gain at a cost basis significantly below the current spot price.
What Makes Silver a Distinct Accumulation Opportunity
Silver's Dual Identity and Why It Matters
Silver's dual role as both a monetary store of value and a high-demand industrial commodity gives it a unique structural position among monetary metals. Approximately 59% of total global silver demand originates from industrial end-uses, including solar photovoltaic manufacturing, consumer electronics, electric vehicle components, and medical-grade applications [Silver Institute, World Silver Survey 2026].
This industrial demand base is not cyclically optional. Solar panel manufacturers require silver regardless of macroeconomic sentiment. EV battery and electrical contact applications impose a structural floor on demand that is largely insensitive to investment flows. This is a meaningfully different demand profile from gold, which is driven primarily by investment and central bank accumulation.
The supply side of silver's equation compounds this structural tension. In addition, silver supply deficits have been recorded for five consecutive years, with global mine output failing to keep pace with accelerating industrial and investment demand [Silver Institute, World Silver Survey 2026]. Mine supply cannot be rapidly scaled in response to demand. Silver is predominantly produced as a byproduct of base metal mining, particularly copper, lead, and zinc operations. This means primary silver mine supply responds to those metals' economics, not to silver's own price signals, creating a structural rigidity that most commodity markets do not share.
Silver's Volatility as a DCA Amplifier
Silver's historical price volatility runs approximately two to three times that of gold. This characteristic, which deters many timing-oriented investors, is precisely what amplifies the effectiveness of dollar-cost averaging into silver. Wider price swings within any given accumulation period create more frequent and more pronounced dip-capture opportunities for the systematic buyer.
In May 2026, silver moved from approximately $72 per ounce to above $89 per ounce within a two-week window, a swing exceeding 23%. Silver's current price of approximately $76.96 per ounce represents a pullback of roughly 37% from its January 2026 all-time high of approximately $121.67 per ounce [GoldSilver, 2026]. For a discretionary buyer, that drawdown creates genuine uncertainty about whether further declines lie ahead. For a systematic DCA buyer, it is simply the mechanism doing its job: capturing cheaper ounces and pulling the blended average cost lower.
Silver's short-term price frequently responds to industrial sentiment, trade policy signals, and macroeconomic data releases that carry no bearing on its long-term monetary thesis or structural supply deficit. When silver drops on unrelated macro noise, the DCA mechanism captures those lower prices automatically, without requiring the investor to make a judgment call about whether the drop is warranted.
Using the Gold-Silver Ratio as an Allocation Signal
How the Ratio Works as a Dynamic Tilting Tool
The gold-silver ratio measures how many ounces of silver are required to purchase a single ounce of gold. It is one of the oldest valuation relationships in commodity markets, with a long-run historical average range of approximately 50 to 65:1 [World Gold Council]. As of May 2026, the ratio sits at approximately 59:1, and further gold-silver ratio insights place silver near its historical midpoint relative to gold.
The ratio's value for DCA practitioners lies not in forecasting direction, but in providing a historically grounded basis for tilting monthly allocation between the two metals. No price forecast is required. The framework simply compares the current ratio against its historical distribution.
| Ratio Level | Historical Signal | Suggested DCA Allocation Tilt |
|---|---|---|
| Below 50:1 | Silver relatively expensive | Weight monthly budget toward gold |
| 50 to 65:1 | Near historical midpoint | Balanced split between metals |
| 65 to 80:1 | Silver becoming undervalued | Begin tilting toward silver |
| Above 80:1 | Silver historically cheap vs gold | Significant weight toward silver |
When the ratio climbed above 70:1 in late 2025, silver was historically cheap relative to gold, providing a data-driven basis to weight monthly DCA purchases toward silver. At today's 59:1, a balanced approach is the appropriate baseline. The ratio serves as a dynamic allocation signal embedded within a fundamentally passive accumulation strategy.
Research from CPM Group suggests that an optimal precious metals allocation represents approximately 20% of a well-diversified portfolio, while mainstream financial guidance typically recommends a range of 10 to 15% [CPM Group; World Gold Council]. The monthly DCA commitment should be calibrated to work toward whichever allocation target fits the investor's overall plan.
Building a Dollar-Cost Averaging Plan: Five Practical Steps
Step 1: Fix the Monthly Commitment
Consistency of execution matters more than the magnitude of each individual purchase. A $100 per month program sustained over ten years builds a more meaningful physical position than a single $1,000 purchase made once and never followed through. The critical requirement is that the amount can be sustained automatically, without requiring a strong financial month to execute or active monthly decision-making to confirm.
- Suggested starting range for new accumulators: $100 to $500 per month
- The amount should be treated as a fixed monthly obligation, equivalent to a utility bill
- Smaller budgets are better directed toward silver first, given gold's higher per-ounce price at current levels
- The commitment can be increased over time; consistency of the habit matters more than starting large
Step 2: Select the Right Physical Products
Product selection has a direct impact on the effective cost of accumulation through premium differentials. The wrong product choices add unnecessary friction to the cost basis over time.
- Gold: Government-minted bullion coins (American Eagles, Canadian Maple Leafs) or cast bars from recognised international refiners
- Silver: One-ounce bullion coins or ten-ounce cast bars from established mints offer the best liquidity-to-premium ratio for regular buyers
- Government-issued coins carry slightly higher premiums but provide universal market recognition and resale liquidity
- Cast bars from accredited refiners offer lower per-ounce premiums, delivering better value for larger monthly budgets
- Avoid: Numismatic, proof, or collectible coins, whose pricing incorporates collector demand entirely unrelated to spot price movements
However, investors who prefer exchange-traded exposure rather than physical custody should consult a precious metals ETC guide to understand the trade-offs involved before committing.
Step 3: Lock In a Fixed Purchase Date
The purchase date should be fixed and non-negotiable: the 1st, the 15th, or a paycheck deposit date. The specific date is irrelevant. What matters is that it does not change based on how prices look that week.
Automating the purchase removes the single greatest risk embedded in any DCA plan: the investor's own judgment about whether conditions feel right in any given month. The moment individual monthly decisions re-enter the process, the strategy functionally reverts to informal market timing, which is precisely what the approach is designed to eliminate.
Step 4: Choose a Storage and Custody Structure
| Storage Option | Key Features | Best Suited For |
|---|---|---|
| Home safe | Direct possession, zero counterparty risk, immediate accessibility | Smaller positions, privacy-focused investors |
| Professional vault storage | Off-site security, fully insured, independently audited | Larger accumulations, long-term holders |
| Precious metals IRA | Pre-tax accumulation, retirement account wrapper | Investors with long time horizons and tax planning objectives |
Step 5: Measure Progress in Ounces, Not Dollar Values
The fiat-denominated value of a metals holding fluctuates with spot prices and creates psychological noise that is counterproductive to a long-term accumulation mindset. Ounces are the correct unit of measurement. They represent finite, physical metal that cannot be diluted or digitally replicated.
A monthly review should answer a single question: how many ounces do I hold today compared to last month? Every month that answer increases, the strategy is working exactly as intended.
The next major ASX story will hit our subscribers first
The Real Limitations of Dollar-Cost Averaging in Precious Metals
Where DCA Mathematically Underperforms
Dollar-cost averaging does not produce the maximum theoretically achievable return in a sustained, uninterrupted bull market. An investor who correctly identifies the entry point at the beginning of a strong bull move and deploys all available capital at that moment will mathematically outperform a systematic buyer. This is a genuine limitation of the strategy, not a marketing caveat to be dismissed.
The critical assumption embedded in that superior outcome, however, is that the investor correctly identifies the entry point before the sustained rise begins. Gold's extended consolidation between 2013 and 2018, during which prices moved essentially sideways for five years, demonstrates how frequently that assumption proves wrong in practice. Lump-sum buyers at 2013 prices saw no meaningful appreciation until the subsequent bull cycle began years later. DCA buyers, furthermore, accumulated ounces throughout that period at what subsequently proved to be excellent long-term entry prices.
What DCA Cannot Do
- It does not prevent unrealised losses during multi-year bear markets or extended price consolidation phases
- It does not guarantee any specific return over any finite time horizon
- It does not eliminate the need for a long-term holding mindset; investors who exit during drawdowns forfeit the cost-basis advantage the strategy was designed to build
- It is a position-building discipline, not a return-maximisation engine
Dollar-cost averaging's primary function is to ensure that investors accumulate the position they intend to accumulate, at a blended cost that tends to outperform emotionally-driven, timing-dependent approaches. It should be evaluated against the realistic alternative available to most investors, which is not lump-sum entry at the bottom, but rather indefinite waiting punctuated by frustration-driven purchases near local highs.
DCA vs. Lump-Sum vs. Waiting: A Comparative Framework
| Approach | Key Advantage | Key Risk | Best Suited For |
|---|---|---|---|
| Dollar-cost averaging | Removes timing risk; builds position automatically and systematically | Underperforms in strong, uninterrupted bull markets | Long-term accumulators; investors new to precious metals |
| Lump-sum entry | Maximum upside if entry timing proves correct | Full capital exposed if prices decline post-entry | Investors with high conviction on near-term price direction |
| Waiting for a dip | Theoretically lower entry cost | Dip may not arrive at a level that triggers action; significant opportunity cost of non-participation | Rarely advantageous in practice; most investors buy near peaks or never buy |
The Macro Environment Reinforcing Long-Term Accumulation
Structural Forces That Reward Patience Over Timing
The macroeconomic backdrop underpinning gold and silver's long-term investment case is not constructed from discrete events but from slow-moving, compounding structural forces. US national debt exceeding $36 trillion [Committee for a Responsible Federal Budget], Moody's sovereign credit downgrade in May 2025, and the Federal Reserve's historically unprecedented balance sheet expansion since 2008 are not conditions that resolve in response to any single policy decision or geopolitical development.
These forces operate on timescales of years and decades. An investor who waits for a definitive macroeconomic crisis signal before beginning to accumulate is, by definition, waiting for a moment that tends to arrive after the most protective window has already closed. The structure of monetary debasement mirrors the structure of systematic accumulation: both unfold gradually, compounding over time.
Frequently Asked Questions About Dollar-Cost Averaging Into Gold and Silver
Is dollar-cost averaging a sound strategy for precious metals specifically?
Dollar-cost averaging is particularly well-matched to gold and silver because neither metal produces dividends, earnings, or analyst-modellable cash flows. Without a fundamental valuation framework, even professional investors cannot reliably identify optimal entry points. DCA removes that requirement entirely, replacing timing judgment with mechanical consistency. It will not produce the maximum theoretically achievable return, but it reliably builds a meaningful position at an average cost that tends to outperform what discretionary timing achieves in practice.
How much should I invest in gold and silver each month?
The specific amount matters less than the commitment to consistency. Research from CPM Group suggests precious metals should represent approximately 20% of a well-diversified portfolio, while mainstream financial guidance typically recommends 10 to 15% [CPM Group; World Gold Council]. A practical starting point is identifying the fixed monthly amount that can be sustained without active monthly deliberation. Even $100 per month, maintained over a decade, builds a materially significant position in physical metal.
Is it better to buy gold and silver all at once or gradually over time?
Lump-sum investing produces superior results in a steadily rising market, but only when the investor correctly identifies the entry point before that rise begins. Gold's 2013 to 2018 consolidation period demonstrates how frequently that assumption fails. In practice, the realistic choice is not lump-sum at the bottom versus DCA; it is DCA versus indefinite waiting. Most investors who delay a lump-sum purchase either re-enter near a peak in frustration or never enter at all. As explored in this analysis of DCA for silver, DCA's primary advantage is behavioural: it eliminates the monthly decision, which eliminates the most common source of investor underperformance.
What is the minimum amount needed to start?
There is no minimum threshold. Physical silver rounds and small-format bars are available at well under $100 per ounce at current prices, making a $50 to $100 monthly budget a viable starting point. Gold's higher per-ounce price makes silver the more practical entry vehicle for smaller monthly budgets. The more important distinction is between physical metal held directly or stored in a professional vault versus paper proxies such as ETFs. For long-term monetary protection, physical ownership is the foundational principle.
Does dollar-cost averaging still work during a bear market?
DCA functions differently during bear markets but does not stop functioning. During gold's extended flat period from 2013 to 2018, systematic buyers accumulated ounces at what subsequently proved to be excellent long-term entry prices for the bull cycle that followed. The strategy will not prevent unrealised portfolio losses when prices fall below the accumulated average cost. What it ensures is that when prices recover, the investor holds a larger position at lower average prices than would have been achievable by waiting on the sidelines.
Should I buy physical metal or use ETFs for a DCA strategy?
ETFs provide price exposure with high liquidity and low transaction friction, which can be useful for short-to-medium-term positioning. Physical gold and silver provide direct ownership of a tangible, finite asset with no counterparty risk, no management fees, and no dependency on the operational integrity of a financial institution. For a long-term DCA strategy oriented around monetary protection and purchasing power preservation, physical ownership is the structurally appropriate vehicle.
All price data referenced reflects conditions as of May 2026. The DCA simulation figures cited are based on $200 per month purchases at month-end close prices from January 2021 to May 2026, sourced from GoldSilver (2026). Statistical simulations are illustrative and based on historical spot price data. This article is intended for educational and informational purposes only and does not constitute financial or investment advice. All investments, including precious metals, involve risk and may result in partial or total loss. Readers should consult a qualified financial adviser before making any investment decisions.
Want to Go Beyond Precious Metals and Catch the Next Major Mineral Discovery in Real Time?
While systematic accumulation of gold and silver builds long-term wealth, Discovery Alert's proprietary Discovery IQ model delivers instant ASX mineral discovery alerts — turning complex exploration data across 30-plus commodities into clear, actionable opportunities the moment they hit the market. Explore historic discoveries and their returns to see what's possible, then begin your 14-day free trial to position yourself ahead of the broader market.