June 11, 2026
The Architecture of Reserve Currency Erosion and What It Means for Precious Metals
Monetary systems do not collapse overnight. They erode at the edges, gradually and almost invisibly, until one day the cumulative weight of structural change becomes impossible to ignore. The transition from British sterling dominance to U.S. dollar supremacy took roughly four decades. The pound did not disappear in a single crisis; it lost relevance slowly, trade agreement by trade agreement, reserve reallocation by reserve reallocation. For investors paying attention to the dollar's current trajectory, the historical parallel is not reassuring.
Understanding how dollar dominance and gold and silver prices interact requires more than tracking the U.S. Dollar Index on a daily chart. It requires understanding why the dollar occupies the position it does in the global monetary architecture, how that position is measurably changing, and what that change means for assets priced in a currency that is slowly being trusted less.
When big ASX news breaks, our subscribers know first
Why the Dollar Sits at the Top of the Macro Hierarchy
Since the Bretton Woods Conference of 1944, the U.S. dollar has served as the world's primary reserve currency. What that means in practical terms is that the vast majority of international trade, sovereign debt issuance, and commodity pricing, including gold and silver, is denominated in USD. This creates an embedded currency exposure that most investors underestimate.
When the dollar gains purchasing power, gold and silver become more expensive for foreign buyers in their own currencies. Demand slows. Prices face headwinds. The reverse is equally mechanical: a weakening dollar makes gold and silver cheaper for international buyers, stimulates demand, and supports higher nominal prices. This is not a theory. It is the arithmetic of how dollar-denominated commodity markets function.
What elevates the dollar above other macroeconomic variables is not just this direct pricing relationship. It is that nearly every other variable investors monitor — inflation, real interest rates, geopolitical risk premiums, central bank policy — transmits through the dollar first. Inflation erodes dollar purchasing power. Rising inflation expectations compress real yields. Negative real yields eliminate the opportunity cost of holding non-yielding assets like gold. The dollar is not one signal among many. It is the upstream variable through which all other signals flow.
The gold price in any given currency is, at its core, a referendum on that currency's purchasing power stability. When the currency is structurally losing that stability, the nominal price of gold rises not because the metal has become more valuable, but because the measuring stick has become shorter.
The Measurable Decline: What the Data Actually Shows
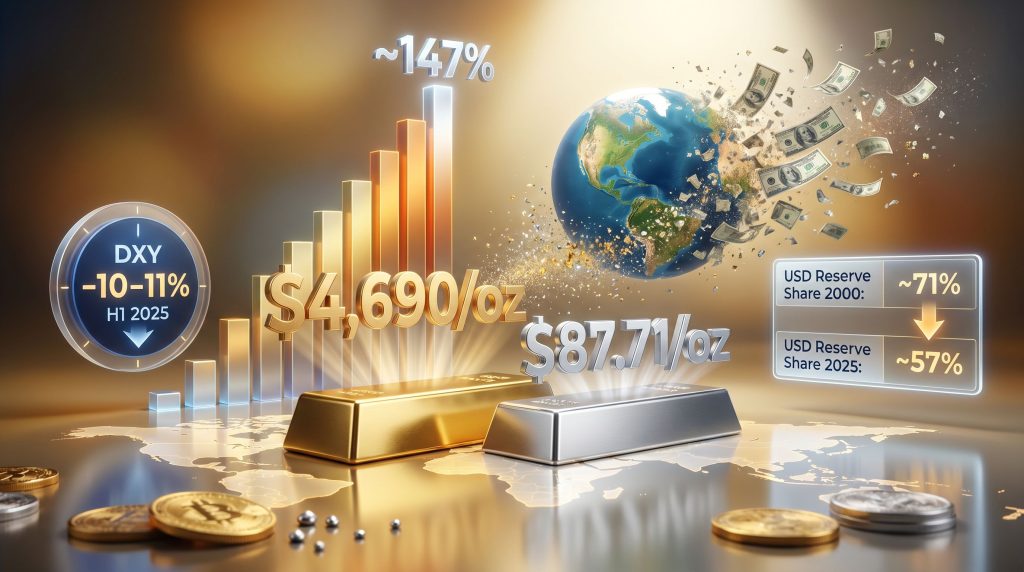
The erosion of dollar dominance is not speculative. It is documented in the IMF's Currency Composition of Official Foreign Exchange Reserves (COFER) database, which tracks how the world's central banks allocate their reserve holdings. Furthermore, the dollar's share of global foreign exchange reserves has declined from approximately 71% in 2000 to roughly 57% in 2025 — a 14-percentage-point structural contraction over 25 years (IMF COFER, Q4 2025).
That single data series tells investors more about the long-term trajectory of precious metals than any quarterly earnings report or central bank press conference. The direction and pace of reserve share change carry more investment signal than the absolute level. As a result, the world losing trust in the dollar is no longer a fringe theory — it is measurable in sovereign allocation data.
How the Dollar's Decline Compares to Historical Reserve Currency Transitions
| Reserve Currency | Approximate Peak Share | Current or Trough Share | Transition Duration |
|---|---|---|---|
| British Pound Sterling | ~60% (early 20th century) | Below 5% (post-WWII) | Approximately 40 years |
| U.S. Dollar | ~71% (2000) | ~57% (2025) | 25+ years, ongoing |
| Euro (challenger currency) | ~28% (2009) | ~20% (2025) | Declining from peak |
One critical insight that separates experienced macro investors from reactive ones is this: reserve currency transitions are generational events, not cyclical ones. By the time the shift becomes obvious to the mainstream, the repricing of beneficiary assets is already substantially complete. Investors who waited for confirmation before allocating to gold during the pound's decline missed the majority of the structural repricing.
The DXY's performance during the first half of 2025 was a sharp expression of this chronic structural trend in acute form. The index fell approximately 10 to 11% during that period — its steepest first-half decline in more than five decades (RBC Wealth Management, U.S. Dollar in Transition, 2025). That kind of move does not emerge from a vacuum. It reflects years of accumulated reserve diversification, fiscal expansion, and declining foreign appetite for dollar-denominated assets.
The Three-Stage Transmission from Dollar Weakness to Metal Prices
Understanding the causal chain that connects dollar dynamics to gold and silver pricing requires breaking the transmission mechanism into its component stages.
Stage 1: Dollar Purchasing Power Erosion
Persistent U.S. fiscal deficits increase Treasury issuance. As the supply of dollar-denominated debt expands, foreign reserve managers face a straightforward choice: absorb more dollar exposure or diversify. When inflation simultaneously exceeds Treasury yields, real interest rates turn negative. At that point, holding dollar-denominated cash becomes a quantifiably losing proposition.
The real interest rate formula — nominal Treasury yield minus the prevailing inflation rate — is the key intermediary variable. Historical analysis of gold price performance shows the metal's strongest and most sustained appreciation has consistently coincided with negative or deeply suppressed real rate environments. When cash actively destroys purchasing power, non-yielding assets with intrinsic store-of-value characteristics become comparatively attractive.
Stage 2: Institutional and Sovereign Reallocation
At the institutional level, central banks and sovereign wealth funds respond to dollar weakness by reducing their proportional exposure to dollar-denominated reserves. This is not theoretical. Between 2022 and 2024, central banks globally purchased more than 1,000 tonnes of gold annually. The 2022 figure of 1,082 tonnes represented the highest level of net sovereign gold purchases since at least 1950 (World Gold Council, Gold Demand Trends, Full Year 2024).
This is dedollarisation in measurable form. In addition, gold reserves held by central banks have risen sharply as reserve managers reposition capital away from dollars — one tonne at a time.
Stage 3: Retail and Speculative Demand Amplification
As structural dollar weakness becomes visible in price data and media coverage, retail and speculative investors enter the precious metals market. This amplification effect is particularly pronounced in silver, where the smaller market capitalisation means that equivalent capital inflows produce proportionally larger price dislocations.
Why the Safe-Haven Dollar Reflex Is Breaking Down
For most of the post-Bretton Woods era, global instability reliably triggered capital flows into U.S. Treasuries and the dollar. This safe-haven reflex was a function of trust in U.S. fiscal credibility and the perceived absence of alternatives. However, that reflex has materially weakened.
According to the Federal Reserve's own research on the international role of the dollar (2025 Edition), confidence in dollar-denominated assets has been eroding as U.S. fiscal deficits have expanded and geopolitical relationships between major reserve holders and Washington have become more complex. Increasingly, capital that historically sought safety in dollars is flowing directly into gold, bypassing the dollar entirely.
This is a structural behavioural shift with profound implications. Gold's monetary premium is no longer just an inflation hedge. It is absorbing what was previously the dollar's geopolitical safe-haven premium as well — a dynamic explored in detail when examining gold as a safe haven during periods of global trade disruption.
Gold's Repricing in Context: Nominal Highs vs. Real Valuation
Gold trading at approximately $4,690 per ounce in mid-2026 looks extraordinary against a five-year historical chart. Against the backdrop of the dollar's 25-year reserve share decline, it looks considerably more rational.
Gold Price Benchmarks Across Reserve Currency Transition Phases
| Year | Approximate Gold Price (USD/oz) | Macro Context |
|---|---|---|
| 2000 | ~$270 | Dollar at peak reserve share (~71%); negative real rates absent |
| 2011 | ~$1,900 | Post-GFC monetary expansion; negative real rates emerging |
| 2020 | ~$2,070 | COVID fiscal stimulus; dollar debasement concerns rising |
| 2025-2026 | $4,690+ | Reserve share at ~57%; central bank accumulation at 70-year highs |
A less commonly understood analytical point here is the distinction between nominal price highs and real price highs. When the currency used to price an asset is itself losing purchasing power, nominal all-time highs do not necessarily indicate overvaluation. Inflation-adjusted gold price analysis — using CPI-deflated historical prices — frequently shows that gold's real price in 2026 remains well below its 1980 inflation-adjusted peak. Investors who treat nominal records as valuation signals without accounting for the dollar's own deterioration are making a fundamental analytical error.
When central banks, the very institutions responsible for managing reserve currencies, reduce their exposure to those currencies and replace them with gold, the signal quality is categorically different from retail investor sentiment or analyst price targets. It is the ultimate institutional validation of the structural thesis.
The next major ASX story will hit our subscribers first
Silver's Structural Amplification: Understanding the Dual-Demand Architecture
Silver occupies a unique position in the precious metals complex that gold does not. It functions simultaneously as a monetary metal — responding to the same dollar weakness, real rate compression, and reserve currency erosion dynamics that drive dollar dominance and gold and silver prices — and as a critical industrial commodity with no equivalent substitutes in many high-growth applications.
Industrial demand for silver spans solar photovoltaic manufacturing, electric vehicle components, consumer electronics, medical instruments, and a growing range of advanced technologies. According to the Silver Institute, industrial applications account for approximately 50% or more of total annual silver demand (World Silver Survey 2026). This industrial consumption base creates a structural price floor that gold, as a predominantly monetary metal, simply does not possess.
When monetary tailwinds from dollar weakness arrive, they impact a metal that is already under supply pressure from industrial consumption. The compounding of two independent demand drivers simultaneously is what produces silver's characteristic price amplification relative to gold during dollar stress cycles. Consequently, silver's outperformance during periods of dollar stress is one of the more reliable structural patterns in precious metals markets.
In 2025, silver recorded a gain of approximately 147% as dollar reserve confidence deteriorated, reaching approximately $87.71 per ounce by mid-2026 (Silver Institute, World Silver Survey 2026). These are price levels with no historical precedent outside the 2025 to 2026 rally period.
Gold vs. Silver: A Structural Comparison During Dollar Weakness Cycles
| Metric | Gold | Silver |
|---|---|---|
| Primary demand driver | Monetary and reserve asset | Monetary plus industrial hybrid |
| Relative market capitalisation | Substantially larger | Significantly smaller |
| Industrial demand share | Minimal (below 10%) | Approximately 50%+ of total demand |
| Price volatility during dollar stress | Moderate to high | High to very high |
| Structural price floor mechanism | Monetary demand alone | Industrial consumption plus monetary demand |
| 2025 approximate price gain | Record nominal highs | ~147% year-on-year |
The market capitalisation differential between gold and silver is not a weakness from an investment perspective. It is a leverage mechanism. The same volume of dollar-driven monetary capital that moves gold by a measured percentage can move silver by multiples of that figure. This structural asymmetry is why silver has historically outperformed gold on a percentage basis during sustained periods of dollar weakness, while also exhibiting greater downside volatility during dollar strength cycles. Furthermore, tracking the gold-silver ratio in 2025 provides additional insight into how these relative moves have played out.
What the Self-Reinforcing Cycle of Deficit Spending Means for Both Metals
One dimension of the dollar weakness thesis that receives insufficient analytical attention is the fiscal feedback loop. Expanding U.S. fiscal deficits require expanding Treasury issuance. Greater supply of U.S. government debt, without a corresponding increase in foreign reserve demand, exerts downward pressure on the dollar's reserve share.
The IMF COFER data indicates that even as Treasury supply has grown significantly, the dollar's share of global reserves has declined from 71% to 57% over 25 years. This divergence suggests that foreign reserve managers are not absorbing new dollar-denominated issuance at historical rates. The most direct measurable expression of where that capital is going is the central bank gold accumulation data from the World Gold Council.
This creates a self-reinforcing dynamic that is worth mapping explicitly:
- Larger fiscal deficits require greater Treasury issuance.
- Expanding supply of dollar-denominated debt encounters reduced foreign appetite.
- Dollar reserve share continues its structural decline.
- Reserve managers allocating away from dollars direct capital toward gold as the primary reserve-quality alternative.
- Gold price appreciation reflects this institutional reallocation.
- Silver, sharing gold's monetary characteristics while adding industrial demand, amplifies the move.
Four Analytical Errors That Cost Precious Metals Investors
Error 1: Treating Dollar Weakness as a Tactical Trade
The 25-year structural erosion in dollar reserve share is not a position to enter and exit around Federal Reserve meeting dates. Investors who approach it as a short-term trade consistently miss the durable, compounding nature of the underlying thesis.
Error 2: Interpreting Nominal Price Records as Overvaluation
Gold at $4,690 looks expensive against 2020's $2,070 price point. Adjusted for the dollar's own purchasing power loss over the same period, and relative to the pace of reserve share decline, the real price appreciation is considerably more modest. Nominal record prices in a debasing currency are not the same as genuine overvaluation.
Error 3: Analysing Inflation and Rates Without the Dollar Anchor
Real interest rates matter enormously. However, the analytical hierarchy runs in one direction: dollar reserve status shapes inflation expectations, which interact with nominal Treasury yields to produce real rates, which then drive precious metals pricing. Watching rates and inflation without anchoring to dollar dynamics means tracking outputs while ignoring the input.
Error 4: Assuming the Dollar's Safe-Haven Premium Is Intact
The historical correlation between geopolitical stress and dollar strength has weakened as U.S. fiscal credibility has come under pressure. Capital that once reflexively sought safety in Treasuries is increasingly bypassing the dollar and flowing directly into gold. Investors who model geopolitical risk using historical dollar relationships may be systematically underestimating gold's monetary premium under stress conditions. The gold market surge in 2025 is, in many respects, the most direct market expression of this broken safe-haven reflex.
The Three-Layer Framework for Monitoring Dollar-Driven Precious Metals Dynamics
For investors seeking a structured approach to monitoring this thesis over time, the following framework provides a hierarchy of signals organised by their timeframe and reliability:
-
The Structural Layer: Track IMF COFER reserve share data on a quarterly basis. This signal moves slowly, but it is the most durable and least subject to short-term noise. A continued decline in dollar reserve share below 57% would represent an acceleration of the existing trend.
-
The Institutional Layer: Monitor central bank gold purchasing volumes through World Gold Council quarterly demand reports. Sovereign reserve managers represent the most credible real-money expression of long-term reserve currency confidence. Three consecutive years above 1,000 tonnes is not coincidental.
-
The Market Layer: Track DXY movements, real rate trajectories through Treasury Inflation-Protected Securities (TIPS) yields, and inflation expectations data. These variables translate the slow-moving structural and institutional signals into near-term price catalysts.
The investors most consistently positioned ahead of dollar dominance and gold and silver prices moves are those who monitor all three layers simultaneously rather than reacting to any single indicator in isolation. In addition, understanding what happens to gold and silver when the dollar loses its reserve status provides essential context for long-term portfolio positioning.
This article is for informational and educational purposes only. It does not constitute financial or investment advice. Past performance of any asset class, including precious metals, is not indicative of future results. Investors should consult a qualified financial adviser before making any investment decisions. All price data and statistics referenced are sourced from publicly available reports including IMF COFER, World Gold Council Gold Demand Trends, Silver Institute World Silver Survey, and RBC Wealth Management research.
Want to Know Which ASX Mineral Discoveries Could Benefit From Shifting Macro Dynamics?
As dollar reserve confidence continues its structural erosion and institutional capital reallocates toward hard assets, the timing of entry into significant mineral discoveries becomes increasingly critical — Discovery Alert's proprietary Discovery IQ model delivers real-time alerts on major ASX mineral discoveries, translating complex data across 30+ commodities into clear, actionable insights for investors at every level. Explore how historic discoveries have generated extraordinary returns or begin your 14-day free trial today to ensure you are positioned ahead of the broader market.