
May 10, 2026
When Two Bulls Run Together: Understanding the 2026 Market Paradox
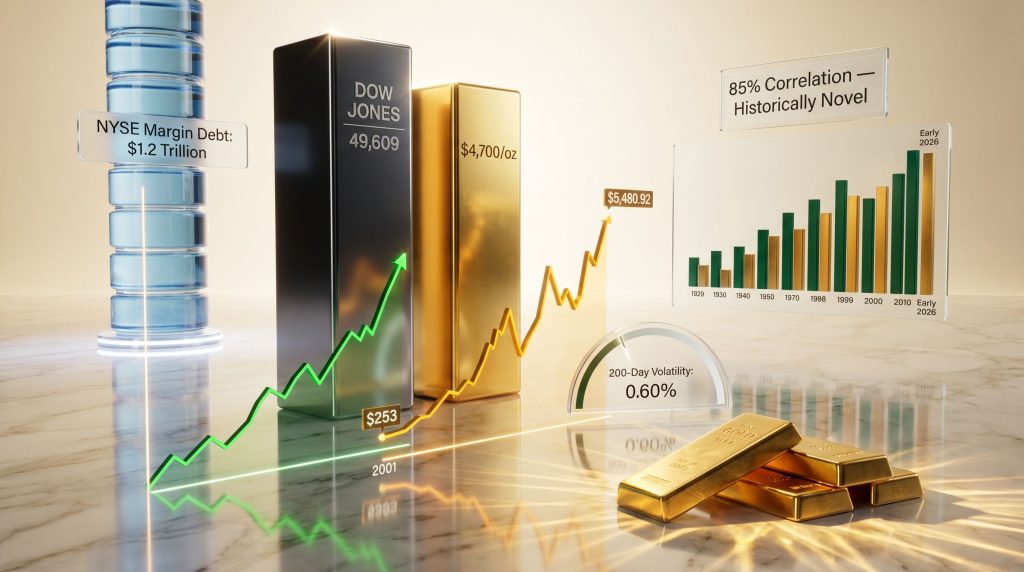
Few conditions in modern financial markets generate as much analytical tension as the simultaneous bull run in both equities and precious metals. Conventional wisdom, built on decades of portfolio theory, assumes these asset classes operate in opposition: when stocks soar, gold fades; when equities collapse, gold thrives. Yet the current market environment has challenged this assumption in ways that demand a closer examination, particularly as the gold-stock correlation between these two assets has reached historically unusual levels. Consequently, both the Dow Jones and gold remain bullish heading into the second half of 2026.
Understanding this dynamic is not simply an academic exercise. The conditions underpinning the current dual advance carry meaningful implications for portfolio construction, risk management, and the long-term allocation between financial assets and real assets.
When big ASX news breaks, our subscribers know first
The Dow Jones and Gold Remain Bullish: But for How Long?
Technical analysis of the Dow Jones as of May 10, 2026, presents a compelling short-term bullish case. The index closed the week at approximately 49,609, sitting just 579 points below its most recent all-time high of 50,188. That gap represents a distance of roughly 1.15% from a new record close, a threshold that has historically been bridged within days during sustained bull market advances.
The recovery trajectory since April 6 has been notable. The Dow Jones has advanced approximately 6.30% from that date, having absorbed a three-month correction of approximately 10% from its February 10 peak. This corrective pattern sits well within the parameters of normal bull market behaviour, where pullbacks of 10% or less are typically absorbed without breaking the primary uptrend.
The Bear's Eye View: A Tool for Reading Market Positioning
One of the most instructive frameworks for contextualising current market strength is the Bear's Eye View (BEV) methodology, which normalises all daily closes as a percentage distance from the most recent all-time high. This approach removes the distortion of absolute price levels and reveals the true frequency with which a market is operating in advance mode versus retreat mode.
Applied to the Dow Jones since January 1978, the data reveals a striking picture of structural bullish momentum:
- Since January 3, 1978, the Dow Jones has registered 904 new all-time highs, accounting for 7.42% of all daily closes over 48 years
- Daily closes within 5% of an all-time high (described as scoring position) have occurred on 4,855 occasions, representing 39.83% of all daily closes since 1978
- Combined, the Dow Jones has spent 47.25% of all trading days either setting new records or advancing within striking distance of them
This is not a marginal bull market statistic. Nearly half of all trading days over nearly five decades have been spent in a state of advance or near-advance, a figure that underscores the deeply embedded bullish structural character of American equities over the long run.
Volatility as the Key Risk Signal
While price proximity to all-time highs provides a useful snapshot, the most important signal for assessing whether the current bull market remains intact is daily volatility. The Dow Jones' 200-day moving average of daily volatility closed the week of May 10 at 0.60%, a reading that has historically been associated with sustained bull market conditions dating back to February 1885.
The critical threshold to watch is not any specific price level but rather a shift in the character of daily price movements. When the Dow Jones begins generating sustained daily moves of 2% or greater in either direction, and when this frequency drives the 200-day volatility moving average above 1.00%, the historical record consistently shows that significant market deterioration follows. Until that threshold is breached, the technical structure of the bull market remains fundamentally intact.
A Dow Jones advance toward 55,000 from current levels would represent a 10% gain, modest by historical bull market standards. During the 2009 to 2014 post-financial-crisis recovery, for context, the index advanced approximately 150% from its March 2009 low near 6,547 to 18,000 by mid-2014. A single-digit percentage advance from current levels is therefore a conservative and historically supportable expectation.
Gold's 25-Year Bull Market: Context, Correction, and What Comes Next
Gold's modern bull market is one of the most sustained commodity price advances in recorded financial history. It began in February 2001, when an ounce of gold could be purchased for $253. The progression from that starting point to a recent high of $5,480.92 represents a total gain of approximately 2,067% over 25 years, translating to an annualised return of roughly 7.45% compounded annually. Furthermore, according to JP Morgan, structural demand drivers suggest gold's long-term trading range may be shifting materially higher.
What makes the current phase of this bull market distinctive is not simply the price level but the behaviour of the advance itself. Analysis of gold's BEV chart since 1999 reveals that the cluster of new all-time highs produced since November 2023 is the most concentrated sequence of record closes in the entire 25-year bull market. Equally notable is that the corrective pullbacks during this phase were unusually shallow relative to prior advance periods, at least until the recent 20% correction materialised.
Is the 20% Correction a Warning or an Opportunity?
Context is everything when interpreting corrections. A review of the major corrective phases within gold's bull market since 1999 is instructive:
| Corrective Period | Approximate Decline | Duration | Bull Market Outcome |
|---|---|---|---|
| 2008 Financial Crisis | ~5-6% brief | Weeks | Bull market resumed strongly |
| 2011-2013 | ~45% | ~2 years | Gold recovered and advanced |
| 2013-2015 | ~25% | ~2 years | Formed base for next advance |
| 2026 Correction | ~20% | Months | Currently resolving |
Viewed against these historical benchmarks, the current 20% pullback is actually the least severe major correction of the entire 25-year bull market. Prior corrections of 25% to 45% did not end the structural uptrend. A 20% retreat, absorbed within a period of otherwise concentrated record-setting activity, is analytically consistent with healthy bull market consolidation rather than structural breakdown.
A constructive technical signal emerged as gold closed above its BEV -15% line during the week of May 10. The next significant confirmation would be a close above the prior corrective high, which would technically invalidate the pattern of lower highs and lower lows that had developed during the correction phase. Market analysis suggests that a refreshed gold market, following a well-absorbed correction of this magnitude, has historically entered periods of accelerated upside momentum.
Gold's 15-Count: Swimming Against the Current
One of the more counterintuitive data points from recent weeks is gold's behaviour in the face of predominantly negative daily closes. Over the 25 trading sessions ending May 10, 2026, gold registered positive daily closes on only 6 of 25 sessions, a 15-count of -3 that would typically be associated with a market under pressure. Yet despite this apparent internal weakness, gold still managed to advance 1.30% over the same period.
This kind of advance in the face of negative breadth is sometimes described in technical analysis as a market absorbing selling pressure without breaking down, a condition that often precedes a more forceful move higher once the selling exhausts itself. The analogy of a game fish swimming upstream captures this dynamic precisely: the effort required is greater, but the directional commitment is unchanged.
Gold Miners and Silver: The Overlooked Acceleration
While gold itself has attracted significant attention, two other precious metals-related assets have been generating performance that warrants closer examination: silver bullion and gold mining equities as represented by the XAU index. In addition, monitoring the gold-silver ratio provides further insight into the relative strength developing across the sector.
| Asset | Weekly Performance (May 10 week) | BEV Position | Key Trend |
|---|---|---|---|
| Gold | +1.30% since April 6 | Above BEV -15% | Corrective phase potentially ending |
| Silver Bullion | Sharp advance | Top of performance table (#1) | Outperforming gold in near term |
| XAU Index | +10.56% intra-week | BEV -18.21% | Recovery accelerating |
The XAU index moved from a BEV of -26.02% on Monday to -18.21% by Friday's close, representing an intra-week advance of 10.56%. Since its March 20 correction low of -30.21% from its February 27 all-time high, the XAU has recovered 17.19% in just weeks. These are not the numbers of a sector in structural decline.
The Institutional Under-Ownership Paradox
Perhaps the most compelling long-term investment case for gold and silver mining equities lies not in what institutional investors are doing but in what they are not doing. Despite the XAU's significant recovery from its January 2015 bear market low (which represented an approximately 80% decline from prior highs), gold and silver miners remain broadly classified as toxic or uninvestable by the majority of professional money managers and institutional allocators.
This is the paradox at the heart of the current mining equity advance: the sector is moving higher on the strength of retail and specialist capital, without meaningful institutional participation. When institutional flows eventually rotate into the sector, whether defensively during an equity bear market or offensively in response to sustained precious metals appreciation, the repricing potential is asymmetric.
The analogy of miners as a barnacle attached to the side of a whale is particularly apt. The whale (broader equity market) is enormous; the barnacle (mining sector) is tiny by comparison. When the whale eventually shifts direction, the barnacle's relative movement could be dramatic. Investors who establish positions ahead of institutional rotation historically capture the most asymmetric returns.
The Risk Architecture: Margin Debt, Leverage, and the Amplification Problem
Any honest assessment of current market conditions must grapple with the structural leverage embedded in the financial system. As of March 2026, NYSE margin debt stands at over $1.2 trillion, a figure that provides significant upside acceleration during advances but creates equally powerful and potentially vicious downside acceleration when markets reverse. Understanding margin debt risks is therefore essential for any investor seeking to navigate the current environment with clarity.
The historical precedents for margin debt contraction during bear markets are sobering:
- During the NASDAQ dot-com collapse (2000-2002), margin debt contracted by more than 50%
- During the 2008 subprime mortgage crisis, margin debt again contracted by more than 50%
- During the 1929-1932 crash, the Dow Jones declined 89% as NYSE margin debt contracted by 95%
For scale, NYSE margin debt peaked at approximately $7 billion in 1929. Today, the figure exceeds $1.2 trillion, illustrating the extraordinary degree of monetary expansion over the intervening century. This is not a comparison designed to predict an imminent collapse. Rather, it establishes the mechanical reality that forced liquidation during sustained declines is not discretionary. When margin calls are issued and clients do not respond, brokers close positions at whatever price the market offers. This process creates cascading selling pressure that is disconnected from fundamental valuations, amplifying losses far beyond what earnings deterioration or economic weakness alone would justify.
Monitoring the trajectory of margin debt, not just its absolute level, provides a leading indicator of the fragility underlying current market conditions.
Transportation Stocks and the Divergence Warning
Not every technical signal in the current market is uniformly bullish. The Dow Jones Transportation Average presents a notable exception to the broad strength seen across major indexes. After generating multiple new all-time highs in mid and late April 2026, transportation stocks abruptly reversed into double-digit percentage declines in a matter of weeks.
This divergence between transportation companies and broader market indexes carries significance within the framework of Dow Theory, a century-old analytical approach that interprets non-confirmation between industrials and transports as a warning signal for the primary trend. Transportation companies are economically sensitive by nature, their revenues and forward guidance reflecting real-world trade flows, shipping volumes, and logistics conditions.
The role of geopolitical disruption in driving this divergence warrants attention. Disruptions to critical global shipping corridors, including the Strait of Hormuz, transmit rapidly into transportation sector earnings and commodity pricing. Whether this sector weakness represents a leading indicator of broader market stress or a temporary sector-specific disruption remains an open question as of May 2026, however it is a signal that warrants ongoing monitoring rather than dismissal.
The next major ASX story will hit our subscribers first
Portfolio Construction: Positioning Across Both Bull Markets
Given the dual bullish structure in equities and precious metals, and the risk architecture building beneath both, how should investors be thinking about portfolio construction? The evidence supports a framework that maintains equity exposure while systematically building precious metals positions as a hedge against eventual cycle deterioration. However, investors should also remain alert to management red flags when evaluating individual mining equities, as poor governance can undermine even the most favourable commodity cycle.
A practical approach to precious metals allocation might look like this:
- Core allocation (90 to 95%): Established, producing gold and silver mining companies with proven reserves, operating cash flow, and management track records. These provide leveraged exposure to precious metals prices with reduced exploration risk.
- Speculative allocation (5 to 10%): Junior exploration companies operating in high-potential geological jurisdictions, where discovery risk is elevated but asymmetric upside potential exists. This allocation should be sized specifically for the possibility of total loss.
- Physical bullion: Gold and silver bullion held as a non-correlated store of value, independent of equity market cycles and free from counterparty risk.
The case for maintaining equity exposure alongside precious metals rests on the technical reality that the Dow Jones and gold remain bullish by every measurable indicator available in May 2026. However, the asymmetry of risk at late-cycle valuations means that the reward-to-risk ratio for pure equity exposure is compressing even as headline prices advance. As any market advance approaches its ultimate top, opportunities to realise profits narrow precisely as risks to invested capital reach their maximum.
Frequently Asked Questions
Why do the Dow Jones and gold remain bullish simultaneously?
The simultaneous advance reflects a combination of factors including expansionary monetary policy across multiple decades, elevated institutional demand for gold as a hedge against fiscal instability, and continued equity market momentum driven by large-cap earnings. The positive correlation between the two assets, which has reached as high as 85% over the past decade, represents an historically unusual dynamic that may ultimately resolve through a significant divergence as one asset reprices relative to the other.
What technical signal would confirm the Dow Jones bull market is ending?
The most reliable quantitative signal is a sustained rise in the Dow Jones' 200-day moving average of daily volatility above 1.00%, accompanied by recurring daily moves of 2% or greater. This combination has historically preceded significant market deterioration and provides a rules-based, quantifiable threshold for reassessing equity exposure.
How significant is NYSE margin debt at $1.2 trillion?
Margin debt at this scale is both a confirmation of the bull market's depth and a structural amplifier of any future correction. During forced liquidation events, broker-initiated selling creates price-indiscriminate cascades that can produce declines far larger than fundamental conditions alone would warrant. The 1929 parallel, where $7 billion in margin debt contracted by 95% during an 89% market decline, illustrates the mechanism even if the absolute scale was far smaller.
What happens to gold when equities eventually correct?
Historical precedent from the 1929-1932 crash, the 2000-2002 dot-com collapse, and the 2008 financial crisis consistently shows that gold and gold mining equities tend to significantly outperform equity markets during prolonged bear phases. The current under-owned condition of the mining sector could amplify this outperformance materially if institutional capital rotates defensively into the space.
Disclaimer: This article is intended for informational and educational purposes only. Nothing contained herein constitutes financial advice, investment recommendations, or a solicitation to buy or sell any financial instrument. All references to price targets, historical returns, and market projections involve inherent uncertainty. Past performance is not indicative of future results. Investors should conduct their own due diligence and consult a qualified financial adviser before making investment decisions.
Want to Position Yourself Ahead of the Next Major ASX Mineral Discovery?
Discovery Alert's proprietary Discovery IQ model delivers real-time alerts on significant ASX mineral discoveries, instantly translating complex mineral data into actionable investment insights for both short-term traders and long-term investors — explore historic discoveries and their exceptional returns to understand the asymmetric opportunities this sector can generate, then begin your 14-day free trial at Discovery Alert to secure your market-leading edge.