June 12, 2026
The Hidden Architecture Behind East Africa's Trade Explosion
Global commodity cycles have a peculiar way of revealing which economies are structurally positioned to benefit and which are merely along for the ride. When copper prices rise and China's industrial demand accelerates, the reverberations travel thousands of kilometres inland, through landlocked mining corridors, along rail and road networks, and out through coastal port gates. For the East African Community, the first quarter of 2026 has made one thing abundantly clear: the region is not a passive observer of commodity cycles. It is increasingly a central participant in them.
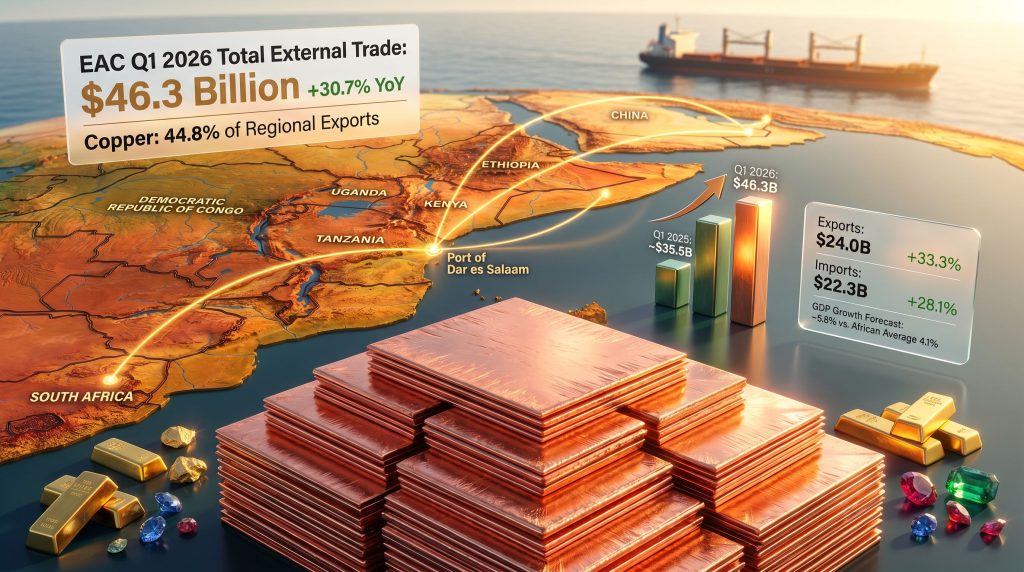
East African Community trade growth driven by mineral exports has emerged as the defining economic story of the region in 2026, with total external trade climbing 30.7% year-on-year to $46.3 billion in Q1 alone. Yet the headline figure, compelling as it is, only begins to describe the structural transformation occurring beneath the surface.
When big ASX news breaks, our subscribers know first
Unpacking the $46.3 Billion Trade Milestone
The scale of the Q1 2026 performance places the EAC among the fastest-expanding trade blocs on the African continent. With the United Nations Economic Commission for Africa projecting regional GDP growth of approximately 5.8% for 2026 against an African continental average of 4.1%, the EAC is operating with a measurable structural advantage over its peers.
The core metrics break down as follows:
| Indicator | Q1 2026 Value | Year-on-Year Change |
|---|---|---|
| Total external trade | $46.3 billion | +30.7% |
| Export earnings | $24.0 billion | +33.3% |
| Import expenditure | $22.3 billion | +28.1% |
| Trade surplus | $197 million | Down from ~$551 million |
| Regional inflation (March 2026) | 10.6% | Down from 27.0% |
| Projected GDP growth (2026) | ~5.8% | vs. African avg. of 4.1% |
The fact that exports expanded faster than imports at 33.3% versus 28.1% initially appears favourable. However, the contraction of the trade surplus from approximately $551 million in Q1 2025 to just $197 million in Q1 2026 signals that import demand is accelerating alongside economic expansion. This narrowing warrants close monitoring, as sustained import acceleration without corresponding diversification in export revenues could compress the surplus further over coming quarters.
One macroeconomic development that has received insufficient attention in mainstream commentary is the dramatic compression of regional inflation. A decline from 27% to 10.6% over twelve months is not a gradual adjustment. It represents a fundamental improvement in price stability that directly lowers transaction costs across borders, improves the real purchasing power of regional importers, and reduces the risk premium embedded in trade financing arrangements. For businesses operating across EAC member states, this inflation trajectory has been quietly transformative.
Copper's Extraordinary Grip on EAC Export Revenue
No single data point from the Q1 2026 bulletin is more analytically striking than copper's 44.8% share of total regional exports. For context, it is unusual for any single commodity to account for nearly half of a multi-nation trading bloc's entire export basket. This level of concentration is not merely an economic curiosity. It is a structural exposure that determines the fate of the region's trade performance with every movement in global copper pricing.
When a single commodity accounts for more than two-fifths of a region's total export earnings, the distinction between commodity market performance and regional economic performance becomes dangerously blurred.
Understanding why copper dominates requires looking at what is driving demand globally. The energy transition has fundamentally altered copper's demand profile, and the copper demand drivers reshaping global markets are directly influencing EAC export revenues. Electric vehicles require approximately four times more copper than internal combustion engine vehicles. Grid-scale battery storage systems, offshore wind turbines, and solar photovoltaic installations all require copper at intensities that are reshaping long-term demand forecasts. East Africa, sitting atop significant copper reserves concentrated primarily in the Democratic Republic of the Congo and Tanzania, finds itself at the geographic intersection of this demand shift.
What is less commonly understood is the distinction between copper cathode and copper concentrate as export products. Much of the copper leaving the EAC region travels as concentrate or semi-processed material rather than refined cathode, which commands higher per-tonne pricing. This processing gap means the region is capturing only a fraction of the potential value embedded in its copper resources. The gap between concentrate pricing and cathode pricing can represent a 15% to 25% revenue differential per tonne, a figure that compounds significantly at the export volumes now being recorded.
Precious metals and gemstones added a further 21.6% to EAC export earnings, with gold from Tanzania and the DRC functioning as the second major revenue pillar.
EAC Export Composition Summary, Q1 2026
| Export Category | Share of Total Exports | Primary Contributing Nations |
|---|---|---|
| Copper | 44.8% | DRC, Tanzania |
| Precious metals and gemstones | 21.6% | Tanzania, DRC |
| Agricultural products (coffee, tea, spices) | Remaining share | Kenya, Uganda, Ethiopia |
Together, copper and precious metals account for 66.4% of EAC export earnings, creating a commodity concentration that amplifies both upside opportunity and downside vulnerability.
China's Expanding Footprint in EAC Trade Geography
The bilateral trade relationship between China and the EAC deepened considerably in Q1 2026. Regional exports to China rose 45.8%, climbing from $5.9 billion to $8.6 billion, while imports from China surged from $4.2 billion to $6.8 billion. Combined bilateral trade reached approximately $15.4 billion in a single quarter.
The underlying exchange pattern is straightforward: raw and semi-processed minerals flow eastward toward Chinese smelters and manufacturing facilities, while machinery, construction materials, electronics, and consumer goods flow westward into the EAC market. This mirrors the resource-for-manufactured-goods architecture that characterises China's trade relationships across much of sub-Saharan Africa.
What makes this relationship strategically significant is its correlation structure. With exports to China growing at 45.8% in a single quarter, any material slowdown in Chinese industrial output, property sector construction, or infrastructure investment would transmit directly and rapidly into EAC export volumes. Chinese copper demand accounts for roughly 55% of global refined copper consumption according to widely cited industry estimates, meaning the EAC's export performance is substantially a derivative of Chinese economic conditions.
Beyond China, the EAC's trade network spans several other strategic partners:
- The United Arab Emirates and South Africa function as primary export destinations
- India, Japan, and the UAE serve as major import suppliers to the bloc
- Africa as a whole accounts for 24.1% of total EAC external trade, the largest share of any regional grouping
- Trade with the rest of the continent reached $11.2 billion, up 17.8% year-on-year
Regional Trade Partner Performance, Q1 2026
| Trading Partner / Grouping | Trade Value | Year-on-Year Change |
|---|---|---|
| Africa (total) | $11.2 billion | +17.8% |
| SADC | Not separately disclosed | +17.4% |
| COMESA | Not separately disclosed | -4.7% |
| Intra-EAC | Not separately disclosed | -10.4% |
| China (bilateral combined) | ~$15.4 billion | Exports +45.8% |
The Intra-Regional Trade Paradox and What It Reveals
Perhaps the most analytically important finding embedded in the Q1 2026 data is the 10.4% decline in intra-EAC trade, occurring simultaneously with a 30.7% surge in external trade. This divergence exposes a structural fault line in the bloc's economic integration agenda. Furthermore, research on EAC trade patterns suggests these dynamics are not entirely new, having been embedded in regional trade architecture for some time.
The mechanics of this paradox are rooted in commodity export dynamics. When mineral prices rise and Chinese demand intensifies, the benefits flow disproportionately toward export-oriented trade with commodity-hungry external markets. Intra-regional trade, which tends to involve manufactured goods, processed agricultural products, and services rather than raw minerals, does not participate in this upswing in the same way. The mineral export boom effectively draws productive capacity, logistics resources, and capital toward export corridors rather than intra-regional supply chains.
The 4.7% contraction in COMESA trade compounds this picture. COMESA spans 21 member states and represents one of Africa's most ambitious continental integration frameworks. A decline within this grouping during a period of strong external trade growth may reflect several converging pressures:
- Currency volatility across member states creating pricing uncertainty in cross-border transactions
- Persistent non-tariff barriers including inconsistent customs procedures, documentation requirements, and border delays
- Logistics bottlenecks that disproportionately disadvantage intra-continental trade relative to the well-developed port-based export corridors serving external markets
- Competitive displacement, where cheap imported goods from China undercut regionally produced alternatives
The decline in intra-EAC trade during an export boom is not a contradiction. It is a predictable structural consequence of commodity-led growth that has not yet been accompanied by commensurate investment in regional manufacturing and value-chain integration.
Port Infrastructure as the Invisible Multiplier of Mineral Export Capacity
The role of logistics infrastructure in enabling the EAC's mineral export surge is frequently underappreciated in trade commentary. The Port of Dar es Salaam functions as the primary export gateway not only for Tanzania's own mineral production but for landlocked nations including the DRC, Zambia, and Uganda, whose mineral exports must transit through Tanzania to reach ocean freight routes.
Port throughput capacity directly constrains or enables the volume of copper concentrate, gold doré, and other commodities that can be shipped to global markets within a given timeframe. Investments in berth capacity, handling equipment, and rail corridor connectivity between mining regions and the port have served as force multipliers for the export volumes now being recorded.
A less commonly discussed dynamic is the bottleneck risk this creates. When a single port handles a disproportionate share of multiple nations' mineral exports, operational disruptions, labour disputes, or infrastructure maintenance events can cascade across the entire regional export supply chain simultaneously. Diversifying export corridor infrastructure, including the development of alternative routes through Mozambique and Kenya, represents a medium-term strategic priority for regional trade resilience.
The next major ASX story will hit our subscribers first
The Value-Addition Gap: East Africa's Most Significant Untapped Opportunity
Across mining jurisdictions globally, there is a well-documented economic hierarchy of commodity processing. Raw ore generates the lowest per-unit revenue. Concentrate adds some value. Refined metal or cathode-grade material captures significantly more. Finished manufactured components or alloys represent the highest value tier.
The EAC currently operates predominantly at the lower end of this hierarchy. Copper leaves the region primarily as concentrate. Gold exits as doré bars rather than refined bullion. Gemstones are frequently exported uncut, with the value-adding cutting and polishing work occurring in India, Belgium, and the UAE. The copper supply crunch emerging globally, moreover, makes the case for domestic processing capacity even more compelling from a strategic standpoint.
The revenue implications of this value-addition gap are substantial:
- Copper processing: Building smelting and refining capacity within the EAC could capture an estimated 15% to 25% premium per tonne compared with concentrate exports
- Gold refining: Establishing London Bullion Market Association-accredited refining capacity would allow EAC-sourced gold to access premium pricing tiers in international markets
- Gemstone processing: Developing cutting, polishing, and grading infrastructure for Tanzania's significant tanzanite and coloured gemstone production could multiply per-unit export revenues several times over
The transition from extraction to value addition requires substantial capital investment, technical expertise, and consistent policy environments that attract downstream industrial investment. These are not short-term fixes, but they represent the most credible pathway toward reducing commodity concentration risk while simultaneously deepening intra-regional industrial activity. In addition, copper smelting expansion in neighbouring regions demonstrates the kind of downstream industrial model the EAC could credibly emulate.
Agricultural Exporters and the Diversification Baseline
While minerals dominate the Q1 2026 headline figures, it would be analytically incomplete to overlook the ongoing contribution of agricultural exports from Kenya, Uganda, and Ethiopia. Coffee, tea, and spices continue to generate meaningful export revenues and, critically, provide a diversification baseline that partially insulates the bloc's overall export performance from pure commodity price volatility.
Agricultural exports also tend to support more distributed economic benefits across rural populations than mineral extraction, which is typically capital-intensive and geographically concentrated. For long-term inclusive growth, the agricultural export base remains a strategic anchor even as minerals dominate the current cycle. Furthermore, critical minerals demand trends globally suggest that commodity-led growth will remain a powerful force for the EAC throughout this decade.
Frequently Asked Questions: EAC Trade and Mineral Exports
What drove the 30.7% increase in EAC external trade in Q1 2026?
The expansion was primarily powered by a 33.3% surge in export earnings to $24.0 billion, with copper alone accounting for 44.8% of total exports and precious metals and gemstones contributing a further 21.6%. Strong global demand for strategic raw materials, elevated commodity prices, and improvements in regional logistics infrastructure were the principal catalysts.
Which country is the EAC's largest single trading partner?
China holds the position of largest single-country trading partner, with combined bilateral trade reaching approximately $15.4 billion in Q1 2026. However, Africa collectively remains the largest trading partner grouping, accounting for 24.1% of total EAC external trade.
Why did intra-EAC trade decline while overall external trade surged?
Intra-EAC trade fell 10.4% in Q1 2026 because the mineral export boom disproportionately benefits trade with commodity-importing external markets rather than regional partners. Intra-regional trade is more diversified and does not benefit from mineral price surges in the same manner as extra-regional export flows.
What is the EAC's projected economic growth rate for 2026?
The United Nations Economic Commission for Africa estimates EAC economic growth at approximately 5.8% for 2026, compared with an African continental average of 4.1%.
How significant is the value-addition gap for EAC mineral exports?
Very significant. The difference between exporting copper as concentrate versus refined cathode can represent a 15% to 25% revenue differential per tonne. Building downstream processing capacity within the region represents one of the most consequential long-term economic opportunities available to EAC member states.
Reading the Risk Landscape Behind the Record Numbers
The EAC's Q1 2026 trade performance is genuinely exceptional by any historical or regional comparison. A 30.7% expansion in total trade, export growth outpacing imports, inflation compressed by more than 16 percentage points year-on-year, and a regional GDP growth trajectory running 1.7 percentage points above the African average all point toward a bloc experiencing a period of uncommon economic momentum.
Yet several risk vectors deserve clear-eyed assessment. Commodity concentration, with 66.4% of export earnings derived from copper and precious metals, creates an earnings profile that is fundamentally correlated with global commodity markets rather than domestic productivity growth. A sustained decline in copper prices, driven by a slowdown in Chinese construction activity or accelerated material substitution in certain technology applications, would transmit rapidly and forcefully into EAC export revenues.
The growing correlation with Chinese industrial demand cycles adds a geopolitical dimension to this commodity risk. Trade relationships of this bilateral weight can generate dependency dynamics that constrain policy flexibility over time. Consequently, governance of mineral resources across East Africa represents a critical policy frontier that will shape how equitably and sustainably these export gains are distributed domestically.
The strategic imperative for EAC policymakers is not to moderate mineral extraction, where demand and revenue remain compelling, but to build the refining, processing, and manufacturing infrastructure that progressively converts raw mineral wealth into higher-value export products. This transition would simultaneously reduce commodity concentration risk, stimulate intra-regional industrial trade, and position the EAC as a more durable and resilient participant in global supply chains. East African Community trade growth driven by mineral exports will only remain a lasting structural achievement if accompanied by deliberate policy to capture greater value from the region's natural endowments.
Readers seeking ongoing coverage of East African economic developments, trade data, and mining sector analysis can explore reporting from Ecofin Agency, which provides sector-focused coverage across African economic sectors including mining, finance, and trade policy.
This article contains forward-looking projections and economic analysis based on publicly available data. Forecasts, growth estimates, and trade trajectory assessments involve inherent uncertainty and should not be construed as financial or investment advice. All figures sourced from the EAC Statistical Bulletin Q1 2026 and United Nations Economic Commission for Africa estimates.
Want To Be First To Discover The Next Major ASX Mineral Find Powering This Commodity Surge?
As copper and precious metals reshape trade flows across East Africa and beyond, Discovery Alert's proprietary Discovery IQ model scans ASX announcements in real time, delivering instant alerts on significant mineral discoveries so subscribers can identify actionable opportunities ahead of the broader market — explore historic examples of what major discoveries can return, then begin your 14-day free trial at Discovery Alert to position yourself at the forefront of the next major find.