August 19, 2026
When Crude Stockpiles and Price Direction Stop Agreeing
Commodity markets have a peculiar habit of humbling the most rigorous analysts. Textbook economics suggests that rising inventories should weaken prices, yet oil markets regularly produce the opposite outcome. Understanding why requires moving beyond the headline inventory number and examining the full architecture of the petroleum complex, from the methodology behind the data to the crude oil market dynamics that can override it entirely.
The current situation in U.S. crude oil markets is a textbook case of this complexity. EIA crude oil inventories are still rising, yet WTI and Brent futures have gained ground. Distillates are draining while crude builds. Annual forecasts project tightness while weekly data shows accumulation. Unravelling these apparent contradictions reveals far more about where markets are headed than any single data point could.
When big ASX news breaks, our subscribers know first
How the EIA Weekly Report Actually Works, and Why It Matters More Than API Data
The U.S. Energy Information Administration publishes its Weekly Petroleum Status Report every Wednesday, covering commercial crude held at refineries, pipeline facilities, and tank farms throughout the country. Critically, this excludes the Strategic Petroleum Reserve, which is a separate federal stockpile managed independently of commercial supply dynamics.
The EIA's methodology draws on a broader and more comprehensive survey base than the American Petroleum Institute's competing weekly estimate. The API relies on voluntary submissions from industry participants, while the EIA's data collection is more systematic and extensive. This structural difference explains why the two datasets frequently diverge, sometimes dramatically.
The divergence seen in the week ending August 14, 2026 is a prime example: API reported a draw of 328,000 barrels, while the EIA recorded a build of 4.4 million barrels. The gap between these two readings is not an anomaly but reflects how differently the two organisations capture import and export flows in real time.
Professional traders and institutional investors treat the EIA report as the authoritative benchmark. When the EIA number contradicts API data published the day prior, it is the EIA figure that drives sustained price reaction. The API number functions more as a positioning tool for traders in the hours before Wednesday's official release.
Decoding the Recent Inventory Build Cycle
The inventory accumulation across recent weeks has been significant enough to shift the structural position of U.S. commercial crude stocks relative to the seasonal five-year average.
| Reporting Week | Inventory Change | Total Commercial Stocks | vs. 5-Year Average |
|---|---|---|---|
| Week ending July 17, 2026 | +2.0 million bbl | ~406 million bbl | Below average |
| Week ending August 7, 2026 | +17.4 million bbl | 424.4 million bbl | ~2% below 5-yr avg |
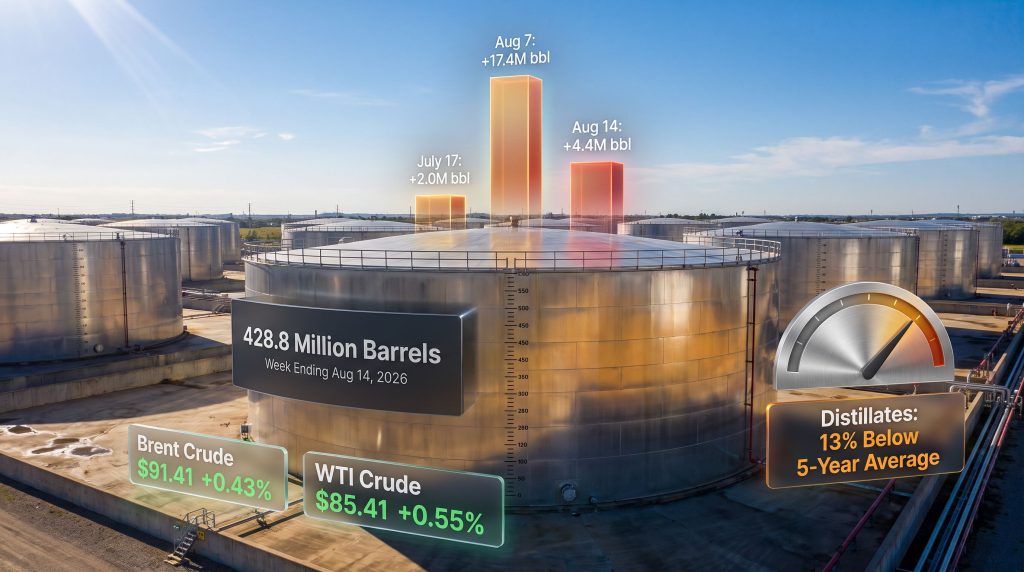
| Week ending August 14, 2026 | +4.4 million bbl | 428.8 million bbl | At 5-year average |
The August 7 build of 17.4 million barrels was the largest single-week gain recorded since January 2023. That scale of accumulation in a single reporting period is rare, and it shifted the narrative from a market running below seasonal norms to one that is now sitting precisely at the five-year average. The follow-on build of 4.4 million barrels for the week ending August 14 confirmed that the accumulation was not an aberration in the data.
What Drove These Back-to-Back Builds?
Several supply-side forces converged to produce consecutive weeks of inventory growth:
- Higher crude import volumes flowing into Gulf Coast and Midwest storage hubs, driven in part by international suppliers redirecting barrels to U.S. buyers
- Reduced export outflows, which limit the rate at which domestic barrels leave the country and enter global supply chains
- Refinery throughput variability, which affects how quickly crude is drawn down into refined products
- Seasonal softening in refinery demand, as some facilities undertake maintenance cycles toward the end of summer driving season
When imports rise and exports fall simultaneously, the arithmetic of inventory accounting tilts sharply toward a build regardless of underlying demand conditions. This is a mechanical dynamic rather than a demand signal, and it is one reason experienced analysts treat individual weekly builds with caution.
The Paradox: EIA Annual Outlook vs. Weekly Build Reality
One of the most analytically interesting tensions in the current data environment is the conflict between the EIA's weekly inventory readings and its own Short-Term Energy Outlook. While consecutive weekly builds have pushed commercial stocks to the five-year seasonal average, the EIA's annual forecasting model continues to project that U.S. inventories will remain below the five-year seasonal low through the end of 2026.
Furthermore, this means the agency responsible for publishing the bearish weekly inventory data simultaneously believes those builds represent a transient fluctuation within a structurally undersupplied market, not the beginning of a sustained surplus cycle. Monitoring crude oil price trends alongside inventory data helps contextualise this divergence.
This kind of internal tension within the same data source is worth flagging for investors and analysts. It suggests the EIA views current accumulation as a temporary deviation driven by import timing and export slowdowns rather than a fundamental shift in the supply-demand balance. If that interpretation proves correct, any sustained recovery in export volumes or refinery throughput could reverse the build cycle relatively quickly.
What Rising Stockpiles Mean for WTI and Brent Prices
Despite what should, in isolation, be a bearish inventory signal, crude futures moved higher on the day of the EIA release on August 19, 2026.
| Benchmark | Price (USD/bbl) | Day Change | Week-over-Week Change |
|---|---|---|---|
| Brent Crude | $91.41 | +$0.39 (+0.43%) | ~+$3.00 |
| WTI Crude | $85.41 | +$0.47 (+0.55%) | ~+$3.00 |
The explanation lies in what inventory data cannot capture: geopolitical risk premiums. Disruption concerns centred on the Strait of Hormuz have been driving a sustained bid in crude futures that has proven resilient against bearish fundamental prints. Hormuz remains the most critical chokepoint in global oil logistics, with an estimated 20% of global petroleum trade transiting the strait. When shipping traffic through the waterway slows or comes under threat, the market prices in a supply disruption premium that can entirely override inventory signals.
This is a recurring feature of oil geopolitics analysis. Fundamental data governs price direction during periods of geopolitical calm, but when supply disruption risk enters the equation, sentiment and risk premium can dominate for extended periods. Traders who positioned short based solely on the inventory build would have found themselves wrong-footed by the geopolitical overlay.
Three Scenarios for the Inventory Trajectory Through Q4 2026
| Scenario | Inventory Trend | WTI Price Implication |
|---|---|---|
| Builds continue (3+ more weeks) | Approaches 5-year high | Downward pressure toward $80/bbl |
| Builds stabilise near current levels | At 5-year average | Range-bound $83-$88/bbl |
| Draws resume (exports recover) | Returns below 5-year average | Upside toward $90+ |
OPEC's market influence remains a critical variable in this scenario analysis. If the group maintains its existing output constraints into Q4 2026, the pace of any inventory accumulation in the U.S. is likely to be tempered by tightening global supply. Conversely, if OPEC+ members begin to exceed their quotas as some have historically done, the additional barrels entering global markets could sustain or accelerate the current U.S. build cycle.
The More Alarming Story: Distillate Markets
While crude inventory builds have attracted the most attention, the refined product data embedded in the same EIA report tells a structurally more concerning story. Distillate inventories, which encompass diesel fuel and heating oil, fell by 1.5 million barrels in the week ending August 14 and are now running 13% below the five-year seasonal average.
Distillate Market Snapshot:
- Weekly change: -1.5 million barrels
- Average daily production: 5.2 million barrels
- Four-week average demand: 3.7 million barrels per day (down 0.8% year-over-year)
- Current level: 13% below the five-year average
Why this matters beyond the energy sector: Distillate fuel is the lifeblood of freight logistics, agricultural machinery, and industrial manufacturing. A 13% deficit below the five-year seasonal average heading into the northern hemisphere winter is not a minor imbalance. It carries direct implications for transportation costs, food supply chain expenses, and industrial energy bills.
Jeff Currie, the veteran commodity strategist, has argued publicly that the real pricing crisis in the current environment is not in crude oil but in diesel, with some market observers flagging the potential for extreme diesel price spikes if the distillate deficit is not resolved before peak winter demand arrives. This framing reorients the investor focus from crude inventory headlines to the refined product markets where structural tightness is already embedded. The broader trade war oil impact on refined product flows has compounded these distillate supply pressures in key markets.
Gasoline Market Snapshot:
- Weekly change: +700,000 barrels
- Prior week: -1.0 million barrels
- Average daily production: 9.7 million barrels
- Four-week average demand: 8.9 million barrels per day
Gasoline inventories recovered modestly after the prior week's draw. However, the four-week average demand of 8.9 million barrels per day is worth monitoring as a signal of whether the post-summer demand softening represents a cyclical seasonal pattern or something more structurally persistent.
The next major ASX story will hit our subscribers first
U.S. Oil Demand: Reading the Underlying Signal
| Product Category | 4-Week Average Demand | Year-over-Year Change |
|---|---|---|
| Total Products Supplied | 20.5 million bpd | -2.9% |
| Motor Gasoline | 8.9 million bpd | Not specified |
| Distillates (Diesel/Heating Oil) | 3.7 million bpd | -0.8% |
Total products supplied, which the EIA uses as a demand proxy, averaged 20.5 million barrels per day over the four-week period, representing a 2.9% decline compared to the equivalent period in the prior year. This softening in apparent demand is real but should be interpreted carefully.
Year-over-year demand comparisons in late summer 2026 are being measured against a period when post-pandemic mobility and industrial activity were still running at elevated levels. A 2.9% year-on-year decline does not necessarily indicate recessionary demand destruction. It may simply reflect the normalisation of consumption patterns after an extended period of above-trend activity.
The more granular distillate demand figure, down just 0.8% year-on-year despite weaker macro readings, actually suggests that freight and industrial consumption are holding up with relative resilience. If distillate demand were collapsing, the inventory deficit would be self-correcting. Instead, the persistent draw on distillate stocks alongside only modest demand softening points to a production-side constraint, not a demand-led surplus.
Frequently Asked Questions: EIA Crude Oil Inventories
What Is the EIA Weekly Petroleum Status Report?
The U.S. Energy Information Administration releases a weekly petroleum status report every Wednesday. It covers commercial crude oil stocks, refined product inventories, refinery utilisation rates, and demand proxy figures for the United States, and is widely regarded as the most market-moving weekly data release in global energy markets.
Why Did EIA Inventories Rise While API Showed a Draw?
The API and EIA use different methodologies. API data is sourced from voluntary industry submissions, while the EIA runs a broader and more systematic survey. Discrepancies are common, particularly around the timing and measurement of import and export volumes. The EIA figure is considered the more authoritative of the two.
Are Rising Crude Inventories Always Bearish for Oil Prices?
Not in isolation. Inventory builds can be offset by geopolitical supply risk, OPEC+ production restraint, or tightness in refined product markets. The current environment, where distillates are 13% below the five-year average while crude builds, illustrates how different segments of the petroleum complex can simultaneously send conflicting signals.
How Do EIA Inventory Reports Affect WTI Crude Oil Prices?
Larger-than-expected builds typically pressure WTI lower, while unexpected draws tend to support price gains. However, when geopolitical risk premiums dominate market sentiment, price action can and does diverge sharply from the inventory signal. The Strait of Hormuz situation and the August 19, 2026 session, where crude rallied despite a bearish build, is a clear illustration of this dynamic.
Key Takeaways
- EIA crude oil inventories are still rising, with the week ending August 14 recording a 4.4 million barrel build, bringing total commercial stocks to 428.8 million barrels
- The prior week's build of 17.4 million barrels was the largest single-week gain since January 2023
- Commercial crude stocks have moved from below the five-year average to precisely at it in the span of two reporting periods
- Despite the bearish inventory data, Brent traded at $91.41 and WTI at $85.41 on the day of release, lifted by Hormuz disruption risk premiums
- Distillate inventories remain 13% below the five-year average, representing a more structurally significant tightness than the crude build cycle implies
- The EIA's own annual outlook continues to project inventories finishing 2026 below the five-year seasonal low, framing current builds as transient rather than trend-defining
- Total U.S. oil demand averaged 20.5 million barrels per day, down 2.9% year-on-year, though the magnitude of decline appears consistent with seasonal normalisation rather than structural demand destruction
This article is for informational purposes only and does not constitute financial or investment advice. Crude oil prices, inventory levels, and market forecasts are subject to rapid change and should not be relied upon as the sole basis for investment decisions. Readers should consult qualified financial advisers before making investment choices related to energy markets or commodity-linked securities.
Want to Stay Ahead of the Next Major Commodity Discovery?
While crude oil markets navigate the complexity of conflicting inventory signals and geopolitical risk premiums, significant mineral discoveries on the ASX can offer compelling opportunities across the broader commodities complex — and Discovery Alert's proprietary Discovery IQ model instantly alerts subscribers to these moments as they happen. Explore how historic discoveries have generated substantial returns on Discovery Alert's dedicated discoveries page, and begin your 14-day free trial today to position yourself ahead of the market.