August 21, 2026
Inside the Two-Phase Oil Market Cycle: What the EIA's 2026 Crunch and 2027 Glut Mean for Energy
Few forces reshape energy markets as rapidly or as brutally as geopolitical disruption at a critical supply chokepoint. When the physical infrastructure underpinning global oil flows is compromised, the ripple effects move far beyond shipping lanes and tanker schedules, cascading through inventory levels, futures curves, monetary policy, and corporate capital allocation decisions worldwide. The current period represents one of those rare moments where a single geopolitical variable, sustained disruption through the Strait of Hormuz, is driving the EIA oil crunch in 2026 and glut in 2027 — a two-phase structural transition the U.S. Energy Information Administration has formally quantified in its August 2026 Short-Term Energy Outlook (STEO).
Understanding that transition — how deep the 2026 supply crunch runs, how large the 2027 surplus may become, and what price levels connect those two extremes — is now one of the most consequential analytical exercises in global commodity markets.
When big ASX news breaks, our subscribers know first
The Mechanics of a Back-to-Back Market Reversal
What makes the EIA's August 2026 STEO particularly significant is not any single data point in isolation. It is the sequential nature of the forecast: a genuine supply deficit in 2026 giving way to what could be one of the largest annual surpluses in the modern history of oil markets. This kind of compressed, directional reversal creates structural challenges for every participant in the supply chain, from sovereign producers managing budget breakevens to integrated majors hedging multi-year production profiles.
The EIA's global liquids balance sheet for this period tells the story with clarity:
| Metric | 2025 Actual | 2026 Forecast | 2027 Forecast |
|---|---|---|---|
| Global Consumption (mb/d) | 103.98 | 102.73 | 104.96 |
| Global Production (mb/d) | 106.12 | 100.82 | 109.74 |
| Net Balance (mb/d) | +2.13 (Surplus) | -1.91 (Deficit) | +4.78 (Surplus) |
Source: EIA August 2026 Short-Term Energy Outlook
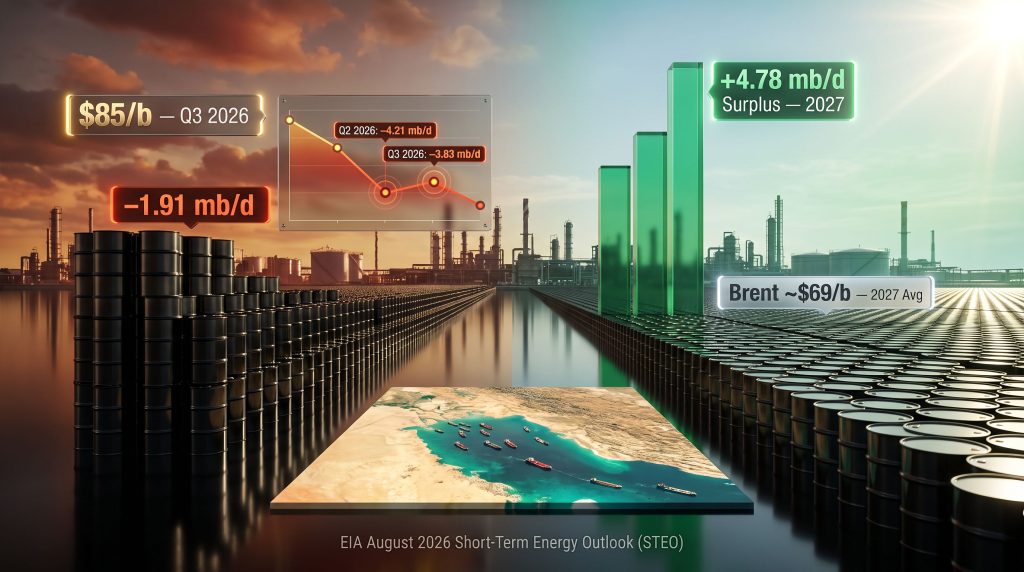
The market moved from a 2.13 mb/d surplus in 2025 to a 1.91 mb/d deficit in 2026, before projecting an extraordinary swing to a 4.78 mb/d surplus in 2027. The total directional shift between the tightest and loosest points of this cycle approaches 6.7 mb/d within a 24-month window — a magnitude that underscores just how exposed global oil markets remain to sudden geopolitical disruptions at chokepoint infrastructure.
How the 2026 Deficit Distributes Across Quarters
The annual average deficit figure of 1.91 mb/d understates the severity of the mid-year supply squeeze. The tightening is heavily concentrated in the central quarters of 2026, creating a very specific window of maximum market stress.
| Quarter | Market Balance (mb/d) | Directional Signal |
|---|---|---|
| Q1 2026 | -1.07 | Deficit |
| Q2 2026 | -4.21 | Deep Deficit |
| Q3 2026 | -3.83 | Deep Deficit |
| Q4 2026 | -0.63 | Easing Deficit |
| Q1 2027 | +3.83 | Surplus Begins |
| Q2 2027 | +4.59 | Growing Surplus |
| Q3 2027 | +4.84 | Expanding Surplus |
| Q4 2027 | +5.82 | Peak Surplus |
The Q2 2026 figure is particularly striking. Global inventories were being drawn down at an average rate of approximately 4.2 mb/d during that quarter, with the EIA projecting a further 3.8 mb/d average drawdown in Q3 2026. Historically, inventory drawdown rates of this pace have correlated with significant upward price pressure, as physical supply tightness becomes increasingly difficult to bridge through commercial stock releases alone.
"Strategic Insight: The compression of extreme deficit conditions into Q2 and Q3 2026 creates a very narrow window of elevated price opportunity for producers, followed by a rapid transition to oversupply conditions from Q1 2027 onward. Producers that mistime capital and hedging decisions relative to this inflection could face significant margin compression."
The Strait of Hormuz: Why This Chokepoint Defines the Entire Forecast
The Strait of Hormuz carries roughly 20 to 21 percent of global oil liquids flows through a narrow maritime passage between Iran and the Oman peninsula, making it the single most critical oil transit infrastructure on earth. Unlike pipeline disruptions or production field outages, which tend to affect discrete volumes in specific markets, Hormuz constraints cascade across the entire seaborne crude trade simultaneously.
Furthermore, the EIA's August 2026 STEO revised its estimates of Middle East shut-in crude production upward compared with its July forecast, citing continued severe constraints on Strait of Hormuz transits. Key elements of the agency's Hormuz assumptions include:
- Severe transit constraints are assumed to persist through at least August 2026
- A gradual normalisation pathway is modelled beginning in late 2026 and extending into early 2027
- Most shut-in regional crude production is expected to return to near pre-conflict averages in early 2027
- Residual ongoing disruptions of approximately 0.6 mb/d are projected to continue through the end of 2027, even after the primary recovery has occurred
- OECD inventory levels are being drawn toward historically low levels during this period, amplifying price sensitivity to any additional supply-side shock
An important but underappreciated dimension of this scenario is the asymmetry between supply removal and supply restoration. When geopolitical events force production offline, the shutdown can occur within days. Restarting those fields, however, requires weeks to months of careful reservoir management, infrastructure inspection, wellbore integrity testing, and logistics coordination. This asymmetry means that the pace of the 2027 supply recovery could disappoint on timing even if the volume ultimately returns.
EIA Oil Price Trajectory: A Three-Stage Decline Model for 2026 and 2027
The EIA's Brent crude price forecast for this two-year period follows a clearly defined three-stage structure that maps directly onto the underlying supply-demand dynamic. Monitoring crude oil price trends is therefore essential to understanding how these phases will play out for market participants.
-
Elevated Phase (Q2 to Q3 2026): Brent is projected to average approximately $85 per barrel in Q3 2026, representing an $11 per barrel upward revision from the prior month's STEO. This reflects accelerating inventory drawdowns and the persistence of Hormuz-related supply constraints.
-
Transition Phase (Q4 2026): As Hormuz traffic gradually normalises and shut-in production begins restarting, Brent is forecast to soften toward an average of approximately $78 per barrel by Q4 2026.
-
Normalisation Phase (2027): With most shut-in production restored and global inventories rebuilding from Q1 2027 onward, Brent is projected to average approximately $69 per barrel across 2027, with some EIA scenarios pointing to levels as low as $65 per barrel if supply recovery accelerates beyond the central case assumptions.
The implied price decline from the Q3 2026 peak to the 2027 average represents a $16 to $20 per barrel move lower within a roughly 18-month period. For context, this is a trajectory that carries enormous consequences for petrostates whose fiscal breakeven prices cluster in the $70 to $90 per barrel range, including several OPEC+ members who would face significant budgetary pressure at the lower end of the 2027 price range.
How Does a 4.78 mb/d Surplus Compare Historically?
The scale of the projected 2027 supply surplus deserves careful historical contextualisation, because the numbers involved are genuinely unusual by modern standards.
"Historical Calibration: The 2015 to 2016 oil market downturn, which drove Brent from above $100 per barrel to below $30 per barrel at its trough, was partly attributable to a global surplus estimated at between 1.5 and 2.0 mb/d. The EIA's projected 2027 surplus of 4.78 mb/d is more than double that magnitude on an annual average basis, and the quarterly peak of 5.82 mb/d in Q4 2027 exceeds it by a factor of nearly three."
Several structural factors could, however, cause the 2027 surplus to arrive larger or faster than the EIA's central forecast anticipates:
- The International Energy Agency has indicated in parallel analysis that global supply could rebound by approximately 8 mb/d in 2027 following the disruption-driven decline of 2026, a figure consistent with a very large surplus scenario
- Once shut-in fields are reactivated, production tends to temporarily overshoot target rates as operators maximise early recovery to compensate for lost revenue during the outage period
- Demand growth in 2027 at 104.96 mb/d, while meaningful, is unlikely to absorb the full volume of returning supply without significant price adjustment
- The EIA's residual disruption assumption of 0.6 mb/d through end-2027 acts as a partial buffer, but any faster-than-expected Hormuz normalisation would eliminate even this modest offset
In addition, OPEC production decisions will play a significant role in determining how quickly or slowly the 2027 surplus materialises, particularly if member states attempt to coordinate output cuts in response to falling prices.
The next major ASX story will hit our subscribers first
EIA vs. IEA: Where the Two Agencies Converge and Diverge
| Dimension | EIA Forecast | IEA Perspective |
|---|---|---|
| 2026 Market Direction | Deficit (-1.91 mb/d) | Deficit (directionally aligned) |
| 2027 Market Direction | Surplus (+4.78 mb/d) | Surplus (directionally aligned) |
| 2027 Brent Average | ~$69/b | Broadly consistent |
| Supply Recovery Timing | Early 2027 | Early 2027 |
| Residual Disruption | ~0.6 mb/d through end-2027 | Varies by scenario |
| Key Quantitative Divergence | Exact surplus magnitude | Supply rebound scale (~8 mb/d) |
Both agencies share the same directional thesis on the EIA oil crunch in 2026 and glut in 2027. Their quantitative differences reflect distinct methodological approaches to modelling conflict-related production recovery rates, non-OPEC supply growth trajectories, and demand elasticity across developed and emerging economies. Furthermore, OPEC's market influence remains a critical variable that neither agency can fully model with precision, given the cartel's demonstrated willingness to alter output targets in response to market conditions.
Three Scenarios for How 2027 Could Unfold
Scenario A: Base Case (EIA Central Forecast)
- Hormuz disruptions resolve broadly on schedule by early 2027
- Shut-in production returns to near pre-conflict output levels
- 2027 annual surplus averages 4.78 mb/d, Brent averages approximately $69 per barrel
- Inventory rebuilding is orderly and price declines are gradual rather than disorderly
Scenario B: Accelerated Recovery
- Hormuz transit normalises faster than modelled, production restarts ahead of schedule
- 2027 surplus exceeds 5.5 mb/d, Brent could test the $60 to $65 per barrel range
- OPEC+ faces significant internal pressure to coordinate emergency production cuts
- Energy sector capital expenditure plans face downward revision pressure across the board
Scenario C: Prolonged Disruption
- Hormuz constraints extend into Q4 2026 or beyond, shut-in production recovery is delayed
- 2026 deficit deepens further, Q3 2026 Brent could briefly exceed $90 per barrel
- The 2027 surplus arrives later and more compressed, but the price decline is steeper when it comes
- Energy security frameworks for importing nations come under intense policy pressure
Consequently, the trade war impact on oil adds another layer of uncertainty to all three scenarios, as deteriorating US-China relations could suppress demand growth and accelerate the transition into surplus territory.
Strategic Implications Across Market Participants
The two-phase nature of this cycle creates very different risk profiles depending on a participant's position in the supply chain.
For Oil-Producing Nations and Upstream Operators
- The elevated price window in Q2 to Q3 2026 represents a revenue maximisation opportunity, but only for producers with available capacity and logistics access
- Hedging 2027 production at current forward prices becomes increasingly important as the surplus trajectory becomes clearer
- Restart timing decisions for shut-in production carry significant embedded price risk given the steep projected decline beginning Q1 2027
For Energy-Importing Economies and Policymakers
- The 2026 period creates genuine inflation risk through elevated energy import costs, particularly for nations with limited strategic petroleum reserve capacity
- The 2027 surplus window offers a potential opportunity for strategic reserve replenishment at meaningfully lower price levels
- Domestic energy security policy should be reviewed with the 2026 to 2027 volatility corridor in mind
For Investors and Commodity Market Participants
- The front end of the oil futures curve may remain elevated through mid-2026, while the back end increasingly prices in 2027 surplus conditions
- Contango structures in 2027 futures contracts could create storage arbitrage trade opportunities for well-capitalised participants
- Equity valuations for integrated oil majors require balancing near-term revenue strength in 2026 against medium-term margin compression as 2027 approaches
The oil market trade risks associated with broader macroeconomic deterioration further complicate equity valuations in this environment, as demand-side weakness could amplify the downside of the projected 2027 glut.
Understanding What the EIA Actually Measures
A critical and frequently overlooked dimension of interpreting the EIA's STEO data correctly is understanding precisely what the agency includes in its production and consumption totals.
The EIA's world liquids production figures encompass:
- Crude oil and lease condensate
- Natural gas plant liquids (NGPLs)
- Other liquids, including biofuels and synthetic crude
- Refinery processing gain
- Other unaccounted-for liquids
The agency also notes that differences in how individual countries report historical production data can introduce inconsistencies in how crude oil is distinguished from other liquid fuels. These definitional boundaries matter when comparing EIA figures with data published by national oil companies or other international agencies, and they can affect the precision of calculated surplus and deficit figures.
On the consumption side, the EIA defines OECD consumption as petroleum product supplied, using the definition from the EIA Petroleum Supply Monthly glossary. Non-OECD consumption uses apparent consumption, which incorporates internal consumption, refinery fuel and loss, and marine bunkering. This methodological difference means global consumption aggregates carry a degree of statistical uncertainty, particularly for rapidly growing non-OECD markets where data quality and reporting frequency vary considerably.
The EIA completed all modelling and analysis underpinning its August 2026 STEO on August 6, 2026. Any developments after that date, including further escalation or de-escalation of Hormuz disruptions, are not reflected in the published figures.
The Bigger Picture: Oil Market Fragility in the Chokepoint Era
The EIA oil crunch in 2026 and glut in 2027 forecast is not simply a supply-demand accounting outcome. It exposes something more fundamental about the structural fragility of global oil markets in a period of elevated geopolitical risk.
Modern oil markets are extraordinarily efficient under stable conditions, with price signals, logistics networks, and inventory systems that can rebalance supply and demand imbalances within months. However, that efficiency depends on the uninterrupted function of a handful of critical maritime chokepoints, of which the Strait of Hormuz is the most consequential. When those chokepoints are compromised, the entire system's assumption of continuous supply flow breaks down, inventory buffers erode rapidly, and price volatility accelerates beyond what derivatives markets can reliably hedge.
The fact that a market swing of nearly 6.7 mb/d between the tightest and loosest balance points can occur within 24 months is a data point that should inform not just commodity trading strategies, but long-term energy infrastructure investment, national security policy, and the risk frameworks that govern capital allocation across the entire energy sector.
"Disclaimer: This article incorporates forecasts and projections derived from the EIA's August 2026 Short-Term Energy Outlook and is intended for informational purposes only. Energy market forecasts are inherently subject to significant uncertainty, and actual outcomes may differ materially from the scenarios described. Nothing in this article constitutes financial, investment, or trading advice. Readers should conduct their own independent research and consult qualified advisors before making any investment decisions."
Want to Stay Ahead of the Next Major Resource Discovery Driving Market Volatility?
While oil market cycles and geopolitical supply shocks reshape commodity valuations, Discovery Alert's proprietary Discovery IQ model scans ASX announcements in real time, instantly identifying significant mineral discoveries with the potential to deliver extraordinary returns — as demonstrated by historic finds from De Grey Mining and WA1 Resources. Begin your 14-day free trial at Discovery Alert today, or explore the dedicated discoveries page to understand how major resource discoveries have historically generated substantial market-leading gains.