
July 23, 2026
The STEO as a Market Signal: Why Monthly EIA Revisions Move Energy Markets
Every month, energy traders, upstream executives, and portfolio managers refresh their models the moment the U.S. Energy Information Administration publishes its Short-Term Energy Outlook. The STEO is not simply a government data release — it functions as a real-time calibration mechanism for global oil supply expectations. When the EIA raises U.S. oil production forecast figures, even by margins that appear modest on a per-barrel basis, the compounding effect across quarterly and annual supply balances can meaningfully shift market positioning.
The June 2026 STEO is a case in point. The upward revision to both the 2026 and 2027 U.S. crude oil production projections was relatively contained in absolute terms, yet it arrived at a moment when the market is navigating a complex intersection of rising price expectations, OPEC output decisions, and structurally improving shale basin productivity. Understanding what the numbers mean — and what they do not yet capture — requires more than a headline read.
When big ASX news breaks, our subscribers know first
What the EIA's June 2026 STEO Actually Projects
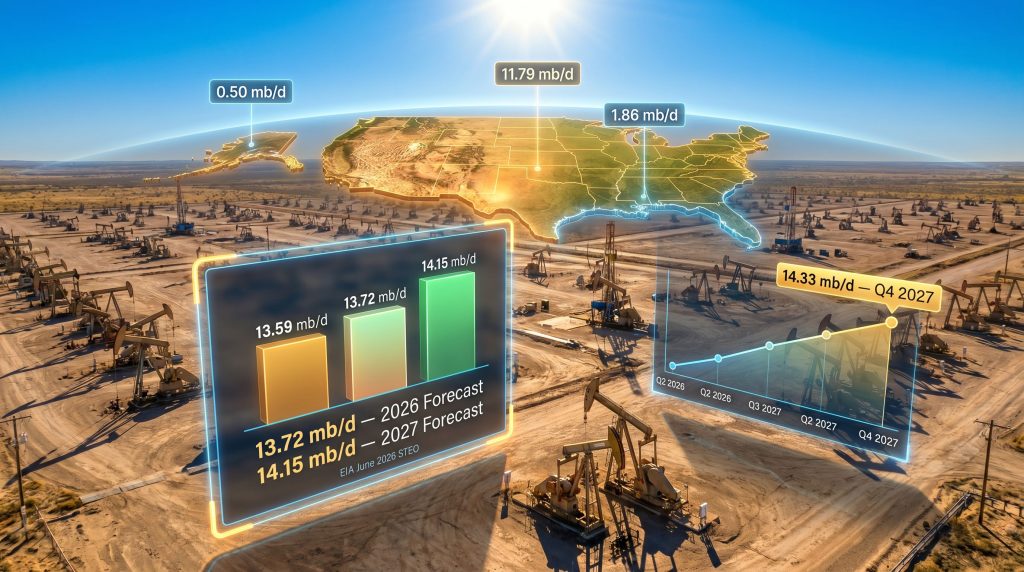
The EIA's June 2026 Short-Term Energy Outlook projects U.S. crude oil production, inclusive of lease condensate, to average 13.72 million barrels per day (mb/d) across the full year 2026. For 2027, the projection rises to 14.15 mb/d. Both figures represent upward revisions from the May 2026 STEO, which had estimated 13.65 mb/d for 2026 and 14.10 mb/d for 2027.
Lease condensate is worth clarifying for those less familiar with upstream accounting. It refers to light liquid hydrocarbons recovered at the wellhead from gas streams, and its inclusion in headline crude figures means the total encompasses a broader spectrum of liquid production than conventional crude alone. This distinction matters when comparing U.S. figures against OPEC benchmarks, which use varying definitional standards.
Forecast Revision Summary: May vs. June 2026 STEO
| Forecast Period | May 2026 STEO (mb/d) | June 2026 STEO (mb/d) | Revision (mb/d) |
|---|---|---|---|
| Full Year 2026 | 13.65 | 13.72 | +0.07 |
| Full Year 2027 | 14.10 | 14.15 | +0.05 |
| 2025 Actual Average | — | 13.59 | Baseline |
The EIA directly attributed the upward revision to rising crude oil price expectations embedded in its macroeconomic assumptions. The June STEO projects Brent spot prices to average $95.39 per barrel in 2026, a substantial lift from the $69.04 per barrel average recorded in 2025. WTI is projected to average $88.32 per barrel in 2026, up from $65.40 per barrel in 2025 — a year-on-year increase of approximately 35%.
Projected Price Trajectory: Brent and WTI
| Benchmark | 2025 Average | 2026 Forecast | Change |
|---|---|---|---|
| Brent Spot Price | $69.04/bbl | $95.39/bbl | +$26.35 (+38%) |
| WTI Spot Price | $65.40/bbl | $88.32/bbl | +$22.92 (+35%) |
These price assumptions are not trivial. They are the load-bearing pillar beneath the entire production growth narrative. Furthermore, if Brent prices fail to sustain levels near $95/bbl — whether due to demand softness, OPEC+ supply acceleration, or macroeconomic deterioration — the production growth embedded in the 2027 forecast becomes vulnerable to sequential downward revision in subsequent STEOs. Broader oil price volatility remains a persistent risk for any scenario built on sustained high prices.
The Quarterly Production Ramp: Reading the Growth Curve
Annualised forecast figures can obscure the underlying momentum within a production trajectory. The quarterly breakdown from the June STEO tells a more granular story — one of consistent, compounding growth across an eight-quarter horizon.
Quarterly U.S. Crude Oil Production Projections
| Quarter | Projected Output (mb/d) |
|---|---|
| Q2 2026 | 13.73 |
| Q3 2026 | 13.77 |
| Q4 2026 | 13.83 |
| Q1 2027 | 13.94 |
| Q2 2027 | 14.15 |
| Q3 2027 | 14.18 |
| Q4 2027 | 14.33 |
The trajectory is notable for what it does not show: any meaningful deceleration. Quarter-on-quarter increments remain positive and relatively stable throughout the forecast window. The Q4 2027 projection of 14.33 mb/d represents a +0.60 mb/d increase from the Q2 2026 starting point — the equivalent of adding a mid-sized OPEC member's entire output over roughly 18 months.
The compression between growth milestones suggests U.S. upstream capacity is not approaching a near-term ceiling. Operational efficiency improvements in onshore shale basins — including longer lateral lengths, enhanced completion techniques, and multi-well pad drilling — are sustaining output gains without a proportional increase in rig count activity.
Is the United States Moving Into Uncharted Production Territory?
The significance of the 14 mb/d threshold cannot be overstated from a historical perspective. According to EIA historical production data updated through May 2026 and covering production records from 1859 onward, U.S. crude oil output has never averaged 14 mb/d on either a monthly or annual basis. The forecasted 2027 annual average of 14.15 mb/d would represent a genuinely unprecedented production level in American energy history.
The progression toward this threshold has been remarkably rapid:
- 2024: Annual average of 13.235 mb/d — the first year on record to average 13 mb/d annually
- 2025: Annual average of 13.586 mb/d — the highest annual production figure ever recorded as of May 2026 data
- 2027 Forecast: Annual average of 14.15 mb/d — a new all-time record if achieved
Monthly data adds further texture. EIA monthly production records covering January 1920 through March 2026 reveal that the single highest monthly average ever recorded was October 2025 at 13.864 mb/d, followed by September 2025 at 13.828 mb/d and August 2025 at 13.810 mb/d. All three of the top-ranked monthly production figures in American history were achieved within a single three-month period in 2025.
Top Monthly U.S. Crude Oil Production Records
| Rank | Month | Monthly Average (mb/d) |
|---|---|---|
| 1st | October 2025 | 13.864 |
| 2nd | September 2025 | 13.828 |
| 3rd | August 2025 | 13.810 |
Monthly output has surpassed the 13 mb/d mark on 30 separate occasions across all available historical data. The distribution by year illustrates how rapidly this threshold has become routine:
- 2023: 4 months above 13 mb/d
- 2024: 11 months above 13 mb/d
- 2025: 12 months above 13 mb/d
- 2026 (through March): 3 months above 13 mb/d
The acceleration from 4 qualifying months in 2023 to 12 in 2025 is not coincidental. It reflects a structural deepening of Permian Basin productivity, the maturation of secondary shale plays, and the sustained application of capital toward high-return tight oil development.
Regional Breakdown: Which Basins Are Doing the Heavy Lifting?
Regional Contribution: 2025 Actuals vs. 2026 and 2027 Projections
| Region | 2025 Actual (mb/d) | 2026 Forecast (mb/d) | 2027 Forecast (mb/d) |
|---|---|---|---|
| Lower 48 (ex. Gulf of America) | 11.27 | 11.30 | 11.79 |
| Federal Gulf of America | 1.90 | 1.98 | 1.86 |
| Alaska | 0.42 | 0.45 | 0.50 |
| Total U.S. | 13.59 | 13.72 | 14.15 |
Lower 48 States: The Structural Engine
The onshore Lower 48 basins, anchored by the Permian in West Texas and New Mexico, are responsible for the majority of projected production growth. Output from this region is forecast to climb from 11.27 mb/d in 2025 to 11.79 mb/d in 2027, a gain of +0.52 mb/d that accounts for nearly the entire net increase in U.S. production over the period.
What makes this growth particularly significant from an industry standpoint is the efficiency dynamic underpinning it. However, concerns around the U.S. shale drilling slowdown remain relevant context, as shale producers have demonstrated an ability to grow output without proportional rig additions, largely through:
- Extended horizontal lateral lengths, with some Permian laterals now exceeding 15,000 feet
- Higher-intensity hydraulic fracturing using increased proppant volumes
- Optimised well spacing and multi-well pad development
- Faster drilling cycles driven by automation and real-time data analytics
This productivity per rig improvement has effectively lowered the breakeven cost for incremental barrels, making U.S. shale more resilient to moderate price pullbacks than it was during earlier boom-bust cycles.
Gulf of America: Deepwater's Near-Term Headwinds
The Federal Gulf of America presents a counterpoint to the onshore growth story. After rising from 1.90 mb/d in 2025 to a projected 1.98 mb/d in 2026, Gulf output is expected to pull back to 1.86 mb/d in 2027 — a decline of -0.12 mb/d year-on-year.
This trajectory reflects the inherent nature of deepwater asset management. Natural depletion rates on mature Gulf platforms are steep, and new project sanctioning timelines — typically spanning five to eight years from discovery to first oil — mean that near-term production profiles are largely locked in years before the forecast window begins.
Alaska: Incremental Upside With Structural Constraints
Alaska's projected increase from 0.42 mb/d in 2025 to 0.50 mb/d in 2027 represents a nearly 19% uplift over two years. While modest in absolute volume relative to the Lower 48, Alaskan production growth carries strategic value given the state's high-quality crude grades and established export infrastructure.
Seasonal production cycles and the infrastructure intensity of North Slope operations impose a natural ceiling on near-term growth. Legacy fields including Prudhoe Bay continue to decline from their peak volumes, making any incremental growth dependent on new development activity and sustained investment in ageing pipeline and processing infrastructure.
The Price-Production Feedback Loop: A Built-In Tension
The EIA's simultaneous forecast of rising prices and rising production contains an internal tension that energy market participants should not overlook. Higher crude prices incentivise U.S. producers to accelerate drilling programmes, bring drilled but uncompleted (DUC) wells into production, and expand capacity — all of which increase supply. However, that supply increase, if it materialises at scale, exerts downward pressure on the very prices driving the investment decision.
The typical lag between a price signal and measurable onshore production response runs three to nine months for tight oil operations, where well cycle times are short and capital can be deployed or withdrawn relatively quickly. Deepwater and conventional plays operate on much longer response cycles, often exceeding several years.
If U.S. production reaches the upper end of the EIA's 2027 projections while global demand growth remains subdued, the resulting supply surplus could compress price forecasts in subsequent STEO releases — creating a self-correcting dynamic that recalibrates production incentives downward. Investors should treat the $95/bbl Brent assumption as a scenario input rather than a guaranteed outcome.
Several external variables could accelerate or undercut this feedback loop:
- OPEC+ production discipline: Any significant reversal of output cuts by OPEC+ members would add volumes to global markets simultaneously with rising U.S. production, amplifying downward price pressure
- Global demand trajectory: Slower-than-expected economic growth in China, the EU, or emerging markets could suppress petroleum demand and cap price appreciation
- Electric vehicle adoption curves: Accelerating EV penetration in major consuming economies compresses long-run petroleum demand forecasts, even if near-term consumption remains robust
- Geopolitical supply disruptions: Conversely, supply outages in major producing regions could create price spikes that validate or exceed the EIA's price assumptions
The next major ASX story will hit our subscribers first
What Rising U.S. Output Means for Global Supply Balances and Investors
An additional ~0.56 mb/d of U.S. crude production between 2025 and 2027 is not an isolated data point — it reshapes the architecture of global supply balances. Non-OPEC supply growth, led by the United States, has historically been the primary counterweight to OPEC's market influence over price outcomes. As U.S. output climbs toward and potentially through the 14 mb/d threshold, OPEC's effective market share erodes further, reducing the cartel's leverage.
For investors and capital allocators, the implications span multiple asset classes and strategic considerations:
- Upstream equity exposure: Upward EIA production revisions tend to be interpreted as bullish signals for U.S. shale producers in the near term, validating their capital programmes and production guidance
- Hedging strategy complexity: Producers operating in a rising-price, rising-supply environment face a nuanced hedging calculus — locking in prices too aggressively limits upside if Brent sustains near $95/bbl, while under-hedging creates downside exposure if prices correct
- Refining and midstream implications: Higher crude volumes flowing through the Lower 48 system create throughput tailwinds for midstream operators and Gulf Coast refiners oriented toward export
- Macro demand-side risks: Any institutional thesis built on the EIA's 2027 production assumptions inheriting the full price uplift should be stress-tested against demand destruction scenarios
In addition, the trade war impact on oil markets adds another layer of uncertainty, particularly given the sensitivity of global demand forecasts to shifts in trade policy. The EIA publishes its Short-Term Energy Outlook on a monthly basis, and revisions in both directions are common. Market participants should treat each release as a data point in an evolving probabilistic range rather than a definitive production blueprint.
Frequently Asked Questions: EIA Raises U.S. Oil Production Forecast
What is the EIA's current U.S. oil production forecast for 2026?
The EIA's June 2026 STEO projects U.S. crude oil production, including lease condensate, to average 13.72 mb/d in 2026, revised upward from 13.65 mb/d in the May 2026 STEO.
Has the U.S. ever produced 14 million barrels of oil per day?
No. Through March 2026, U.S. crude oil output has never averaged 14 mb/d on either a monthly or annual basis. The EIA raises U.S. oil production forecast to 14.15 mb/d for 2027, which would be historically unprecedented if achieved.
What is driving the upward revision to U.S. oil production forecasts?
The EIA attributes the revision primarily to rising crude oil price expectations. The June STEO projects Brent prices to average $95.39/bbl in 2026, up from $69.04/bbl in 2025, which incentivises producers to accelerate drilling and well completion activity.
Which U.S. region is the primary driver of production growth?
The Lower 48 states (excluding the Gulf of America) dominate the growth outlook, with output projected to rise from 11.27 mb/d in 2025 to 11.79 mb/d in 2027, accounting for the majority of total U.S. production growth over the period.
What was the highest monthly U.S. crude oil production ever recorded?
Based on EIA data updated through May 2026, the record was set in October 2025 at 13.864 mb/d, narrowly ahead of September and August 2025 — all three representing new historical highs achieved within the same quarter.
How often does the EIA revise its production forecasts?
The EIA publishes the STEO monthly, incorporating updated production data, price movements, and demand indicators with each release. Revisions in both directions are routine and reflect the inherent uncertainty in forecasting a dynamic, price-sensitive system.
Disclaimer: This article is for informational purposes only and does not constitute financial or investment advice. Production forecasts, price projections, and market analysis referenced herein are subject to revision and carry inherent uncertainty. Readers should conduct independent research before making any investment decisions related to energy markets or commodities.
Want to Capitalise on the Next Major Mineral Discovery Before the Broader Market Reacts?
While U.S. oil production charts new historical territory, significant mineral discovery opportunities continue to emerge daily on the ASX — and Discovery Alert's proprietary Discovery IQ model delivers real-time alerts the moment they are announced, turning complex data across more than 30 commodities into clear, actionable insights. Explore historic discoveries and their returns to understand the potential at stake, then begin your 14-day free trial at Discovery Alert to position yourself ahead of the market.