July 30, 2026
When Capital Discipline Becomes a Competitive Weapon in Gold Mining
The gold mining sector has long wrestled with a fundamental tension: the urge to deploy capital aggressively into new projects versus the discipline required to return meaningful value to the investors who funded those projects in the first place. For much of the industry's history, production growth consumed cash flow at the expense of shareholder returns. That calculus is shifting, and the mid-tier gold producer segment is where this transformation is most visible.
Against a backdrop of gold prices sustaining above $3,000 per ounce, producers with low-cost, high-margin operations are generating cash at rates that would have seemed extraordinary just a few years ago. The gold price outlook for investors is no longer simply about which company is producing the most gold, but which company is converting production into durable, compounding shareholder value. Endeavour Mining first-half free cash flow and shareholder returns results for 2026 offer a compelling case study in what that transformation looks like in practice.
When big ASX news breaks, our subscribers know first
Understanding the Financial Architecture Behind the Record Numbers
What $761 Million in Free Cash Flow Actually Represents
Free cash flow is widely cited but frequently misunderstood in the mining sector. It is not simply revenue minus costs. For a capital-intensive business operating across multiple jurisdictions in West Africa, free cash flow reflects the residual cash generated after sustaining capital expenditure, royalties, taxes, and all operating costs have been settled. When a producer generates $761 million in free cash flow across a single half-year period, it signals something structurally significant about the underlying economics of the asset base.
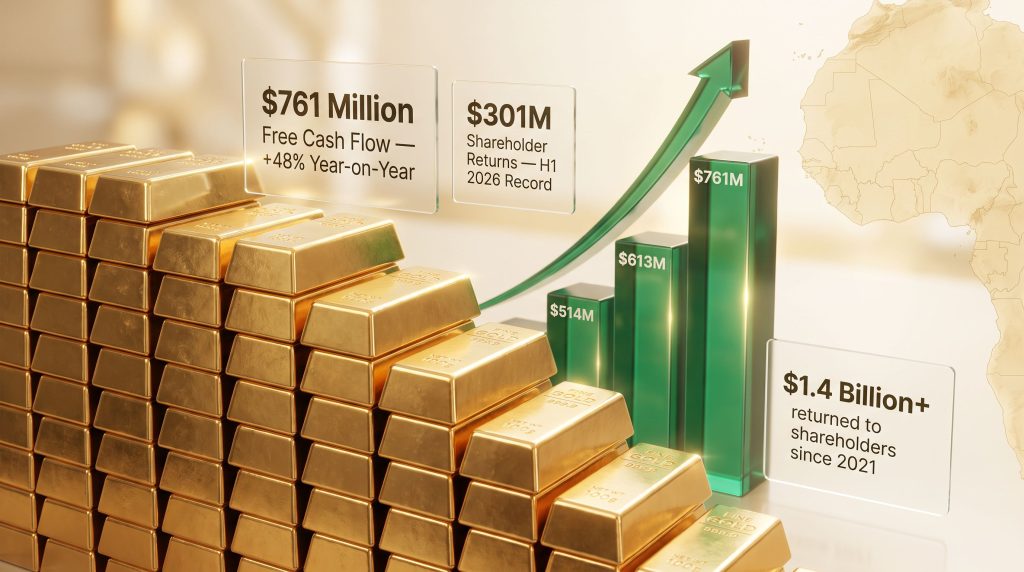
That figure represents a 48% increase compared to the $514 million recorded in H1 2025, establishing a new internal record for the company. Critically, this is not an isolated data point. The progression from H1 2025 through to H1 2026 reflects a multi-period acceleration in cash generation capacity, supported by both a favourable gold price environment and disciplined cost control across the portfolio.
H1 2026 Financial Performance at a Glance
| Financial Metric | H1 2026 Result | Year-on-Year Change |
|---|---|---|
| Free Cash Flow | $761 million | +48% |
| Adjusted EBITDA | $1.61 billion | +38% |
| Net Cash Position (end Q2) | $254 million | Positive territory |
| Total Shareholder Returns | $301 million | >2x minimum commitment |
| Dividend Component | $230 million | Record high |
| Share Buyback Component | $71 million | Supplemental return |
| Gold Produced | 564,000 oz | On full-year guidance |
| All-In Sustaining Cost (AISC) | $1,871/oz | Strong margin vs. spot |
Period-on-Period Comparison
| Period | Free Cash Flow | Shareholder Returns | Dividend | Buybacks |
|---|---|---|---|---|
| H1 2025 | $514 million | $219 million | $150 million | $69 million |
| H1 2026 | $761 million | $301 million | $230 million | $71 million |
| FY 2025 (full year) | N/A | $435.3 million | N/A | N/A |
The jump of $247 million in free cash flow within a single 12-month interval is particularly notable when contextualised against the mining cost environment. AISC of $1,871 per ounce against a gold price that has consistently traded above $3,000 per ounce implies a gross operating margin exceeding $1,200 per ounce at prevailing prices. With 564,000 ounces produced in H1 2026, the aggregate margin contribution from operations is substantial.
What Is Driving the Cash Flow Acceleration?
Gold Price Tailwinds and Operational Leverage
Gold price strength is the most visible driver, but it does not tell the complete story. Many gold producers with similarly favourable price exposure have failed to convert spot price gains into proportionate free cash flow improvements, often due to cost inflation, capital overruns, or operational disruptions. Furthermore, the ability to expand EBITDA margins by 38% year-on-year while maintaining production on guidance reflects a degree of operational leverage that distinguishes high-quality mid-tier operators from their peers.
"In gold mining, the gap between headline revenue and actual cash conversion is where management quality is truly revealed. Cost discipline in a high-price environment is far more revealing than cost control when margins are thin."
Key factors underpinning the cash flow acceleration include:
- Gold prices sustained above $3,000 per ounce, materially expanding per-ounce operating margins
- AISC of $1,871/oz delivering implied cash margins of over $1,200/oz at prevailing gold prices
- Production of 564,000 oz maintained on track for full-year guidance
- Adjusted EBITDA of $1.61 billion reflecting disciplined cost management at the asset level
- A net cash position of $254 million at end-Q2 2026, reflecting balance sheet strength without over-leveraging
Why Q4 Production Weighting Is a Double-Edged Signal
One of the less-discussed aspects of the H1 2026 results is the company's stated full-year production profile, which is weighted toward the fourth quarter. In the gold mining industry, Q4 weighting typically reflects the ramp-up timelines of expansion projects and underground development programmes rather than seasonal operational patterns. For Endeavour, this weighting is directly tied to the Sabodala-Massawa underground expansion, which is targeting first ore delivery by year-end 2026.
For investors, Q4 production concentration introduces a specific risk-reward dynamic:
- Upside scenario: Underground ramp-up proceeds on schedule, H2 production significantly exceeds H1, and full-year guidance is met or exceeded with strong Q4 cash generation
- Base case: Ramp-up progresses broadly on schedule with minor timing slippage, full-year guidance achieved within the stated range
- Risk scenario: Underground development encounters geological or infrastructure complexity, delaying first ore beyond December 2026 and compressing Q4 output
Understanding this production profile is essential context when evaluating full-year cash flow projections, as H1 numbers alone may not fully represent the annual run-rate potential.
How the Shareholder Return Framework Works
A Tiered Architecture Built for Institutional Investors
The return framework Endeavour has constructed is more sophisticated than a simple dividend policy. Rather than committing to a fixed payout ratio or an arbitrary yield target, the company has established a floor-and-supplement architecture that provides baseline income certainty while linking additional returns to gold price performance above a defined threshold.
The structure operates as follows:
- A minimum $1 billion in dividends is committed across the 2026 to 2028 period, providing a predictable income floor regardless of short-term gold price volatility
- When the gold price exceeds $3,000 per ounce, this minimum commitment is supplemented by additional dividends and share buybacks, creating a variable upside layer
- Share buybacks serve as a tax-efficient complement to cash dividends, offering return optionality for different investor constituencies
This tiered design has an important psychological function for institutional capital. Income-oriented mandates can model the minimum commitment as a quasi-contractual baseline, while growth-oriented funds can assign probability-weighted value to the supplemental layer based on their gold price outlook. Consequently, the framework appeals to a broader spectrum of institutional investors than a conventional fixed-dividend policy would.
H1 2026 Returns Exceed Proportional Commitment by More Than 2x
The $301 million distributed in H1 2026 represents more than double the proportional allocation implied by the three-year minimum commitment. According to Endeavour's strong Q1 2026 results, the company has demonstrated a clear pattern of exceeding stated minimums. Decomposed into its components:
- The $230 million dividend represents the highest single-period dividend in the company's history
- The $71 million in share buybacks complements the dividend, reducing share count and concentrating future earnings per share
- Combined, the H1 2026 return of $301 million compares to $219 million in H1 2025, a 37% year-on-year increase
"Consistent over-delivery against stated minimum commitments is one of the most effective tools available to management for compressing the discount rate that markets apply to a company's future cash flows. Each successive over-delivery reduces investor uncertainty and builds credibility in the return framework."
Since the company initiated shareholder returns in 2021, cumulative distributions have surpassed $1.4 billion, exceeding stated minimum commitments by more than 80% over that period. The broader picture of gold equities performance across the sector further contextualises just how exceptional this track record has become relative to peers.
Growth Catalysts Embedded in the Results
The Assafou Project: Final Investment Decision by Year-End 2026
Among the growth catalysts embedded in the H1 2026 operational update, the Assafou project stands out as the most significant for long-term net asset value. The project is described internally as a top-tier asset, and a Final Investment Decision (FID) is targeted by end-2026. FID is the formal capital commitment threshold in the mining industry, beyond which project development funding is fully sanctioned and construction timelines become binding. In many respects, the process mirrors what happens in a definitive feasibility study phase, where project economics are rigorously stress-tested before capital is fully committed.
Four workstreams are progressing in parallel ahead of FID:
- Mining convention negotiations with the host government, representing the regulatory and fiscal framework that underpins project economics
- Project infrastructure development, covering the physical logistics and construction preparation
- Relocation action plan execution, addressing community resettlement requirements under international mining standards
- Early works commencement, allowing preliminary site preparation to advance ahead of full FID approval
The mining convention negotiation workstream warrants specific attention. In West African jurisdictions, the terms of a mining convention govern royalty rates, tax treatment, repatriation rights, and local content obligations for the life of mine. These terms can materially influence project-level free cash flow and, by extension, the return on invested capital that Assafou will ultimately deliver. Progress across all four workstreams simultaneously suggests management is attempting to compress the pre-FID timeline as much as possible.
Sabodala-Massawa Underground: A Near-Term Production Catalyst
The Sabodala-Massawa underground expansion is positioned as the more immediate production catalyst within the 2026 operational calendar. Infrastructure development is actively underway, and the project remains on schedule for launch in H2 2026 with first ore targeted by year-end.
Underground mining at Sabodala-Massawa introduces additional technical complexity compared to the existing open-pit operations. Transitioning from surface to underground mining typically involves:
- Development of decline infrastructure to access ore at depth
- Installation of ventilation, dewatering, and ground support systems
- Sequencing of stope development to maintain continuous ore feed to the processing plant
- Grade reconciliation between resource models and actual ore recovery, which can vary during early underground ramp-up
This last point is particularly relevant for investors modelling H2 production expectations. Underground ramp-up grades in the early stoping phases can sometimes differ from resource model predictions, particularly in structurally complex deposits. Monitoring grade performance against the resource model during initial underground production will be a key indicator of the expansion's trajectory.
Exploration Pipeline: Vindaloo Deeps and Kawsara Resource Updates
Beyond the two primary growth catalysts, the exploration pipeline provides organic resource growth optionality without requiring greenfield capital deployment. Significant resource updates at both the Vindaloo Deeps and Kawsara discoveries are expected in H2 2026. Resource updates at the drill-defined stage represent a relatively low-cost mechanism for expanding the mineral inventory available for mine planning, and in favourable gold price environments, the incremental value assigned to resource additions tends to be amplified.
Key Risks Investors Should Monitor
Operational Execution Risk
The concentration of production in Q4 amplifies the consequences of any operational disruption in H2 2026. Key execution risks include:
- Delays to Sabodala-Massawa underground first ore beyond December 2026
- Grade variability during initial underground ramp-up affecting production reconciliation
- Cost inflation in the West African operating environment, particularly for fuel, reagents, and labour
- Logistical complexity associated with simultaneous development of multiple workstreams
Gold Price Sensitivity
The supplemental return mechanism is explicitly contingent on gold prices remaining above $3,000 per ounce. A sustained price correction below this threshold would revert distributions to the minimum commitment floor. While the $1,871/oz AISC provides a substantial margin buffer against cost coverage risk, the incremental shareholder returns that have driven recent performance metrics are directly exposed to gold price movements.
Regulatory and Sovereign Risk
Mining convention negotiations for the Assafou project represent a variable outside management's direct control. The outcome of these negotiations will define the fiscal terms under which the project operates for potentially decades. Any deterioration in negotiating conditions, changes in government priorities, or delays in convention finalisation could push the FID timeline beyond 2026 and defer the long-term production growth that the market is beginning to factor into valuation.
The next major ASX story will hit our subscribers first
What H1 2026 Results Reveal About the Long-Term Investment Thesis
Three Structural Pillars Supporting the Investment Case
Synthesising the H1 2026 results through an investment framework lens, three structural pillars emerge that underpin the long-term thesis:
- Demonstrated cash conversion capacity: The ability to translate gold price strength into record free cash flow through operational discipline represents a repeatable quality, not an opportunistic outcome
- Return commitment credibility: The consistent pattern of distributing materially above the stated minimum commitment builds institutional trust and narrows the gap between intrinsic value and market price
- Organic growth optionality: Both Assafou FID and Sabodala-Massawa underground expansion are funded from operating cash flow, avoiding dilutive equity raises or balance sheet strain
In addition, the broader context of gold M&A activity across the sector suggests that mid-tier producers with demonstrated cash generation capacity are increasingly attractive targets, adding a further dimension to the investment thesis for patient shareholders.
Key Metrics to Watch in H2 2026
Investors monitoring Endeavour's trajectory through the second half of the year should track the following closely:
- Confirmation of Sabodala-Massawa first ore delivery timeline and initial grade performance
- Progress updates on Assafou FID prerequisites, particularly mining convention status
- H2 2026 exploration results from Vindaloo Deeps and Kawsara
- Q4 production delivery against the full-year guidance range
- Gold price trajectory relative to the $3,000/oz supplemental return trigger
- Any cost guidance revisions reflecting H2 operating cost pressures
The company's leadership has described the combination of its operating outlook, cash generation capacity, and capital allocation philosophy as the foundation for sustained organic growth and value creation for all stakeholders. For investors evaluating the mid-tier gold producer landscape — particularly those who have identified undervalued gold stocks in the current environment — the structure, consistency, and scale of Endeavour Mining first-half free cash flow and shareholder returns performance in 2026 represent a benchmark against which peer performance is increasingly being measured. Furthermore, the company's record free cash flow generation has established a new standard for capital discipline in the mid-tier gold sector.
Disclaimer: This article is intended for informational purposes only and does not constitute financial advice. Past performance, including historical cash flow generation and shareholder return delivery, is not necessarily indicative of future results. Investors should conduct their own due diligence and consult a qualified financial adviser before making investment decisions. Forward-looking statements including production guidance, project timelines, and return commitments are subject to material risks and uncertainties including gold price volatility, regulatory developments, and operational execution risk.
Want to Identify the Next Major ASX Mineral Discovery Before the Broader Market Does?
Discovery Alert's proprietary Discovery IQ model delivers real-time alerts on significant ASX mineral discoveries, transforming complex geological data into actionable investment insights for both short-term traders and long-term investors — explore the historic returns major discoveries have generated and begin your 14-day free trial today to secure a market-leading edge.