
June 30, 2026
Energy market fundamentals during periods of regional instability operate through complex mechanisms that extend far beyond basic supply-demand equations. Global petroleum pricing responds to geopolitical tensions through multiple transmission channels including risk premium integration, transportation route security assessments, and strategic inventory calculations. These interconnected factors create cascading effects throughout worldwide energy markets, fundamentally altering pricing structures and market behaviour patterns.
Current market conditions demonstrate these mechanisms in action, with recent data showing dramatic volatility patterns. WTI crude oil has reached $87.55 per barrel, representing significant movement from baseline levels, while Brent crude trades at $87.80 per barrel. More striking still, premium crude grades like Louisiana Light have surged to $99.27 per barrel, highlighting the differential impacts on various petroleum benchmarks during crisis periods.
The Iran war impact on oil prices has manifested through immediate physical disruption and psychological market effects. Maritime traffic through critical chokepoints has collapsed, with vessel movements declining from 138 ships daily to just 2 vessels, representing a 98% reduction in normal traffic flows. This dramatic decrease validates theoretical models predicting severe supply chain bottlenecks during Middle Eastern conflicts.
Key Market Response Mechanisms:
- Futures contract repricing reflecting updated risk assessments
- Bid-ask spread widening indicating heightened uncertainty levels
- Trading volume increases as portfolio managers adjust positions
- Currency fluctuations affecting oil-denominated transaction costs
Strategic Chokepoint Analysis: Beyond Simple Geography
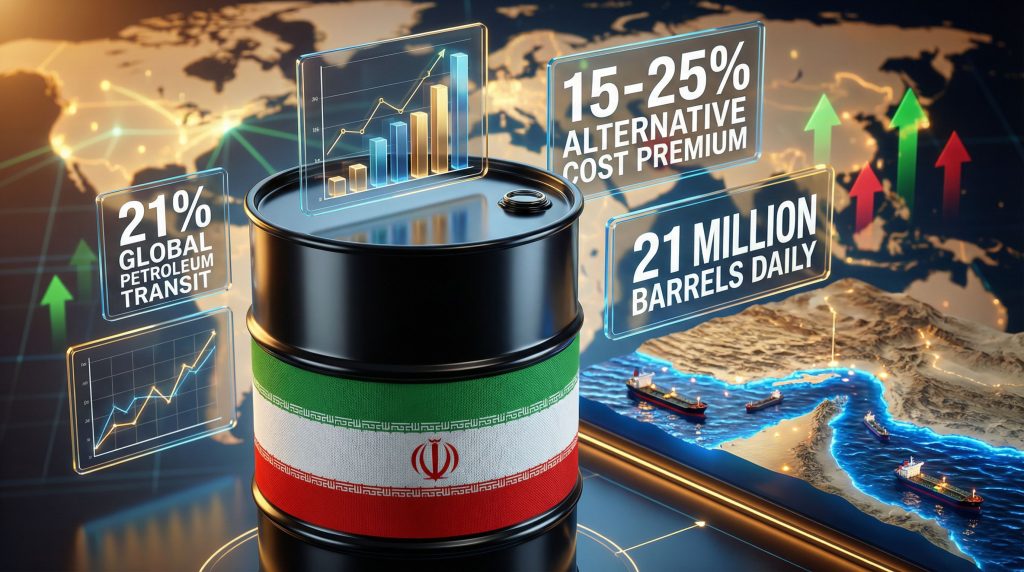
The narrow maritime passage connecting Persian Gulf production to global markets represents more than a geographical bottleneck. This 21-nautical-mile-wide strait constrains vessel movements through specific technical limitations including shallow water restrictions, strong tidal currents, and mandatory vessel separation protocols. The economic sensitivity extends beyond immediate supply disruptions to encompass insurance market dysfunction and inventory management chaos.
Current crisis conditions reveal the true vulnerability of global energy infrastructure. With approximately 21% of global petroleum liquids typically transiting this route, the near-complete shutdown has triggered emergency responses across multiple sectors. Gulf producers have slashed oil output by 5 million barrels per day, demonstrating how chokepoint disruptions translate directly into production reductions among major suppliers.
Furthermore, these developments align with broader oil price movements that reflect heightened geopolitical tensions. Alternative routing mechanisms face severe constraints during crisis periods. The primary alternative route around the Cape of Good Hope adds approximately 2,000 nautical miles to typical voyages, extending transit times by 10-15 days under optimal conditions. However, insurance market disruptions have made even alternative routing economically impractical, with coverage costs increasing 300-500% above baseline levels.
Alternative Route Logistics Challenges:
- Enhanced security measures and crew rotation requirements
- Limited bunkering infrastructure along extended routes
- Exposure to southern hemisphere weather pattern variations
- Elevated piracy risks through Mozambique Channel waters
Storage and inventory dynamics have reached critical thresholds. Reports indicate record volumes of sanctioned oil accumulating on tankers offshore China, representing failed supply chain execution on a massive scale. This floating storage phenomenon creates secondary market pressures as vessels become unavailable for normal commercial operations.
When big ASX news breaks, our subscribers know first
Market Shock Absorption: Three-Phase Response Framework
Energy markets exhibit predictable response patterns during geopolitical crises, operating through distinct phases with characteristic duration and price movement ranges. The initial shock phase sees rapid price increases as traders incorporate risk premiums, typically lasting 24-72 hours with price movements of 15-30%. Recent developments have exceeded these historical ranges, with oil prices climbing 21% in weekly trading cycles as tensions escalated.
Assessment phases follow initial shock periods, characterised by market attempts to distinguish between perceived threats and actual supply disruptions. This stabilisation period typically extends 1-2 weeks with volatility patterns of ±10% as market participants analyse developing situations. Current conditions show extended assessment periods due to rapidly changing geopolitical developments and conflicting diplomatic signals.
In addition, the current scenario differs from previous patterns that led to an oil price rally driven by trade policies. Adjustment phases represent market normalisation as alternative supply sources activate or diplomatic solutions emerge. Historical patterns suggest 2-8 week timeframes for gradual price normalisation, though current crisis conditions indicate significantly extended adjustment periods due to infrastructure damage and persistent security concerns.
Regional Price Differentiation Analysis:
| Crude Grade | Current Price | Weekly Change | Regional Premium |
|---|---|---|---|
| WTI Crude | $87.55 | +4.91% | Baseline |
| Louisiana Light | $99.27 | +16.95% | +13.4% |
| Mars Crude | $105.70 | -6.00% | +20.7% |
| OPEC Basket | $96.40 | +6.99% | +10.1% |
Different crude benchmarks demonstrate varying sensitivity to regional disruptions based on geographic proximity and supply chain dependencies. Middle Eastern crude grades experience the most significant premiums, while Western Hemisphere varieties show more moderate increases, creating arbitrage opportunities and supply chain rebalancing incentives across global markets.
Supply Chain Cascade Effects: From Crude to Consumer
Refinery operations face compounding challenges beyond crude oil availability. Processing facilities dependent on specific crude grades encounter operational efficiency reductions of 5-15% as they adapt to alternative feedstocks. Bahrain's BAPCO Energies has declared force majeure on operations, demonstrating how regional refineries become directly impacted by supply route disruptions.
Product distribution networks experience secondary disruption effects as refined products face transportation challenges independent of crude oil supply issues. High sulfur fuel oil (HSFO) prices jumped 40% as key shipping hubs became disrupted, directly validating theoretical models predicting downstream market impacts during major supply chain crises.
Refinery Impact Assessment Framework:
- Processing capacity affected: 5-7 million barrels per day
- Product yield efficiency changes: 5-15% operational variations
- Distribution cost increases: 8-20% above baseline levels
- Inventory management timeline disruptions: 2-4 week supply adjustments
Transportation and logistics sectors experience exponential cost increases during crisis periods. Tanker operators demand compensation increases of 200-400% for risk exposure, significantly exceeding normal market premiums. These shipping cost explosions create cascading price pressures throughout energy supply chains, affecting everything from crude transportation to refined product delivery systems.
Maritime insurance markets become particularly dysfunctional during extended crisis periods. Risk assessment for vessels transiting affected waters or attempting alternative routing has resulted in insurance becoming prohibitively expensive or completely unavailable for certain route combinations. This insurance market breakdown creates secondary supply constraints independent of physical infrastructure limitations.
Regional Economic Impact Assessment: Differential Vulnerabilities
United States energy market dynamics reflect the country's transition to net petroleum exporter status. While consumers face higher gasoline costs, domestic energy producers benefit from increased revenues, creating mixed economic effects. Consumer spending typically reduces by 0.1-0.3% of GDP per $10 oil price increase, while energy sector revenues boost by $15-25 billion annually for equivalent price movements.
However, concerns about US oil production decline could complicate these dynamics in coming years. US Economic Impact Analysis:
- Consumer inflation pressure: 0.2-0.4 percentage points per $10 sustained increase
- Federal revenue implications: $3-5 billion additional tax receipts
- Energy sector employment effects: Positive correlation with sustained price increases
- Regional economic variations: Producing states benefit while consuming regions face headwinds
European Union economies demonstrate greater vulnerability due to higher energy import dependencies and limited strategic reserve capacities. The combination of elevated energy costs and reduced economic activity creates stagflationary pressures that complicate monetary policy responses. According to The Guardian's analysis of Iran war implications, European gas markets have experienced particularly severe disruptions, with prices continuing to soar as supply routes become disrupted.
Asia-Pacific manufacturing sectors face compound effects from higher input costs and reduced global trade volumes. Energy-intensive industries encounter direct cost increases while export-dependent economies experience reduced demand from trading partners facing their own energy cost pressures. Supply chain disruptions affect both energy imports and manufactured goods exports, creating complex economic adjustment challenges.
Regional Vulnerability Comparison:
| Region | Import Dependency | Strategic Reserves | Economic Impact |
|---|---|---|---|
| United States | Net Exporter | High | Mixed/Moderate |
| European Union | High Dependency | Limited | Severe |
| Asia-Pacific | Very High | Variable | Severe |
| Middle East Producers | Export Dependent | N/A | Revenue Loss |
Central Bank Policy Response Framework
Monetary policy authorities face complex trade-offs between addressing inflationary pressures from higher energy costs and supporting economic growth amid uncertainty. The temporary nature of geopolitical price spikes often leads to look-through policies, where central banks avoid aggressive tightening in response to supply-driven inflation. However, sustained price pressures may force policy adjustments despite economic growth concerns.
Policy Response Decision Matrix:
| Economic Condition | Likely Central Bank Response | Implementation Timeline | Effectiveness Rating |
|---|---|---|---|
| Mild inflation uptick | Monitor and communicate | 1-2 quarters | High |
| Sustained price pressure | Gradual policy tightening | 2-4 quarters | Moderate |
| Economic slowdown risk | Maintain accommodation | Variable | Context-dependent |
| Stagflation concerns | Balanced approach | Extended | Low-Moderate |
Strategic petroleum reserve deployment represents critical government policy tools for market stabilisation. The timing, volume, and coordination of reserve releases significantly influence market psychology and price trajectories. Recent reports indicate the G7 considering releasing up to 400 million barrels from strategic reserves, though final decisions have been delayed as policymakers assess rapidly evolving conditions.
Reserve release effectiveness operates through dual mechanisms: immediate physical supply augmentation and psychological market impact. Market psychology effects typically generate 5-15% price reduction potential, while physical supply impacts represent 1-2% of global daily consumption. Coordination with allied nations creates multiplication effects, potentially doubling or tripling individual country effectiveness through synchronised market intervention.
Will Tariff Policies Complicate Oil Market Recovery?
The intersection of geopolitical crises with trade policy creates additional complexity layers for market recovery scenarios. Furthermore, potential tariff economic impacts could exacerbate inflationary pressures at precisely the moment when energy costs are already elevated. This combination threatens to prolong the Iran war impact on oil prices beyond typical crisis duration patterns.
Long-Term Structural Economic Transformations
Energy security investment acceleration represents one of the most significant long-term consequences of sustained price volatility and supply uncertainty. Companies and governments increasingly prioritise supply chain resilience over cost optimisation, leading to inventory building, supplier diversification, and nearshoring initiatives that permanently alter global trade patterns and economic relationships.
Structural Adaptation Timeline:
- Immediate (0-6 months): Inventory building and contract renegotiation
- Short-term (6-24 months): Supply route diversification and capacity expansion
- Medium-term (2-5 years): Infrastructure investment and technology deployment
- Long-term (5+ years): Fundamental supply chain reconfiguration
Infrastructure investment patterns shift dramatically during extended crisis periods. Pipeline diversification projects, strategic reserve expansion, and alternative energy development receive accelerated funding and regulatory priority. These investments reshape long-term energy market structures and geopolitical relationships, often persisting long after immediate crisis conditions resolve.
Supply chain resilience building becomes a permanent feature of corporate and government strategy. The recognition that cost optimisation strategies increase vulnerability during crisis periods drives fundamental changes in procurement, logistics, and inventory management practices across multiple industries beyond energy sectors.
The next major ASX story will hit our subscribers first
Investment Strategy Development: Managing Energy Price Volatility
Sophisticated market participants employ multiple hedging mechanisms to manage oil price exposure during volatile periods. Futures contracts provide direct price protection with low implementation costs and high effectiveness for 1-12 month time horizons. Options strategies offer more flexible protection but at higher costs, particularly effective for variable risk exposure scenarios.
Risk Management Instrument Analysis:
| Hedging Strategy | Implementation Cost | Complexity Level | Effectiveness Range | Optimal Time Horizon |
|---|---|---|---|---|
| Futures contracts | Low | Low | High | 1-12 months |
| Options strategies | Medium | Medium | Variable | 1-24 months |
| Supply agreements | Variable | High | High | 12+ months |
| Financial swaps | Low | Medium | High | 6-36 months |
Portfolio diversification strategies become particularly relevant during energy price volatility periods. Energy price movements affect different asset classes and geographic regions variably, creating opportunities for risk reduction through strategic allocation adjustments. Understanding correlation patterns and their evolution during crisis periods enables more effective investment strategy development.
Supply agreement modifications represent longer-term hedging strategies particularly relevant for industrial and commercial energy users. These arrangements provide price stability and supply security but require more complex negotiations and longer commitment periods. Recent market conditions have led to increased interest in these arrangements despite higher complexity levels.
Resolution Scenario Analysis: Pathways to Market Normalisation
Diplomatic resolution pathways offer various scenarios for conflict de-escalation and oil price normalisation, each with different probability assessments and timeline expectations. Ceasefire agreements typically generate 20-40% price declines within weeks as immediate supply threat perceptions diminish. However, sustained diplomatic solutions require broader regional stability frameworks to achieve lasting market normalisation.
Resolution Scenario Probability Assessment:
- Ceasefire agreement: Rapid 20-40% price decline potential
- Sanctions modification: Gradual 15-30% decline over months
- Infrastructure repair programmes: 6-18 month normalisation timeline
- Comprehensive regional stability pact: Long-term price stability improvement
Alternative supply activation mechanisms provide market adjustment pathways independent of diplomatic solutions. Global oil markets possess significant spare capacity that can partially offset supply disruptions, though activation timelines and cost structures vary considerably. Saudi Arabia has offered rare spot crude as traditional supply routes become disrupted, indicating producer attempts to maintain market supply through alternative channels.
Nonetheless, the risk of oil price stagnation due to policy uncertainty remains significant. Technology and innovation responses often accelerate during crisis periods, particularly in energy efficiency, alternative fuels, and supply chain optimisation. These developments create lasting structural changes that reduce future vulnerability to similar disruptions. According to CNBC's coverage of consumer impacts, GPS jamming chaos affecting navigation systems has prompted development of alternative positioning technologies for maritime operations.
How Long Will Market Recovery Take?
Crisis periods historically drive permanent efficiency improvements and technological adoption that persist beyond immediate emergency conditions. Investment in alternative energy sources, storage technologies, and transportation infrastructure often receives accelerated development during high price periods, creating long-term market structure changes independent of geopolitical resolution timelines.
Consequently, the Iran war impact on oil prices extends beyond immediate supply disruptions to encompass fundamental structural changes in global energy markets. Market participants should monitor multiple indicators for early signals of resolution or escalation, including diplomatic communications, shipping insurance rate changes, and strategic petroleum reserve deployment announcements. Understanding these complex interactions provides framework for navigating volatile energy markets during extended geopolitical uncertainty periods.
Disclaimer: This analysis is provided for educational purposes only and should not be considered investment advice. Energy markets involve significant risks and volatility that can result in substantial losses. Readers should conduct their own research and consult qualified financial professionals before making investment decisions.
Want to Capitalise on Energy Market Volatility?
Discovery Alert's proprietary Discovery IQ model delivers real-time alerts on significant ASX mineral discoveries, instantly empowering subscribers to identify actionable opportunities whilst energy markets experience dramatic volatility. Begin your 14-day free trial today and secure your market-leading advantage in these unprecedented market conditions.