August 25, 2026
The Geopolitical Oil Premium: How Armed Conflict Reshapes Energy Markets
Throughout modern financial history, armed conflict in oil-producing regions has consistently triggered one of the most reliable pricing mechanisms in commodity markets: the geopolitical risk premium. When physical supply routes face genuine disruption risk, crude futures reprice rapidly, often well ahead of any actual barrel leaving the ground. This mechanism does not discriminate between real supply losses and anticipated ones. Markets trade on probability, and conflict near critical transit infrastructure concentrates that probability into immediate price action.
The current Iran war represents precisely this dynamic, amplified by the unique geography of the Gulf of Oman and the Strait of Hormuz. Roughly 20% of all globally traded crude oil transits through this narrow maritime corridor, making it arguably the single most consequential shipping chokepoint for energy markets anywhere in the world. Disruption risk at this location does not affect all producers equally. Companies operating primarily in the Western Hemisphere are structurally positioned to capture rising prices without bearing the direct operational costs of conflict-zone exposure.
When big ASX news breaks, our subscribers know first
Why Western Hemisphere Producers Benefit Disproportionately From Middle Eastern Conflict
The asymmetry at the heart of this earnings story is geographic. When conflict concentrates supply risk in one region, producers operating outside that region experience a pure pricing tailwind. They receive higher prices for every barrel they produce without facing the logistics disruptions, insurance surcharges, or force majeure risks that Middle Eastern national oil companies and regional operators must navigate.
This structural advantage explains why the Exxon and Chevron profits surge on rising oil prices due to Iran war has been so pronounced. Both companies derive the overwhelming majority of their upstream production from assets in the Americas, particularly the United States. The result is an earnings profile that functions almost like a leveraged call option on crude prices during periods of Middle Eastern instability: upside exposure is significant, while direct operational downside is minimal.
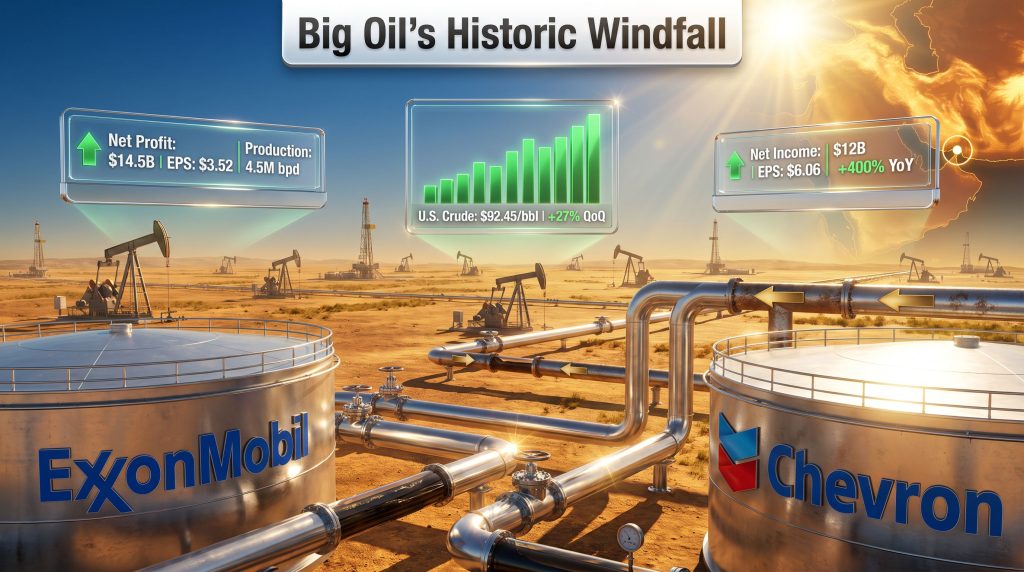
Furthermore, as detailed in our crude oil prices 2025 analysis, U.S. crude oil futures averaged $92.45 per barrel across the April through June 2026 quarter, reflecting a 27% increase over the prior quarter. This is not a marginal repricing. A 27% move in a single quarter on a commodity as foundational to global economic activity as crude oil represents a substantial redistribution of value toward producers, and away from consumers and refiners.
Breaking Down the Q2 2026 Earnings: ExxonMobil and Chevron by the Numbers
ExxonMobil Q2 2026: Record Output, Modest Per-Share Miss
ExxonMobil's Q2 2026 results illustrated a nuanced picture that caught some market participants off guard. In absolute terms, the company's net profit of $14.5 billion represented a doubling compared to approximately $7.1 billion in Q2 2025. That is an extraordinary earnings acceleration by any measure.
| Metric | Q2 2026 | Q2 2025 | Change |
|---|---|---|---|
| Net Profit | $14.5 billion | ~$7.1 billion | ~+104% |
| Adjusted EPS | $3.52 | N/A | Missed estimate by $0.08 |
| Worldwide Production | 4.5 million bpd | N/A | 20+ year high (ex-disruptions) |
| Permian Basin Output | Record high | N/A | All-time production milestone |
However, the company's adjusted earnings per share of $3.52 came in 8 cents below Wall Street's consensus expectation of $3.60, according to analyst estimates compiled by LSEG. This per-share miss, despite the absolute profit doubling, contributed to a roughly 2% decline in Exxon shares during premarket trading on 31 July 2026.
The divergence between absolute profits and per-share outcomes is partly explained by share count dynamics, but also by the precision with which institutional investors apply per-share metrics to evaluate earnings quality. A miss on EPS, even alongside record-breaking production volumes, signals to algorithmic trading systems and quantitative funds that expectations were not fully met.
Exxon's upstream production reaching its highest level in more than 20 years (when excluding Middle East disruption zones) is a significant operational milestone. The Permian Basin specifically achieved an all-time production record, reflecting the years of infrastructure investment in shale drilling that is now paying dividends during a high-price environment. According to reporting from energynow.com, the conflict has simultaneously eroded certain cost structures even as top-line revenues have soared.
Chevron Q2 2026: A 400% Earnings Surge That Rewrote the Playbook
Chevron's results were, by almost any measure, more dramatic. Net income climbed to $12 billion in Q2 2026, compared to just $2.5 billion in Q2 2025. That is a nearly 400% year-over-year increase, representing one of the most significant single-quarter earnings recoveries in the company's modern operating history.
| Metric | Q2 2026 | Q2 2025 | Change |
|---|---|---|---|
| Net Income | $12 billion | $2.5 billion | ~+400% |
| Adjusted EPS | $6.06 | N/A | Beat estimates by $0.50 |
| U.S. Production | ~2 million bpd | N/A | All-time record high |
| Global Production | 4 million bpd | 3.4 million bpd | +20% year-over-year |
Chevron's adjusted earnings per share of $6.06 beat analyst expectations by 50 cents against a consensus estimate of $5.56, also sourced from LSEG polling. Chevron shares responded positively, gaining approximately 1% in premarket trading. Bloomberg's coverage characterised the result as Chevron blowing away estimates on the back of war-driven price momentum.
Particularly notable is Chevron's U.S. production milestone. Output reached approximately 2 million barrels per day domestically, an all-time record for the company. Globally, production expanded from 3.4 million bpd to 4.0 million bpd, a 20% year-over-year increase attributed in part to export surges driven by Middle Eastern supply disruption pulling demand toward available U.S. crude volumes.
Chevron's CEO Mike Wirth characterised the company's performance as operating across all business lines at full capacity simultaneously, framing the production surge not merely as an opportunistic response to elevated prices but as a necessary contribution to global energy stability during a period of acute supply tightness.
Production Strategy: Filling the Supply Gap Created by Conflict
Shale Infrastructure as a Rapid-Response Mechanism
One of the lesser-appreciated structural advantages of U.S. shale production is its relatively short cycle time compared to conventional oil development. While a deepwater project or a greenfield oilsands development might require five to ten years from final investment decision to first oil, shale wells in basins like the Permian can move from drilling authorisation to production in weeks to months.
This flexibility transforms U.S. shale into a de facto global swing production mechanism during geopolitical disruptions. When Middle Eastern supply faces operational constraints, the market's fastest available response is increased throughput from already-producing shale infrastructure. Exxon's Permian Basin record and Chevron's domestic output milestone are not coincidental. Both companies appear to have deliberately pushed utilisation rates higher during Q2 2026 to capture both pricing and volume upside simultaneously.
The Export Redirection Effect
Supply shortfalls from conflict-affected regions create what energy economists sometimes describe as a trade-flow redirection effect. Buyers who historically sourced crude from the Gulf must seek alternative supply, and U.S. exporters become the natural beneficiary. This dynamic was visible in Chevron's 20% global production increase, which the company partly attributed to export demand driven by Middle Eastern supply gaps.
This redirection can persist even if the conflict de-escalates, because buyers who have re-contracted supply from alternative sources do not immediately revert to previous purchasing arrangements. There are contractual, logistical, and relationship factors that create stickiness in trade-flow shifts, providing a medium-term volume tailwind that extends beyond the immediate conflict premium period. Consequently, the US-China trade war's impact on oil adds yet another layer of complexity to these already shifting global supply chains.
Why Share Prices Do Not Always Reflect Profit Magnitude
The muted and in Exxon's case negative share price reaction to what were objectively extraordinary earnings numbers reveals something important about how institutional investors approach conflict-driven profit cycles. Markets are forward-looking instruments, and the key question being priced is not what happened in Q2 2026 but how durable those conditions are across the next four to eight quarters.
Conflict-driven earnings windfalls tend to attract lower valuation multiples from institutional investors because they are categorised as non-recurring events rather than evidence of structural improvement in a company's competitive position or long-term cash generation capacity.
However, this is not irrational. Historical analysis of oil price shocks offers a sobering dataset:
| Conflict Event | Crude Price Impact | Duration of Premium | Big Oil Earnings Response |
|---|---|---|---|
| 1973 Arab Oil Embargo | ~300% price increase | Multi-year | Generational profit surge |
| 1990 Gulf War | ~100% spike | ~6 months | Short-term windfall |
| 2003 Iraq Invasion | Gradual 50%+ rise | Multi-year | Sustained upstream gains |
| 2022 Russia-Ukraine War | ~60% spike | ~12-18 months | Record profits for Western majors |
| 2026 Iran War | +27% QoQ to $92.45/bbl | Ongoing as of Q2 2026 | Exxon +104%, Chevron +400% YoY |
The 2022 Russia-Ukraine conflict offers perhaps the most instructive parallel. Western majors posted record or near-record profits through 2022 and into early 2023, but as European buyers secured alternative supply and markets adapted, the risk premium compressed and earnings normalised. Investors who bought energy stocks at the peak of the 2022 conflict premium found that share price appreciation had already priced in much of the earnings upside.
The Downstream Offset: Integrated Models Dampen Pure Leverage
Both ExxonMobil and Chevron operate as integrated energy companies, meaning their business models span upstream production, midstream transportation, and downstream refining and petrochemicals. This integration creates a natural internal hedge: when crude prices rise sharply, upstream divisions report exceptional margins while downstream refining operations face higher feedstock costs that compress their own margins.
This internal offset partially explains why a 27% crude price increase does not translate into a proportionally equivalent earnings increase for integrated majors. Pure-play upstream producers with no downstream exposure would theoretically capture more of the crude price upside on a per-barrel basis, but they also carry far greater downside risk when prices fall. Integrated models trade some upside leverage for earnings stability across the cycle. For broader context on how the current crude oil market is evolving, these dynamics are worth examining in detail.
The next major ASX story will hit our subscribers first
Scenarios for Oil Price Durability Through the Remainder of 2026
Three Pathways for Energy Investors to Monitor
The sustainability of elevated crude pricing depends heavily on how the Iran conflict evolves. Three distinct scenarios frame the investment case:
-
Prolonged conflict scenario: Sustained military activity maintains the geopolitical risk premium above $80 per barrel for multiple quarters, extending the earnings tailwind for U.S. producers well into 2027.
-
Negotiated de-escalation scenario: Diplomatic progress over the next one to two quarters gradually compresses the risk premium, with prices normalising toward the $70–75 range by year-end 2026.
-
Rapid resolution scenario: A ceasefire or significant diplomatic breakthrough triggers a rapid unwinding of the conflict premium, potentially returning prices to pre-war levels within one to two quarters.
Historical precedent from the 1990 Gulf War, where the crude price spike reversed within approximately six months of resolution, suggests that even well-entrenched geopolitical premiums can deflate quickly when conflict risk reduces.
Demand Destruction as the Natural Ceiling
Sustained crude above $90 per barrel introduces an economic self-limiting mechanism. At these price levels, energy costs become a meaningful drag on manufacturing input costs, transport economics, and consumer purchasing power in price-sensitive emerging markets. Historically, sustained pricing at these levels triggers demand moderation, particularly in Asian industrial economies, which eventually reduces the forward pressure on crude prices even without conflict resolution.
Central banks monitoring energy-driven inflation face additional complexity at $90+ crude. Prolonged elevated energy prices can re-anchor inflation expectations, potentially requiring monetary policy to remain more restrictive for longer than otherwise anticipated, with secondary effects on economic activity and commodity demand. In addition, OPEC's influence on global markets remains a critical variable in determining whether production adjustments will further amplify or moderate this pricing environment.
Investment Frameworks for Energy Sector Exposure
For investors considering positioning within the energy sector during this period, the structural characteristics of different investment vehicles carry meaningfully different risk profiles:
- Integrated majors such as ExxonMobil and Chevron offer balanced upstream leverage with downstream stabilisation, making them lower-volatility vehicles for capturing the oil price cycle.
- Pure-play upstream producers provide higher earnings leverage to crude price movements in both directions, appropriate for investors with higher risk tolerance and shorter investment horizons.
- Energy ETFs and diversified commodity funds deliver broad sector exposure without the idiosyncratic risk of any single company's earnings miss or operational issue.
- Hedging strategies including options on crude futures can allow investors to define their exposure profile precisely, limiting downside if the conflict premium rapidly unwinds.
Furthermore, the longer-term outlook for energy companies will also hinge on the energy transition and renewables, as pressure mounts on majors to balance fossil fuel profitability with decarbonisation commitments.
Disclaimer: This article is for informational purposes only and does not constitute financial advice. Past performance of energy sector investments during geopolitical events does not guarantee future results. Investors should conduct independent research and consult qualified financial advisors before making investment decisions.
Frequently Asked Questions
Why did Exxon and Chevron profits surge in Q2 2026?
Both companies reported dramatically higher earnings driven by a 27% quarter-over-quarter increase in U.S. crude oil prices, which averaged $92.45 per barrel from April through June 2026. The Iran war created significant supply disruption risk across Middle Eastern shipping corridors, generating a crude price premium that directly amplified upstream earnings for both companies. The Exxon and Chevron profits surge on rising oil prices due to Iran war reflects this powerful combination of elevated pricing and record production volumes.
How much did Chevron's profits increase year-over-year?
Chevron's net income reached $12 billion in Q2 2026, representing a nearly 400% increase compared to $2.5 billion reported in Q2 2025. Adjusted earnings per share came in at $6.06, exceeding analyst expectations by 50 cents.
Did ExxonMobil beat or miss earnings estimates in Q2 2026?
ExxonMobil posted adjusted earnings of $3.52 per share, which came in 8 cents below Wall Street's consensus estimate of $3.60 according to LSEG data. Despite this per-share shortfall, the company's absolute net profit of $14.5 billion represented a doubling of year-over-year earnings.
What is Exxon's current production level?
ExxonMobil's worldwide production reached 4.5 million barrels per day in Q2 2026. Upstream output hit its highest level in more than 20 years when excluding Middle East disruption zones, and the Permian Basin achieved a record production milestone during the quarter.
How long could elevated oil prices persist due to the Iran conflict?
Historical analysis of comparable geopolitical events suggests conflict-driven oil premiums typically persist for 6 to 24 months before supply substitution, demand destruction, or diplomatic resolution compresses prices. The 2022 Russia-Ukraine conflict, the most structurally comparable recent precedent, sustained elevated pricing for approximately 12 to 18 months before normalisation. The Exxon and Chevron profits surge on rising oil prices due to Iran war may therefore sustain through several additional quarters, depending on how the geopolitical situation develops.
Want to Track the Next Major Commodity Opportunity Before the Market Moves?
Discovery Alert's proprietary Discovery IQ model delivers real-time alerts on significant ASX mineral discoveries, helping investors of all experience levels identify actionable opportunities the moment they emerge — explore historic examples of exceptional discovery returns or start your 14-day free trial today to gain a market-leading edge.