July 31, 2026
The Compounding Arithmetic Behind a Century of Purchasing Power Destruction
Most people encounter inflation as a monthly inconvenience, a slightly higher grocery bill, a fuel receipt that stings a little more than expected. What they rarely encounter is the full mathematical weight of that inconvenience compounded across 112 years. When you step back and view fiat currency erosion at that scale, the numbers stop feeling abstract and start revealing something structural about how modern monetary systems actually function.
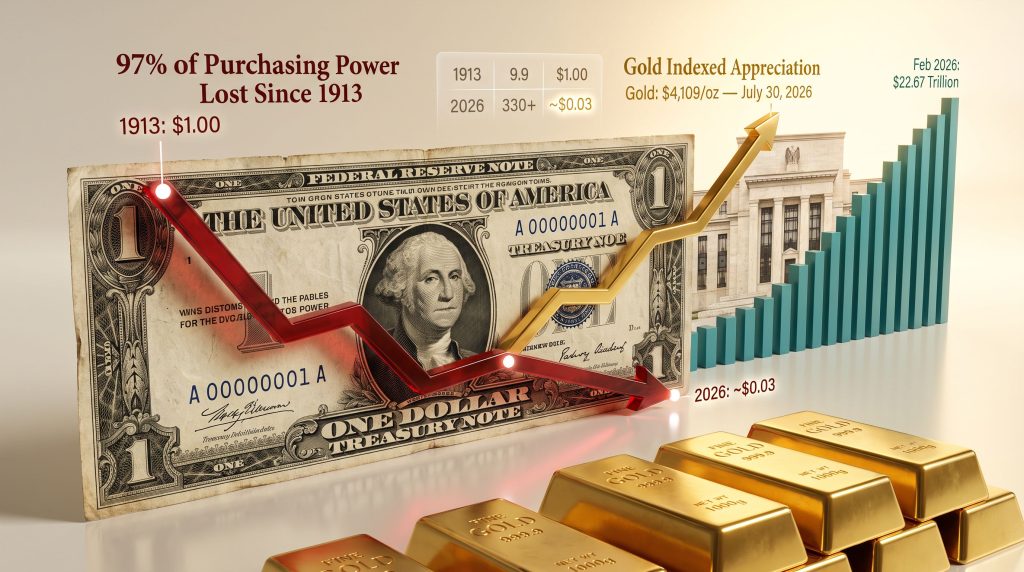
The US dollar has lost approximately 97% of its purchasing power since 1913, according to Bureau of Labor Statistics CPI-U historical data. Independent calculations consistently land in the 96.8% to 97% range, converging on the same conclusion: a dollar from 1913 commands roughly three cents of equivalent purchasing power in today's economy. That figure is not a political argument. It is the arithmetic output of compounding inflation across more than a century of fiat monetary management.
Understanding why the Federal Reserve eroded 97% of dollar value since 1913 requires understanding three things in sequence: the institutional architecture that was built to manage money, the policy mechanics that expand the money supply, and the long-run empirical record of what that expansion has delivered for savers.
When big ASX news breaks, our subscribers know first
Purchasing Power vs. Face Value: The Distinction That Changes Everything
A dollar is always worth a dollar. That statement is nominally true and practically misleading. The face value of a currency unit is fixed by legal definition. The purchasing power of that unit, meaning the quantity of real goods and services it can actually acquire, is determined by supply and demand dynamics in the broader economy and, critically, by how many additional dollars have been created since the last time you checked.
The Consumer Price Index (CPI-U), published by the Bureau of Labor Statistics, is the standard tool for measuring this erosion over time. It tracks the cost of a representative basket of consumer goods and services, recalibrated periodically to reflect changing consumption patterns. The following table presents the long-run deterioration in dollar purchasing power using CPI-U indexed data:
| Year | Approximate CPI-U Index | Equivalent 1913 Dollar Value |
|---|---|---|
| 1913 | 9.9 (baseline) | $1.00 |
| 1971 | ~40.5 | ~$0.24 |
| 2000 | ~172.2 | ~$0.06 |
| 2010 | ~218.1 | ~$0.05 |
| 2026 | ~330+ | ~$0.03 |
Sources: BLS CPI-U historical series; Federal Reserve historical data
The progression is not linear. It accelerates at key inflection points, each of which corresponds to a major monetary event. The sharpest structural break occurs after 1971, a date whose significance will be examined in detail below.
A 2% annual inflation target, sustained for 112 years, mathematically produces near-total erosion of real value. The 97% figure is not the product of runaway hyperinflation. It is the quiet, compounding output of a policy that was designed, in its own framing, to be moderate.
Furthermore, according to historical purchasing power analysis, this deterioration has been both consistent and measurable across every decade since the Federal Reserve's founding, reinforcing the structural rather than episodic nature of dollar erosion.
The Institutional Architecture of the Federal Reserve
A Hybrid System Born From Political Compromise
The Federal Reserve was not designed in a vacuum. It was engineered under significant political constraints, and those constraints left structural fingerprints that persist today. Congress created the Fed on December 23, 1913, when President Woodrow Wilson signed the Federal Reserve Act into law. The proximate catalyst was the Panic of 1907, a severe banking crisis that froze credit markets and demonstrated, in the starkest possible terms, that the US financial system had no institutional backstop when liquidity evaporated (Federal Reserve History).
The resulting architecture reflects the political tensions of the era:
-
12 regional Reserve Banks distributed across Boston, New York, Philadelphia, Cleveland, Richmond, Atlanta, Chicago, St. Louis, Minneapolis, Kansas City, Dallas, and San Francisco. Western and Southern states deeply distrusted the Eastern financial establishment, and geographic distribution was the price of political passage.
-
The Board of Governors, comprising seven presidential appointees serving 14-year non-renewable terms in Washington D.C., with Chair and Vice Chair positions carrying renewable four-year terms. The extended, non-renewable terms were designed specifically to insulate monetary policy from electoral cycles (Congressional Research Service).
-
The Federal Open Market Committee (FOMC), the 12-member rate-setting body that convenes eight times annually. Voting membership rotates among regional bank presidents, and their dissenting votes are part of the public record. On July 29, 2026, the FOMC voted 9-3 to hold rates steady, with the Cleveland, Minneapolis, and Dallas regional presidents all preferring a rate hike. It marked the first time since September 2016 that three members broke from a single decision in the same direction (CNBC, July 29, 2026).
The Dual Mandate and Its Inflationary Bias
Congress assigned the Federal Reserve two simultaneous objectives, a framework commonly referred to as the dual mandate (St. Louis Fed):
-
Maximum employment, defined not by a fixed numerical target but by conditions in the evolving labor market
-
Price stability, which the Fed operationally defines as 2% annual inflation measured via the Personal Consumption Expenditures (PCE) index, not CPI-U
The structural tension between these two goals is not incidental. It is the central design problem of American monetary policy. When unemployment falls to low levels, workers gain bargaining power, wages rise, companies pass those costs forward, and inflation increases. When the Fed raises rates to suppress that inflation, borrowing costs climb, business investment contracts, and unemployment tends to follow. The Fed is perpetually navigating this tradeoff.
Critics argue this creates a consistent asymmetry: when fighting inflation means raising unemployment, political and institutional pressure systematically favours delay. Over 112 years, that delay compounds into measurable purchasing power loss. Consequently, understanding gold as inflation hedge strategies has become increasingly relevant for investors seeking to protect their real wealth across monetary cycles.
In May 2026, the House Financial Services Committee marked up H.R. 5396, a bill proposing to replace the dual mandate with a single price stability mandate (Congress.gov, May 2026). The legislation has not passed into law, and its ultimate fate remains uncertain. What it reflects is a genuine ongoing debate about whether the employment component of the mandate has structurally biased the Fed toward accommodation over the long run.
How the Federal Reserve Controls the Price of Money
The Federal Funds Rate as the Master Lever
The Fed's most consequential tool is the federal funds rate, the overnight interbank lending rate that serves as the benchmark from which virtually every other borrowing cost in the US economy is priced (Federal Reserve). The transmission mechanism flows through the economy in the following sequence:
-
The FOMC sets a target range for the overnight lending rate between banks
-
Banks face higher or lower costs for reserve financing, which alters their lending economics
-
Those economics pass through to mortgages, auto loans, credit card rates, and corporate bond yields
-
The cost of borrowing affects spending and investment decisions across households and businesses
-
Aggregate demand contracts or expands accordingly, pulling inflation higher or lower
As of July 29, 2026, the FOMC held the federal funds rate at 3.50%–3.75% for the fifth consecutive meeting, citing inflation running above target and elevated geopolitical uncertainty stemming from the Middle East conflict (CNBC). The three dissenting votes, preferring an immediate rate hike, introduced a degree of internal division not seen in nearly a decade.
Quantitative Easing, Tightening, and the Balance Sheet Expansion
When the federal funds rate approaches zero and conventional rate policy loses traction, the Fed deploys quantitative easing (QE): large-scale purchases of Treasury bonds and mortgage-backed securities that inject reserves into the banking system and push down long-term interest rates. The following table tracks the Fed's balance sheet across major policy epochs:
| Period | Fed Balance Sheet Size | Change |
|---|---|---|
| Pre-2020 | ~$4 trillion | Baseline |
| April 2022 (QE peak) | ~$9 trillion | +$5 trillion |
| July 22, 2026 (post-QT) | $6.747 trillion | -$2.25 trillion |
Sources: Brookings Institution; Federal Reserve; StreetStats
The 2020 to 2022 QE program, which added nearly $5 trillion to the balance sheet in roughly two years, is the proximate monetary cause of the 9.1% CPI reading recorded in June 2022, the highest inflation reading since 1981 (Morningstar; Federal Reserve). The Fed subsequently pivoted to quantitative tightening (QT), allowing assets to roll off without reinvestment, reducing the balance sheet from its peak of approximately $9 trillion to $6.747 trillion as of July 22, 2026.
It is worth noting that reserve requirements, historically used as a parallel policy lever, were effectively abandoned as an active tool in 2020, leaving the federal funds rate and balance sheet operations as the Fed's primary instruments (Morningstar).
The Independence Question and the 2026 Political Dynamic
The Federal Reserve occupies a peculiar constitutional position. It was created by Congress, its governors are nominated by the President and confirmed by the Senate, yet it operates outside the congressional appropriations process and its leadership does not turn over with each election. This hybrid status is classified as an independent government agency, distinct from both a standard government department and a private institution (Federal Reserve History).
The theoretical rationale for that independence is straightforward. Electoral incentives consistently favour lower rates and looser monetary conditions, regardless of inflationary consequences. An institution insulated from those incentives should, in principle, be capable of taking decisions that are politically uncomfortable but economically necessary.
In practice, executive pressure on the Fed is a recurring feature of American monetary history rather than an exception. The 2026 iteration of this dynamic is particularly pointed. Kevin Warsh, sworn in as Fed Chair on May 22, 2026, adopted a hawkish posture on inflation that contradicted initial market assumptions about political accommodation. At the July 29 press conference, public White House pressure for lower rates was met with a reaffirmation of the price stability mandate (PBS NewsHour; CNBC).
Executive branch pressure on the Federal Reserve is not a modern anomaly. It is a recurring feature of American monetary history that has appeared in virtually every inflationary episode since 1913. The outcome of that tension has a measurable track record: the dollar has lost approximately 97% of its purchasing power.
The 112-Year Empirical Record
Crisis Responses and the Institutional Pattern
Viewed longitudinally, the Federal Reserve's operating history reveals a consistent institutional pattern: financial stress triggers balance sheet expansion, rate reduction, or both. The following table maps major crisis episodes to their monetary consequences:
| Crisis Episode | Fed Response | Monetary Consequence |
|---|---|---|
| Great Depression (1929–1933) | Initially contractionary, then expansionary | Deflation followed by recovery stimulus |
| WWII (1941–1945) | Rate suppression to finance government debt | Post-war inflationary pressure |
| Stagflation (1970s) | Delayed tightening, then aggressive Volcker hikes | Peak CPI ~14.8% (1980) |
| Global Financial Crisis (2008–2009) | QE1, near-zero rates | Balance sheet expanded from ~$900B to $2.3T |
| COVID-19 (2020–2022) | ~$5T QE program | CPI peaked at 9.1% (June 2022) |
Sources: Federal Reserve History; BLS; Brookings Institution
This pattern does not constitute a criticism unique to the Federal Reserve. Every major central bank, the European Central Bank, the Bank of Japan, and the People's Bank of China, operates on the same foundational model. Monetary expansion is the default institutional response to systemic stress. The cumulative effect, measured across the timeframes that matter to savers and retirees, is persistent purchasing power erosion that is invisible on a quarterly basis but compounding across decades. In addition, central bank gold demand has risen markedly in recent years as institutions seek to diversify reserves away from fiat currency exposure.
M2 Money Supply: The Quantitative Mechanism of Erosion
M2 money supply, the broadest standard measure of dollars in circulation, provides the most direct quantitative window into the mechanism behind purchasing power decline. The expansion is difficult to overstate:
-
1960: M2 approximately $300 billion
-
February 2026: M2 reached an all-time high of approximately $22.67 trillion (Federal Reserve H.6 Release)
That represents an increase of roughly 7,456% over 66 years. Each new dollar created through this expansion dilutes the real value of every dollar already in existence. This is not a side effect of monetary policy. It is the mechanism itself. Moreover, data from dollar devaluation tracking tools confirms that this trajectory has accelerated meaningfully in the post-2008 era.
The next major ASX story will hit our subscribers first
The Nixon Shock and the Structural Break Point
August 15, 1971: When the Commodity Anchor Was Removed
No single date in modern monetary history carries more structural weight than August 15, 1971, when President Nixon severed the last formal link between the US dollar and gold, ending the Bretton Woods agreement. The Nixon Shock gold standard removal eliminated the external discipline that had constrained monetary expansion for decades. Under Bretton Woods, the dollar was anchored at $35 per ounce of gold, providing an external constraint on money supply expansion. Once that anchor was removed, the constraint on dollar creation became purely institutional rather than commodity-based.
The long-run price data captures what followed. As of July 30, 2026, gold trades at approximately $4,109 per ounce, representing an appreciation of roughly +11,640% in nominal dollar terms since the Bretton Woods anchor was abandoned (goldsilver.com/price-charts/). That figure is not primarily a statement about gold's intrinsic value. It is a measurement of how many more dollars are now required to purchase an unchanged quantity of a commodity that cannot be printed.
The 113-Year Dual-Series Comparison
The following table presents the long-run inverse relationship between dollar purchasing power and gold's indexed value, expressed from a common 1913 baseline:
| Metric | 1913 Baseline | 2026 Value | Change |
|---|---|---|---|
| Dollar purchasing power (indexed) | 100 | ~3 | -97% |
| Gold price (indexed to 1913 = 100) | 100 | ~19,900 | +19,800% |
Sources: BLS CPI-U; goldsilver.com/price-charts/ (gold at $4,109/oz as of July 30, 2026)
These two series are not measuring different phenomena. They are measuring the same phenomenon from opposite directions. One quantifies what the dollar has surrendered. The other quantifies how many additional dollars the market now demands to acquire a fixed physical quantity of something that monetary policy cannot replicate.
Real Yields, Gold Pricing, and the Transmission Mechanism
How Fed Policy Translates Into Commodity Prices
The relationship between Federal Reserve policy and gold pricing is one of the most structurally consistent in financial markets, and it operates through a single variable: real yields, defined as the nominal 10-year Treasury yield minus expected inflation. Furthermore, understanding gold and bond dynamics provides essential context for interpreting how rate cycles influence the relative attractiveness of hard assets versus fixed income instruments.
The logic is straightforward:
-
When the Fed raises rates and real yields rise, Treasury bonds become comparatively more attractive against gold, which generates no yield. Gold faces headwinds.
-
When real yields fall, either because nominal rates decline or because inflation expectations rise faster than rates, the opportunity cost of holding gold diminishes. Gold becomes more competitive.
Historical market data suggests that a 25-basis-point movement in real yields has corresponded to an approximately $40 to $60 per ounce movement in gold, establishing a quantifiable sensitivity range (Federal Reserve; historical market data).
This short-run pricing mechanism operates within the longer-run structural context described above. The real yield relationship explains the timing of gold price movements across a rate cycle. The M2 expansion and purchasing power erosion explain the directional trajectory across decades.
The Real Return Problem for Savers
When Nominal Interest Rates Fail to Outpace Inflation
With the federal funds rate held at 3.50%–3.75% while inflation runs above 3.5%, cash savers face an environment where nominal returns and inflation are running nearly neck and neck. A saver earning 3.5% nominal interest while inflation tracks at 3.7% loses approximately 0.2% of real purchasing power annually, before accounting for tax obligations on nominal interest income. After tax, the real return turns more deeply negative.
This is not an anomaly created by unusual circumstances. It is a structural feature of the current monetary environment, one that mirrors conditions seen repeatedly across the post-1971 era whenever the Fed holds rates below the prevailing inflation rate, whether by design or institutional lag.
The distinction between speculative allocation to gold (predicting price appreciation) and purchasing power preservation through hard assets (structural portfolio construction) is important here. The structural argument does not rest on a price forecast. It rests on the observed 112-year track record of fiat purchasing power erosion. For investors weighing their options, understanding physical gold vs ETFs is a practical starting point for constructing an allocation strategy suited to this environment.
This article is for informational and educational purposes only. It does not constitute financial or investment advice. Past performance of any asset class is not a guarantee of future results. Readers should consult a qualified financial adviser before making any investment decisions.
Frequently Asked Questions
What does it mean that the dollar has lost 97% of its value since 1913?
This refers specifically to purchasing power, not face value. A dollar in 1913 could purchase what requires approximately $30 to $33 today, meaning its equivalent real value has compressed to roughly three cents in today's money. The figure is calculated using BLS CPI-U data and consistently falls in the 96.8% to 97% range depending on the calculation endpoint and methodology applied.
How does the Federal Reserve create inflation?
The process operates through four steps:
-
The Fed expands the money supply via asset purchases or rate reductions that stimulate credit creation
-
More dollars enter circulation while the quantity of available goods and services does not expand proportionally
-
Prices rise to reflect the increased monetary supply chasing the same real output
-
The purchasing power of each existing dollar falls in proportion to the degree of expansion
What is the federal funds rate and why does it matter?
It is the overnight interbank lending rate set by the FOMC as a target range. As of July 29, 2026, that range sits at 3.50%–3.75%. Because it benchmarks the cost of money at the institutional level, every major borrowing rate in the economy, mortgages, corporate bonds, credit cards, and savings yields, is priced relative to it.
Why do gold prices move when the Federal Reserve changes rates?
Gold is priced against the opportunity cost of holding interest-bearing assets. When real yields rise, that opportunity cost increases, and gold typically falls. When real yields fall, the inverse applies. Historical sensitivity data points to approximately $40 to $60 per ounce per 25-basis-point move in real yields.
What happened to the dollar after the US left the gold standard in 1971?
The removal of the Bretton Woods commodity anchor eliminated the external constraint on dollar creation. Gold had been fixed at $35 per ounce under that system. By July 30, 2026, it trades at approximately $4,109 per ounce, reflecting the cumulative monetary expansion that followed the removal of that constraint (goldsilver.com/price-charts/).
How does Fed policy affect everyday savings accounts?
The federal funds rate sets the floor for what banks pay on deposits. When that rate sits near or below the prevailing inflation rate, nominal interest income does not preserve purchasing power in real terms. Savers watching their account balance grow in dollar terms may simultaneously be losing ground in real terms, a dynamic that has characterised extended periods of post-1971 monetary history. The Federal Reserve eroded 97% of dollar value since 1913 through precisely this mechanism, operating gradually and often imperceptibly across each passing decade.
Want to Know Which ASX Discoveries Could Protect Your Wealth Against Purchasing Power Erosion?
Discovery Alert's proprietary Discovery IQ model delivers real-time alerts on significant ASX mineral discoveries, instantly translating complex geological data into actionable opportunities — the kind of hard-asset exposure that has historically offered a structural counterweight to fiat currency erosion. Explore how historic mineral discoveries have generated substantial returns on Discovery Alert's dedicated discoveries page, and begin your 14-day free trial today to position yourself ahead of the broader market.