
June 30, 2026
The Physics of Scale: What Moving 200 Million Tonnes of Iron Ore Actually Requires
Most industries measure progress in percentages. Mining measures it in mountains. When a single operation reaches the threshold of shifting 200 million metric tons of iron ore in a single calendar year, the numbers stop feeling like accounting entries and start resembling geography. Understanding what this kind of throughput demands physically, logistically, and financially reframes how investors, analysts, and industry observers should think about bulk commodity operations at the highest tier of global production.
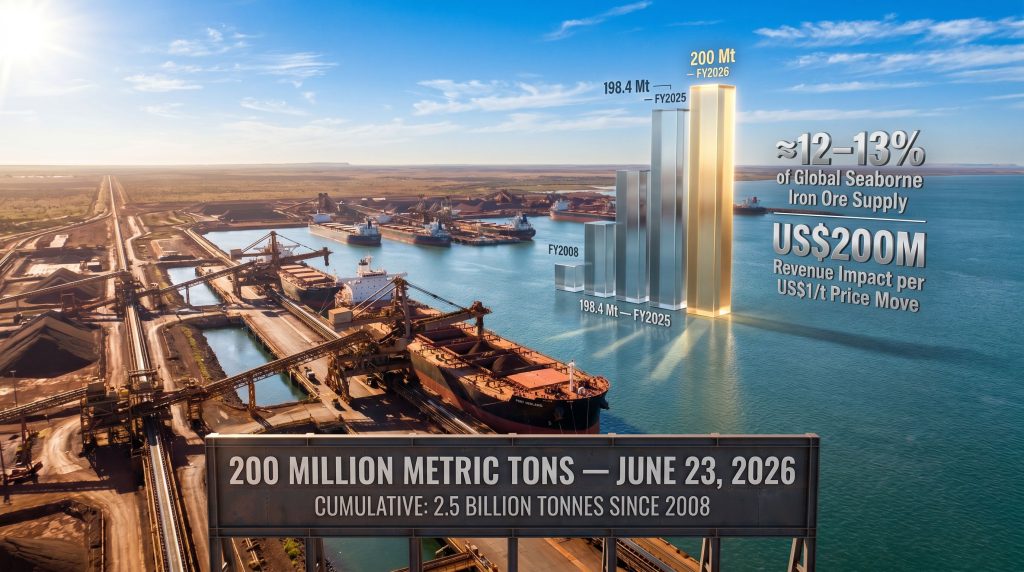
Fortescue's confirmation that it shipped Fortescue 200 million metric tons of iron ore for the first time in its operating history, a milestone locked in on June 23, 2026, is not a headline to scroll past. It is an operational proof point with cascading implications for commodity markets, capital allocation strategy, and the evolving economics of Pilbara iron ore supply.
When big ASX news breaks, our subscribers know first
Visualising the Volume: From Numbers to Physical Reality
Raw tonnage figures can be deceptive in their abstraction. Grounding 200 million metric tons in physical terms makes the achievement easier to contextualise.
-
The annual volume is sufficient to fill approximately 30,000 Olympic-sized swimming pools with iron ore every single year.
-
More than 1,000 ore carriers depart Port Hedland annually, loaded across three dedicated ship loaders operating concurrently at the terminal.
-
Fortescue's cumulative lifetime shipments have now surpassed 2.5 billion metric tons since the first vessel departed Port Hedland in May 2008.
-
That inaugural year involved just 140 vessels serving the company's initial customer base, a fraction of the fleet engagement required today.
The gap between 140 vessels and 1,000-plus annual vessel movements is not simply a volume story. It reflects the compression of what would normally take legacy miners several generations of infrastructure investment into fewer than two decades of focused capital deployment.
From First Shipment to Global Benchmark: The Capacity Build Fortescue Executed
A Timeline Few Predicted Would Succeed
When Fortescue began shipping iron ore in May 2008, the prevailing view in mining circles was sceptical. The company had constructed its initial infrastructure against considerable doubt about whether it could sustain reliable export volumes from a standing start. That first shipment represented not just a commercial event but the opening of a supply chain that has since become one of the most consequential in global commodity trade.
The progression in annual shipment volumes tells a story of deliberate, compounding infrastructure expansion:
| Fiscal Period | Shipment Volume | Context |
|---|---|---|
| FY2008 (Inaugural Year) | Minimal, 140 vessels | First commercial exports |
| FY2025 (Pre-Milestone Record) | 198.4 million tonnes | Upper end of guidance range |
| FY2026 Guidance Range | 195–205 million tonnes | Midpoint target ~200 million tonnes |
| June 23, 2026 (Milestone Date) | 200 million tonnes confirmed | First-ever single-year crossing |
| Cumulative Total (to 2026) | 2.5+ billion metric tons | Full operating history |
The FY2025 result of 198.4 million tonnes is particularly instructive. It arrived at the upper boundary of guidance, signalling that operations were running at or near maximum capacity. The FY2024/2025 total ore production figure reached 238.9 million tonnes, meaning the gap between ore mined and ore shipped reflects the operational reality of stockpile management, blending requirements at port, and the inherent lag in vessel scheduling logistics.
Why Pure-Play Concentration Accelerated the Ramp
A lesser-discussed structural advantage in Fortescue's growth story is the discipline enforced by commodity concentration. Unlike diversified miners that must allocate capital across copper, coal, potash, and various other commodities, Fortescue built its entire infrastructure program around a single supply chain. Every dollar of capital expenditure, every engineering decision, and every operational improvement was directed toward one objective: moving Pilbara iron ore to Asian steel markets faster and at lower cost per tonne.
This focus created a feedback loop. Efficiency gains at one part of the supply chain could be reinvested immediately into bottlenecks elsewhere, without competing against unrelated project demands. The trade-off, of course, is a higher sensitivity to iron ore price cycles, which has historically driven earnings volatility that diversified peers can partially absorb through cross-commodity hedging.
Port Hedland: The Infrastructure That Makes 200 Million Tonnes Possible
The World's Largest Bulk Export Terminal
Port Hedland in Western Australia's Pilbara region functions as the critical chokepoint for the entire Fortescue supply chain. It is the largest bulk commodity export terminal on the planet by throughput, a status that carries both operational advantages and logistical constraints. Furthermore, Australia's iron ore leadership in global markets is largely underpinned by the scale and efficiency of this single facility. The port serves not only Fortescue's volumes but also those of other Pilbara producers, making berth allocation, tidal scheduling, and vessel queueing management as strategically important as the mining operations themselves.
Three ship loaders operating simultaneously at the terminal enable continuous vessel loading, reducing the idle time per vessel that would otherwise create downstream scheduling problems across an export program of more than 1,000 annual departures.
The Mine-to-Port Supply Chain Architecture
The movement of iron ore from Pilbara mine sites to loaded vessels involves several integrated systems working in concert:
-
Autonomous and semi-autonomous haulage at mine sites progressively increases truck cycle efficiency and reduces the per-tonne cost of moving ore from pit to crusher.
-
Fortescue's proprietary rail network connects multiple mine sites across the Pilbara to the Port Hedland terminal, managing the continuous flow of ore required to keep ship loaders operating at capacity.
-
Ore blending and quality management at port ensures that product specifications delivered to international customers remain consistent, a critical commercial requirement given that steel mills operate to precise input specifications.
-
Vessel scheduling systems coordinate over 1,000 annual departures, accounting for tidal windows, berth availability, vessel size variability, and shipping route optimisation to primary Asian markets.
An often-overlooked technical factor in high-volume iron ore export operations is the role of tidal windows at Port Hedland. The port's shallow harbour approach channels mean that fully laden Capesize and Newcastlemax vessels can only depart during specific tidal windows, creating a natural constraint on daily vessel throughput that ship loading schedules must be built around.
In addition, Pilbara haul road logistics are evolving rapidly, with infrastructure upgrades continuing to improve ore transit times from mine sites to port facilities.
How Fortescue's Volume Positions Against Global Iron Ore Benchmarks
Seaborne Trade Context
Global seaborne iron ore trade has historically ranged between 1.5 and 1.7 billion tonnes annually. At 200 million tonnes of annual shipments, Fortescue accounts for approximately 12 to 13 percent of total global seaborne iron ore supply from a single origin point. The Pilbara region collectively, including BHP and Rio Tinto, represents the dominant share of global seaborne supply, a geographic concentration that gives Australian producers collective pricing influence that individual volume figures alone do not fully capture.
Competitive Positioning Among Major Exporters
| Producer | Annual Iron Ore Shipments (Approx.) | Primary Export Hub |
|---|---|---|
| Rio Tinto | ~320–330 million tonnes | Dampier and Cape Lambert |
| BHP | ~260–280 million tonnes | Port Hedland and Port Walcott |
| Fortescue | ~200 million tonnes | Port Hedland |
In absolute volume terms, Fortescue sits third among the Pilbara majors. What this comparison does not capture is the rate of capacity growth relative to starting points. Both BHP and Rio Tinto expanded their Pilbara operations over decades, incrementally adding infrastructure to established platforms. Fortescue built its entire production, rail, and port export system from greenfield status and crossed the 200 million tonne threshold within 18 years of first shipment. For context, the largest iron ore mines globally reflect just how capital-intensive and time-consuming such operational scale typically is to achieve.
The Financial Geometry of 200 Million Tonnes
Price Sensitivity at Scale
One of the most practically important implications of operating at this volume level is the amplification of iron ore price movements on revenue outcomes. At 200 million tonnes of annual shipments, every US$1 per tonne movement in the iron ore price generates approximately US$200 million in gross revenue impact. This price leverage works symmetrically: a US$10/tonne upswing adds US$2 billion in gross revenue, while an equivalent downswing removes the same amount.
This dynamic makes Fortescue's cost per tonne shipped an increasingly important strategic variable. Maintaining a low C1 cash cost per tonne provides a buffer that allows the operation to remain cash generative through the down phases of iron ore price cycles, which have historically been both significant and unpredictable in duration.
Iron Ore Funding the Energy Transition
Fortescue has committed substantial capital to green energy and green hydrogen initiatives as part of its broader corporate diversification. The financial foundation for these investments derives directly from iron ore cash flows. At a 200 million tonne annual run rate, sustained iron ore revenues provide the capacity to fund exploratory and capital-intensive energy transition projects that would not be commercially viable in isolation at their current stage of development.
The sustainability of this cross-subsidy model depends on two variables: iron ore price stability and the maintenance of shipment volumes at or above current levels. A sustained price downturn of meaningful magnitude would force capital allocation trade-offs between sustaining iron ore infrastructure investment and funding energy transition ambitions.
The next major ASX story will hit our subscribers first
Demand-Side Variables: What Could Challenge the Run Rate
Chinese Steel Consumption as the Governing Factor
China accounts for approximately 70 percent of global seaborne iron ore imports, making Chinese steel production the primary demand variable for any Pilbara exporter operating at scale. Fortescue's 200 million tonne annual throughput is predicated on continued Chinese import demand at levels consistent with current steel production patterns. The broader iron ore demand prospects therefore remain closely tied to how Chinese industrial policy evolves over the coming years.
Several structural forces could alter this demand picture over the medium term:
-
Property sector contraction in China has reduced steel-intensive construction activity, a trend that could structurally lower iron ore import requirements below recent historical averages.
-
Electric arc furnace adoption in Chinese steel production uses scrap metal rather than iron ore as the primary input. A shift toward EAF-based steelmaking would reduce per-tonne iron ore intensity in Chinese steel output.
-
Infrastructure spending cycles driven by Chinese government stimulus programs have historically provided demand support during periods of property sector weakness, though the magnitude and duration of such programs is inherently uncertain.
However, China steel and iron ore market dynamics remain complex, with competing forces of stimulus spending and structural demand shifts creating an uncertain outlook for import volumes beyond the near term.
Supply-Side Risks: Is 200 Million Tonnes a Ceiling?
Fortescue's FY2026 guidance range of 195 to 205 million tonnes positions 200 million tonnes as a midpoint rather than an upper ceiling. Upside to volumes would require one or more of the following:
-
Mine site expansion approvals and capital investment to increase ore production above 238.9 million tonnes annually.
-
Port capacity upgrades at Port Hedland, noting that tidal constraints and shared infrastructure create natural throughput limits.
-
Rail network throughput improvements to reduce transit time from mine sites to port.
Downside risks to sustaining the run rate include cyclone season disruptions in the Pilbara, equipment reliability across an aging but expanding asset base, and labour availability in a Western Australian mining workforce market that periodically tightens during commodity upswings.
Operational Culture as a Competitive Variable
CEO Dino Otranto has publicly framed the 200 million tonne milestone as a product of organisational agility, workforce empowerment, and an operational philosophy that prioritises fast decision-making and backing internal talent over process bureaucracy. This cultural positioning is strategically relevant beyond its motivational framing.
In an industry where large capital projects routinely experience cost overruns and schedule delays, a management culture that demonstrably executes against volume targets at the upper end of guidance ranges carries real commercial value. Consistent delivery against guidance builds investor confidence in forward estimates, reducing the risk premium that markets attach to guidance uncertainty.
The distinction between a company that regularly hits the upper band of its guidance range versus one that routinely misses midpoint targets is not trivial in resources equity markets. Over multiple cycles, consistent delivery compounds into a structural re-rating of management credibility.
Frequently Asked Questions
When did Fortescue first export iron ore?
Fortescue's inaugural iron ore shipment departed Port Hedland in May 2008, beginning an export program that has since become one of the highest-volume single-origin iron ore supply chains globally.
What is Fortescue's total lifetime iron ore shipment figure?
As of the June 2026 milestone confirmation, Fortescue's cumulative lifetime shipments have exceeded 2.5 billion metric tons across all operating years since 2008.
What was the previous single-year shipment record?
The prior record was set in FY2025, when Fortescue shipped 198.4 million metric tons, which represented the upper boundary of its guidance range for that period.
What is Fortescue's FY2026 shipment guidance?
Fortescue has guided for 195 to 205 million tonnes for the fiscal year ending June 2026. The Fortescue 200 million metric tons of iron ore milestone was formally achieved on June 23, 2026.
How does Fortescue compare in volume to BHP and Rio Tinto?
BHP ships approximately 260 to 280 million tonnes annually and Rio Tinto approximately 320 to 330 million tonnes, placing Fortescue third among Pilbara majors by volume but first by rate of capacity growth from a greenfield starting point.
Why is Port Hedland critical to Fortescue's export operations?
Port Hedland is the world's largest bulk commodity export terminal and the sole gateway for Fortescue's iron ore seaborne supply chain. Three ship loaders operating simultaneously at the terminal enable continuous vessel loading across a program of more than 1,000 vessel departures annually.
Key Takeaways
-
Volume confirmed: Fortescue 200 million metric tons of iron ore shipped in a single year for the first time, achieved June 23, 2026.
-
Cumulative scale: More than 2.5 billion tonnes shipped since the first vessel departed Port Hedland in May 2008.
-
Infrastructure depth: Over 1,000 vessel movements annually managed across three concurrent ship loaders at the world's largest bulk export terminal.
-
Market share: Fortescue's output represents approximately 12 to 13 percent of total global seaborne iron ore supply.
-
Financial leverage: Each US$1 per tonne movement in iron ore price generates roughly US$200 million in gross revenue impact at current volumes.
-
Demand risk: Approximately 70 percent of global seaborne iron ore imports flow to China, making Chinese steel production dynamics the primary external variable governing sustainable export volumes.
-
Forward guidance: FY2026 shipment guidance of 195 to 205 million tonnes positions 200 million tonnes as a sustainable operational midpoint, not a one-time peak.
This article is intended for informational purposes only and does not constitute financial or investment advice. Forecasts, guidance ranges, and market projections referenced herein involve inherent uncertainty and actual outcomes may differ materially from those described.
Want to Stay Ahead of the Next Major ASX Mineral Discovery?
While Fortescue's 200-million-tonne milestone demonstrates the extraordinary returns that large-scale resource operations can generate, the earliest and most significant gains in mining investment often emerge at the discovery stage — and Discovery Alert's proprietary Discovery IQ model delivers real-time alerts the moment significant ASX mineral discoveries are announced, turning complex data across 30-plus commodities into clear, actionable insights. Explore historic examples of major discovery returns and begin your 14-day free trial to position yourself at the forefront of the next significant find.