June 19, 2026
When Dividends Drive the Decision: Evaluating Fortescue as a Passive Income Vehicle
Iron ore has long occupied a unique position in the global commodities landscape. Unlike industrial metals that serve dozens of end-use applications, iron ore demand is driven overwhelmingly by a single downstream process: steelmaking. This concentration creates a peculiar investment dynamic where a miner's shareholder returns can swing dramatically based on the construction ambitions of one country. For income investors considering Fortescue Ltd (ASX: FMG), understanding this dynamic is not optional — it is foundational. The question of Fortescue passive income from a $10,000 investment demands more than a simple yield calculation. It requires a clear-eyed assessment of commodity cycles, tax mechanics, and analyst sentiment before a single dollar is committed.
When big ASX news breaks, our subscribers know first
Fortescue's Standing as an ASX Dividend Heavyweight
Fortescue occupies a distinctive corner of the Australian sharemarket. As one of the world's largest iron ore producers by volume, it has delivered shareholder distributions that have at times exceeded the yields of major Australian banks — a benchmark sector for domestic income investors. Its scale, operating from the Pilbara region of Western Australia, gives it a low-cost production profile that translates more directly into distributable earnings than many of its global peers.
The company's dividend history across the past decade reflects the inherent volatility of resource-linked income. Payouts have surged during commodity booms and contracted sharply when iron ore price trends reversed. This means Fortescue is not a bond proxy — it is a commodity-linked income stream, and investors who treat it as the former take on risks they may not fully appreciate.
What distinguishes Fortescue from many global mining peers, from an Australian investor's perspective, is its status as a fully franked dividend payer. This single characteristic can significantly alter the after-tax return profile for resident investors in ways that make direct yield comparisons to unfranked alternatives misleading.
How Iron Ore Pricing Connects Directly to Shareholder Distributions
The mechanics of Fortescue's earnings model are relatively straightforward, and that simplicity is both its appeal and its risk. Iron ore is priced in US dollars per tonne on international markets, with the benchmark price for 62% Fe content fines serving as the primary reference point for most Australian producers.
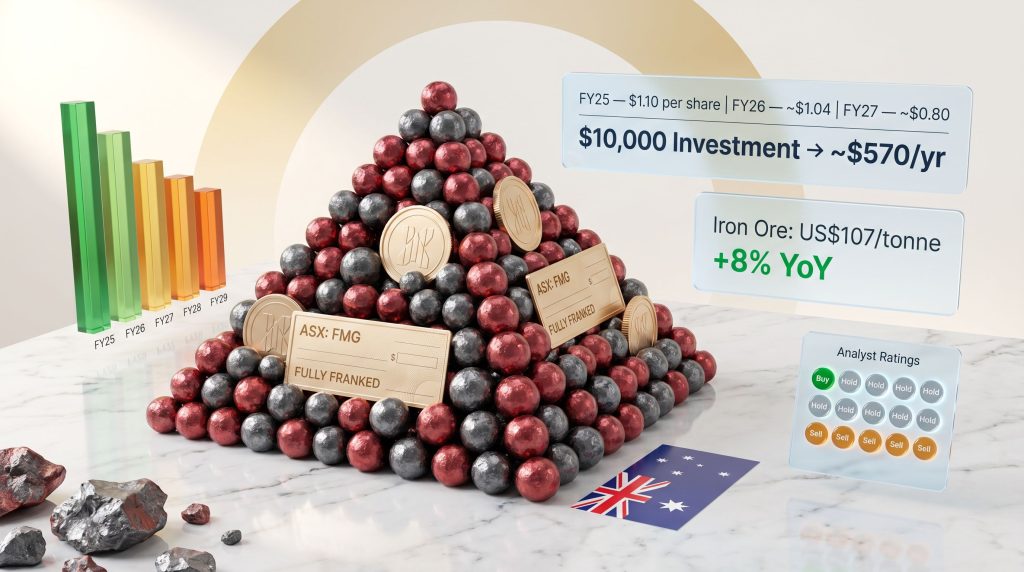
As of early May 2026, iron ore was trading at approximately US$107 per tonne, reflecting an 8% increase compared to the same period one year prior, according to data from Trading Economics. This price level sits at a meaningful premium to Fortescue's estimated cash cost of production per tonne, which the company has historically targeted at well below US$20 per tonne in C1 cash costs, meaning the gap between revenue and direct operating cost is substantial.
This is where the concept of operating leverage becomes critical for dividend investors to understand. Because Fortescue's fixed cost base does not scale proportionally with iron ore prices, every incremental dollar of price improvement above the break-even threshold flows almost entirely into earnings. A US$10 rise in iron ore price does not merely improve margins — it dramatically expands the pool of cash available for distribution.
Iron ore price movements above a producer's break-even point create disproportionate earnings leverage. For high-volume, low-cost miners, a relatively modest shift in commodity prices can produce outsized changes in free cash flow and, by extension, dividend capacity.
Key Macro Risks That Could Suppress Future Payouts
The same leverage that amplifies income in rising markets works equally in reverse. Furthermore, the China steel and iron ore market represents a critical variable that income investors should monitor carefully, along with the following risk factors:
-
Chinese construction activity: China accounts for the overwhelming majority of global seaborne iron ore demand. Any sustained slowdown in residential construction, infrastructure investment, or steel mill operating rates translates almost immediately into weaker pricing and compressed margins.
-
Currency dynamics: Iron ore revenues are earned in US dollars, but Fortescue reports and distributes dividends in Australian dollars. A strengthening Australian dollar erodes the AUD-equivalent value of every tonne sold, even if the USD iron ore price holds steady.
-
Trade policy and export disruptions: While iron ore has historically been insulated from bilateral trade tensions compared to other Australian commodities, the evolving landscape around tariffs and iron ore markets creates ongoing uncertainty around commodity trade flows.
-
Capital allocation priorities: Fortescue has been investing heavily in its green energy and technology initiatives, which compete with dividend distributions for available cash. The balance between growth investment and shareholder returns is a live variable that directly shapes payout ratios.
What Fortescue Passive Income Looks Like on a $10,000 Investment
Projected Dividends Across FY25, FY26, and FY27
The following table presents the dividend projections underpinning the Fortescue passive income from a $10,000 investment analysis, based on Commsec analyst consensus data published in early May 2026:
| Financial Year | Dividend Per Share | Grossed-Up Yield (incl. Franking) | Est. Annual Income on $10,000 |
|---|---|---|---|
| FY25 (Actual) | $1.10 | ~7.9% | ~$790 |
| FY26 (Forecast) | ~$1.04 | ~7.4% | ~$740 |
| FY27 (Forecast) | ~$0.80 | ~5.7% | ~$570 |
Note: Yield figures incorporate the value of franking credits attached to Fortescue's fully franked dividends. Returns will vary based on entry price, individual tax position, and whether dividends are reinvested. Forecasts are analyst estimates, not guaranteed outcomes.
The trajectory here is clear and worth internalising: while Fortescue's FY25 dividend delivered a grossed-up yield approaching 8%, the forward earnings curve projects a meaningful compression by FY27. A ~27% reduction in per-share distributions between FY25 actual and FY27 forecast represents a material step-down for income-focused investors anchoring to historical payout levels. For context, this passive income analysis from Motley Fool Australia explores similar projections in further detail.
The Mechanics of Fully Franked Dividends
For Australian resident investors unfamiliar with the imputation system, understanding the franking benefits of dividends is one of the most tax-efficient features of domestic equity investing and deserves careful explanation.
When Fortescue earns a profit, it pays Australian corporate tax at a rate of 30% before distributing the remainder to shareholders. Fully franked dividends carry an attached credit representing this tax already paid. Australian resident shareholders can then use these franking credits to offset their personal income tax liability.
Here is how the grossing-up calculation works in practice:
-
Fortescue declares a cash dividend of, say, $0.80 per share (the projected FY27 dividend)
-
The attached franking credit is calculated as: $0.80 × (30/70) = approximately $0.34 per share
-
The grossed-up dividend (the amount treated as taxable income) becomes: $0.80 + $0.34 = $1.14 per share
-
An investor on a 37% marginal tax rate would owe tax on $1.14 at their rate, but then subtract the $0.34 franking credit, resulting in a net personal tax liability on that dividend income
-
For investors whose marginal tax rate is below 30%, such as those in the 19% bracket or within a superannuation fund taxed at 15%, the excess franking credits can generate a cash refund from the Australian Taxation Office
The franking credit system is especially powerful for self-managed superannuation fund (SMSF) investors in pension phase, who pay zero tax on investment income. For these investors, every franking credit becomes a direct cash refund, significantly boosting the effective yield above what face dividend figures suggest.
This dynamic makes Fortescue's fully franked dividends particularly compelling for SMSF trustees and retirees, while also being meaningful for investors across most Australian marginal tax brackets.
Step-by-Step: Calculating Your Own Passive Income Estimate
For investors wanting to model their own Fortescue passive income from a $10,000 investment or any other amount, the process involves five distinct steps:
-
Establish your capital base: Determine the total dollar amount you intend to invest (e.g., $10,000)
-
Identify the forward yield: Use the current or forecast grossed-up yield, such as the projected ~5.7% for FY27, as the return assumption
-
Calculate gross income: Multiply your investment by the yield ($10,000 × 0.057 = ~$570 estimated gross annual passive income)
-
Apply your marginal tax rate: Adjust the grossed-up income for your personal tax rate and franking credit position to determine net cash received
-
Factor in capital movement: Remember that share price changes — either gains or losses — form part of total return alongside income. Yield alone does not tell the full investment story
How Much Capital Is Needed to Generate $10,000 Per Year in Passive Income?
For investors with a specific income target, the analysis runs in reverse. Rather than starting with a capital figure and projecting income, the question becomes: how much capital does $10,000 of annual Fortescue passive income require?
| Target Annual Passive Income | Yield Assumption | Estimated Capital Required |
|---|---|---|
| $10,000/year | 6.0% (mid-range trailing basis) | ~$167,875 |
| $10,000/year | 8.55% (higher historical yield scenario) | ~$117,000 |
| $10,000/year | 8.9% (peak yield scenario) | ~$112,360 |
The range between these scenarios is significant. An investor who purchased Fortescue shares during a period of elevated yield, locking in an effective grossed-up return above 8%, requires substantially less capital to reach a $10,000 annual income threshold than a new investor entering today at lower forward yield projections.
This illustrates a principle that experienced dividend investors understand intuitively: entry price is the most powerful lever in income investing. The yield you lock in at purchase remains your personal benchmark regardless of where the market price moves afterward. In addition, Australia's iron ore advantages as a low-cost producer help underpin the sustainability of these distributions relative to global peers.
Two Investor Scenarios Compared
Investor A (Historical Buyer): Purchased Fortescue shares at a lower price point, securing an effective grossed-up yield on cost above 8.5%. For this investor, the projected FY27 dividend still represents a yield-on-cost well above current market rates, making continued ownership arguably compelling from a pure income perspective even as forward estimates decline.
Investor B (New Entrant at Current Prices): Investing $10,000 at today's share price with a FY27 forecast yield of approximately 5.7% grossed-up generates around $570 in estimated annual passive income. While not negligible, this return must be assessed against the context of a declining dividend trajectory, analyst sentiment, and alternative ways to earn passive income available in the current market.
What the Analyst Community Says About Fortescue Right Now
Broker Consensus: A Heavily Skewed Distribution
The professional analyst community's current view on Fortescue is notably cautious. Based on Commsec consensus data from early May 2026, the breakdown across 17 covering analysts is as follows:
| Analyst Rating | Number of Analysts |
|---|---|
| Buy | 1 |
| Hold | 9 |
| Sell | 7 |
| Total Coverage | 17 |
With just one buy rating out of seventeen, the consensus leans decisively toward caution. A rating distribution this skewed toward hold and sell typically signals one of two conditions: either the market has priced in near-term expectations adequately, leaving limited upside to analysts' target prices, or the risk profile is considered elevated relative to the prospective return.
For Fortescue specifically, both factors appear relevant. The combination of a declining dividend forecast, moderating earnings expectations, and the capital demands of the company's energy transition ambitions creates a backdrop where the income thesis becomes harder to sustain at current valuations.
When fewer than 10% of covering analysts rate a stock as a buy, income-focused investors should seriously evaluate whether the yield on offer compensates adequately for both the earnings risk and the implied valuation risk embedded in the share price.
Understanding Valuation Risk Beyond the Yield Number
A common trap for dividend investors is treating a high yield as inherently attractive without considering what the yield implies about market expectations. A rising grossed-up yield can reflect genuine income generation, or it can reflect a falling share price as the market anticipates dividend cuts ahead.
For Fortescue, the analyst consensus pointing toward hold and sell ratings suggests that at current price levels, the forward dividend does not compensate sufficiently for the risks attached. This is particularly important given the projected step-down from ~$1.04 per share in FY26 to ~$0.80 per share in FY27, a reduction of approximately 23% in annual distribution value.
The next major ASX story will hit our subscribers first
Weighing the Case For and Against FMG as a Passive Income Holding
Reasons the Income Case Has Merit
- Fortescue's fully franked dividends provide genuine tax efficiency for Australian resident investors, particularly those in superannuation structures
- The company's low-cost Pilbara operations provide a meaningful buffer against iron ore price declines before dividends are threatened
- Iron ore is currently trading at levels that, if sustained, would support continued cash generation capable of funding near-term dividend commitments
- Fortescue maintained dividend payments through the COVID-19 disruption period of 2020, demonstrating a degree of capital discipline through market volatility
Reasons for Caution
- The dividend per share is forecast to decline by roughly 23% between FY26 and FY27, a trajectory that erodes the income case progressively
- Just one of seventeen covering analysts currently rates the stock as a buy, suggesting limited near-term upside conviction from the professional investment community
- Single-commodity exposure to iron ore creates earnings volatility directly tied to Chinese economic activity, a factor outside any Australian investor's influence
- Capital expenditure associated with Fortescue's green energy and technology initiatives may compete with dividend distributions for available free cash flow
Key Metrics at a Glance: Fortescue Passive Income Summary
| Metric | Data Point |
|---|---|
| Iron Ore Price (approx.) | ~US$107/tonne (+8% YoY) |
| FY25 Actual Dividend Per Share | $1.10 |
| FY26 Forecast Dividend Per Share | ~$1.04 |
| FY27 Forecast Dividend Per Share | ~$0.80 |
| FY27 Grossed-Up Forward Yield | ~5.7% |
| Estimated FY27 Income on $10,000 | ~$570 (incl. franking credits) |
| Capital Required for $10,000/yr Income | ~$112,360 to ~$167,875 |
| Analyst Buy Ratings (of 17) | 1 |
| Dividend Franking Status | Fully Franked |
Frequently Asked Questions: Fortescue Dividends and Passive Income
How much passive income does a $10,000 investment in Fortescue generate in FY27?
Based on current analyst consensus forecasts, a $10,000 investment in Fortescue shares is projected to deliver approximately $570 in annual passive income in FY27, inclusive of the value of fully franked dividend imputation credits. This figure assumes the investment is made at or near current share prices and that the forecast dividend of approximately $0.80 per share is realised.
Does Fortescue pay fully franked dividends?
Yes. Fortescue's dividends carry full franking, meaning Australian resident shareholders receive imputation credits reflecting the 30% corporate tax already paid by the company on its profits. These credits can offset personal income tax liabilities or, in some cases, generate tax refunds for investors with marginal rates below 30%.
How frequently does Fortescue pay dividends?
Fortescue typically distributes dividends twice per financial year: an interim dividend paid mid-year and a final dividend following the full-year results. This semi-annual cadence provides investors with two income events per year rather than a single annual payment.
Why are FY27 dividend forecasts lower than FY26?
Analyst forecasts reflect expectations of moderating earnings, influenced by iron ore price assumptions, the company's ongoing capital expenditure requirements, and payout ratio considerations. The projected decline from approximately $1.04 per share in FY26 to approximately $0.80 per share in FY27 represents a reduction of roughly 23% in annual distribution value. Investors should treat these as probabilistic estimates rather than guaranteed outcomes.
Is Fortescue a strong buy for passive income investors currently?
Broker consensus data suggests significant caution, with only 1 of 17 covering analysts assigning a buy rating as of early May 2026. Income investors should carefully evaluate the declining dividend trajectory, the concentration risk of single-commodity exposure, and the valuation implied by the current share price before committing new capital. Consulting a licensed financial adviser is recommended before making any investment decision.
This article contains general information only and does not constitute financial advice. All investment decisions should be made in consideration of your personal financial circumstances and in consultation with a qualified financial adviser. Past dividend payments are not a reliable indicator of future distributions. Analyst forecasts referenced are consensus estimates and are subject to revision. Franking credit benefits vary depending on individual tax positions and applicable legislation.
Want to Discover ASX Mining Opportunities Before the Broader Market?
While Fortescue offers a well-understood income stream tied to iron ore cycles, significant wealth in the resources sector has historically been built through identifying major mineral discoveries early — explore Discovery Alert's dedicated discoveries page to see how historic ASX discoveries have generated extraordinary returns, powered by the proprietary Discovery IQ model. Begin your 14-day free trial today and position yourself ahead of the market with real-time alerts on significant ASX mineral discoveries delivered directly to your inbox.