
May 15, 2026
How Geopolitical Tensions Reshape Global Nickel Market Dynamics
Complex geopolitical developments create cascading effects across interconnected commodity markets, with regional conflicts triggering supply chain vulnerabilities that extend far beyond immediate geographic boundaries. The intricate web of global resource dependencies means that localized disruptions can rapidly transform market structures, forcing industry participants to reassess fundamental assumptions about supply security and pricing mechanisms. The Iran war and Indonesia's nickel mining quotas demonstrate how mining industry evolution continues to be shaped by geopolitical factors and strategic policy decisions.
When big ASX news breaks, our subscribers know first
Middle East Conflict Creates Critical Supply Chain Vulnerabilities
The Iran war, which commenced on February 28, 2026, demonstrates how regional conflicts rapidly propagate through global commodity networks. Within approximately six weeks of the conflict's onset, market participants observed substantial price movements across multiple metal categories. Three-month nickel futures on the London Metal Exchange registered $18,250 per tonne on April 15, 2026, following a 2.9% surge the previous trading session.
Gold markets reflected similar volatility patterns, climbing to approximately $4,839 per ounce by mid-April 2026 before moderating to $4,808 per ounce at London midday trading. The precious metals complex experienced an 8% decline from conflict initiation through mid-April, illustrating how geopolitical developments create both initial safe-haven demand and subsequent profit-taking dynamics.
Bullion-backed ETFs accumulated approximately 25 tonnes during April 2026, reversing 94-tonne outflows recorded in March 2026. This rapid shift in investment flows demonstrates how geopolitical uncertainty alters institutional asset allocation patterns within monthly timeframes. Furthermore, these developments highlight the interconnected nature of global markets where regional conflicts can rapidly influence mining market perspectives.
Indonesia's Strategic Production Controls Signal Market Maturation
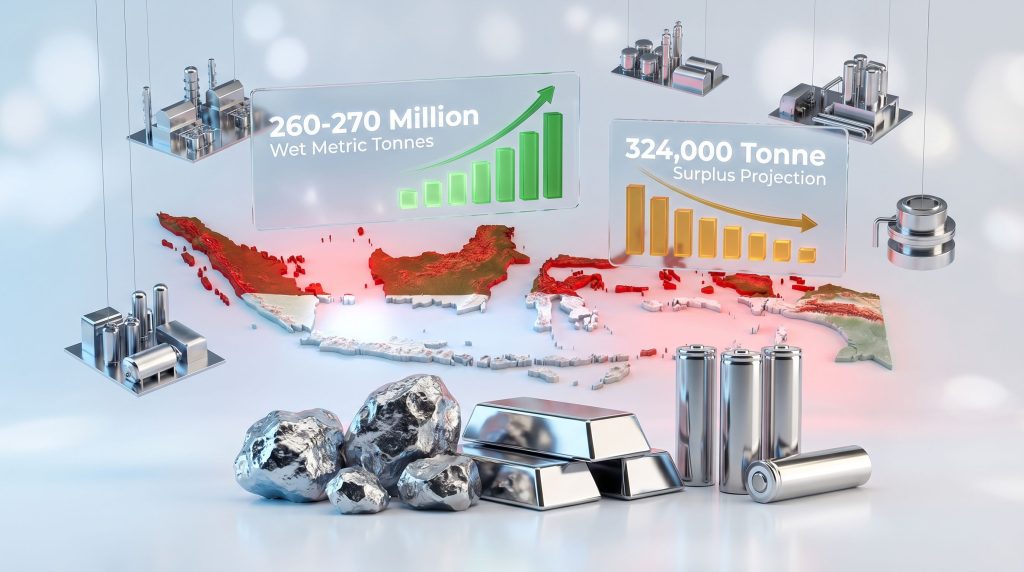
Indonesia's approach to nickel ore quota management reflects a sophisticated understanding of global market dynamics and domestic processing capacity optimization. The archipelago nation reduced its 2026 nickel ore mining quota to 260-270 million wet metric tonnes, representing a dramatic 28.8% to 31.4% reduction from the previous year's 379 million WMT allocation.
This policy adjustment occurs alongside refined nickel output growth projections of 9.8% in 2026 following 9% growth in 2025. The apparent contradiction between constrained raw material extraction and expanded processing capacity reflects Indonesia's vertical integration strategy, designed to capture greater value-added production while managing global supply conditions.
Standard Chartered's Global Head of Commodities Research emphasized that policy uncertainty will remain central to precious metals trajectories through 2026, with competing inflation and growth risks creating complex dynamics for monetary policy responses. Additionally, these quota restrictions align with broader critical minerals demand surge trends affecting global supply chains.
What Makes Indonesia's Mining Quota Strategy Economically Significant?
Indonesia's quota management represents more than simple supply constraint; it signals the evolution from frontier commodity production toward strategic resource governance. The progression from 379 million WMT quotas in 2024 to 260-270 million WMT in 2026 demonstrates systematic policy tightening designed to optimize domestic value capture while maintaining global market influence.
Production Cap Analysis: 260-270 Million Wet Metric Tonnes Framework
The quota reduction magnitude exceeds typical annual policy adjustments, suggesting fundamental recalibration of Indonesia's mining sector strategy. Historical utilization patterns reveal persistent gaps between permitted quotas and actual production levels:
Indonesia Nickel Ore Quota Evolution
| Year | Quota (Million WMT) | Actual Production | Utilization Rate |
|---|---|---|---|
| 2024 | 379 | 295 | 78% |
| 2025 | 320 | 285 | 89% |
| 2026 | 260-270 | TBD | Projected 95%+ |
The 2024 utilization rate of 78% indicates that market conditions, operational constraints, or strategic production management prevented full quota utilization. The improvement to 89% utilization in 2025 suggests enhanced capacity utilization despite reduced permitted levels. If 2026 achieves projected 95%+ utilization with a midpoint quota of 265 million WMT, actual output would approximate 251.75 million WMT, representing an 11.7% reduction compared to 2025 actual production.
Historical Quota Performance vs. Actual Output Patterns
The persistent 22% gap between 2024 quotas and actual production reveals multiple operational realities affecting mining output. Ore quality variations, equipment downtime, environmental compliance requirements, and strategic production timing in response to price conditions all contribute to this utilization gap.
BMI research indicates that Indonesia's quota decisions have improved market sentiment, providing psychological support to price formation despite broader global oversupply conditions. The research organization noted that while geopolitical developments will continue influencing market sentiment, nickel price outlook through 2026 remains dominated by Indonesian supply-side dynamics rather than external geopolitical factors.
Smelter Capacity Utilization Under New Constraints
Indonesia's refined nickel capacity expansion occurs independent of ore production quotas, reflecting vertical integration priorities. This approach potentially allows Indonesia to source ore internationally while controlling processed output through domestic smelter development. The strategy positions Indonesia to capture greater value-added production margins while maintaining global market influence through processing capacity rather than raw material volume alone.
BMI emphasizes that over the medium to long term, Indonesia represents the largest source of uncertainty for the refined nickel market, with the speed of refined nickel capacity scaling determining global market supply conditions over the coming decade.
Why Sulphur Supply Disruptions Threaten Nickel Processing Economics
The Iran war exposed critical vulnerabilities in Indonesia's nickel processing supply chain, revealing how secondary input dependencies can disrupt primary commodity production. Over 67% of Indonesia's sulphur imports originate from Middle Eastern suppliers, creating concentrated geographical risk that recent conflicts have activated.
HPAL Operations Dependency on Middle Eastern Sulphur Imports
High-pressure acid leach (HPAL) operations require consistent sulphur supply for generating the sulphuric acid essential to battery-grade nickel production from laterite ores. Sulphur dioxide oxidation produces sulphuric acid in HPAL facilities, creating a direct proportional relationship between sulphur availability and processing throughput capacity.
Reuters reported that sulphur shortages caused by the Iran war forced several Indonesian nickel processors to curtail output by at least 10% beginning in mid-March 2026. The phrase "at least 10%" suggests actual reductions could substantially exceed this conservative floor estimate. If applied across Indonesia's 285 million WMT actual production in 2025, a 10% cut would eliminate 28.5 million WMT of annual output.
Cost Structure Impact: Input Price Volatility Analysis
Sulphur supply tightening flows directly into HPAL operating cost structures, where sulphur typically represents a material component of production expenses. When supply constraints emerge and prices spike, cash costs per tonne of nickel processed increase substantially. For marginal producers operating with thin cost-of-production spreads, sulphur price volatility can eliminate positive cash flow margins.
BMI noted that higher energy costs linked to the conflict add additional pressure, particularly for higher-cost operations outside Indonesia. This distinction separates direct sulphur supply constraints from secondary energy cost pressures, creating multiple transmission channels for geopolitical disruption effects.
Alternative Sourcing Strategies and Timeline Constraints
Over 67% of Indonesia's sulphur imports originate from Middle Eastern suppliers, creating a structural vulnerability that recent conflicts have exposed. HPAL facilities require consistent sulphur supply for acid leaching processes essential to battery-grade nickel production.
The production cuts commenced within 2-3 weeks of the conflict onset, indicating rapid supply chain transmission of geopolitical disruption. This timeline suggests limited inventory buffers and constrained alternative sourcing capabilities among Indonesian processors during supply emergencies.
The critical question remains whether Indonesian producers successfully implemented alternative sulphur sourcing from non-Middle Eastern suppliers, and if so, at what cost premium and logistical timeline. The Northern Miner reports that market concentration effects depend significantly on whether all producers reduced output proportionally or some maintained higher operating rates through superior supply chain diversification.
How Battery Technology Shifts Influence Long-Term Nickel Demand
Structural changes in battery chemistry preferences create fundamental headwinds for nickel-intensive applications, even as broader clean energy transitions support overall metal demand. The increasing adoption of lithium iron phosphate batteries erodes demand for nickel-intensive chemistries, creating a technology-driven demand constraint that operates independently of macroeconomic conditions. However, the energy transition in mining continues to drive overall demand for critical minerals.
Lithium Iron Phosphate vs. Nickel-Rich Chemistry Market Share
Global nickel demand growth is projected to decelerate to approximately 3% in 2026, down from 5.8% in 2025. This represents a 48% reduction in year-over-year demand growth rates, with BMI attributing this slowdown partially to battery chemistry mix shifts that will keep sentiment subdued and temper nickel demand growth despite broader macro tailwinds.
The technology shift represents a critical insight where microstructural changes in end-use technology can override macroeconomic demand drivers. BMI suggests that battery chemistry shifts toward lithium iron phosphate represent a structural headwind that suppresses nickel demand even when broader macroeconomic conditions would otherwise support increased consumption.
Electric Vehicle Manufacturer Sourcing Strategy Evolution
Electric vehicle manufacturers increasingly prioritize cost optimization and supply chain security over maximum energy density, driving adoption of lithium iron phosphate chemistries for specific vehicle segments. This strategic shift affects long-term nickel demand projections as automakers balance performance requirements against material cost and supply chain risk considerations.
Demand fundamentals remain anchored by stainless steel production and clean energy transition applications, particularly electric vehicles and renewable energy systems. Mainland China is expected to remain the largest source of demand growth, though at a slower pace than recent years.
Energy Storage System Material Requirements Forecasting
Grid-scale energy storage systems represent a growing application for battery technologies, with material selection driven primarily by cost-effectiveness and cycle life rather than energy density optimization. This application segment increasingly favors lithium iron phosphate chemistries, further reducing nickel-intensive battery demand in the energy storage market.
The next major ASX story will hit our subscribers first
What Global Market Surplus Conditions Mean for Price Discovery
Indonesia's production capacity expansion will widen the global market surplus modestly to approximately 324,000 tonnes, limiting sustained price rally potential despite geopolitical support factors. This surplus condition creates a fundamental tension between supply-driven oversupply and geopolitically-driven price support mechanisms.
324,000 Tonne Surplus Projection: Supply-Demand Balance Analysis
Global Nickel Market Balance Projections
| Metric | 2025 | 2026 | 2027 |
|---|---|---|---|
| Global Surplus (tonnes) | 280,000 | 324,000 | 195,000 |
| Average Price ($/tonne) | $15,800 | $16,600 | $16,700 |
| Demand Growth Rate | 5.8% | 3.0% | 4.2% |
BMI projects a gradual narrowing of the surplus as demand climbs supported by stainless steel growth and clean energy acceleration. The research organization forecasts nickel prices could average $16,700 in 2027, rising to $19,000 by 2030 and reaching $22,000 by 2032 as the market transitions into deficit conditions.
Regional Production Cost Curve Implications
The persistent global surplus suggests that marginal production costs remain below current price levels, creating downward pressure on price discovery mechanisms. Higher-cost operations outside Indonesia face particular pressure from both surplus conditions and elevated input costs related to geopolitical disruptions.
Regional cost curve positioning becomes increasingly important as Indonesian capacity expansion potentially displaces higher-cost production in other jurisdictions. This displacement effect could accelerate surplus reduction if marginal producers reduce output in response to sustained price pressure. Additionally, the US-China trade war impact continues to influence global commodity pricing mechanisms.
Inventory Management Strategies Across Major Markets
Surplus market conditions require sophisticated inventory management approaches, with producers, consumers, and intermediaries balancing storage costs against price volatility risks. The geopolitical premium embedded in current pricing creates additional complexity for inventory optimization strategies.
Financial market participants must navigate the tension between fundamental oversupply conditions and geopolitical risk premiums that may persist independently of supply-demand balance calculations.
How Stainless Steel Demand Patterns Drive Industrial Nickel Consumption
Stainless steel production represents the largest end-use application for nickel consumption globally, with demand patterns driven by infrastructure development, manufacturing sector expansion, and export market dynamics. Industrial consumption patterns differ substantially from battery-related demand in terms of price sensitivity, substitution possibilities, and geographic concentration.
China's Manufacturing Sector Expansion Impact
Mainland China's role as the largest source of nickel demand growth continues, though at a decelerated pace compared to previous expansion cycles. Chinese stainless steel production responds to both domestic infrastructure requirements and export market opportunities, creating demand volatility based on trade conditions and domestic economic activity levels.
Manufacturing sector health in China directly influences stainless steel consumption patterns, with industrial equipment, construction applications, and consumer appliance production representing major demand categories. Economic growth deceleration in China contributes to the projected 3% global nickel demand growth in 2026, down from higher historical rates.
Infrastructure Development Project Material Requirements
Large-scale infrastructure projects require substantial stainless steel quantities for construction applications, transportation systems, and industrial facilities. These projects typically feature long lead times and predictable material consumption patterns, providing more stable demand compared to consumer-oriented applications.
Infrastructure demand demonstrates lower price elasticity compared to consumer applications, supporting baseline nickel consumption even during price volatility periods. Government-sponsored infrastructure programs particularly influence demand stability and long-term consumption projections.
Export Market Dynamics for Stainless Steel Products
Global trade patterns for stainless steel products affect regional nickel consumption patterns, with export-oriented production concentrating nickel demand in manufacturing regions while consuming markets may not reflect direct nickel demand. Trade policy changes, tariff structures, and currency fluctuations influence these export-import relationships.
Export market competitiveness depends partly on input material costs, including nickel prices, creating feedback mechanisms between global nickel markets and regional stainless steel export performance.
What Investment Scenarios Emerge from Current Market Conditions?
The combination of Iran war disruptions and Indonesia's nickel mining quotas creates complex investment scenarios requiring sophisticated risk assessment and capital allocation strategies. Investors must navigate competing forces of geopolitical support factors and fundamental oversupply conditions while considering long-term technology transition effects on demand patterns.
Capital Allocation Strategies for Mining Operations
Mining companies face challenging capital allocation decisions amid conflicting market signals. Geopolitical price support encourages capacity expansion investment, while fundamental surplus conditions suggest caution regarding new project development. Regional cost curve positioning becomes critical for investment prioritization decisions.
Indonesian quota restrictions potentially support higher-cost operations in other jurisdictions by constraining lower-cost supply growth. This dynamic influences investment attractiveness for brownfield expansion and greenfield development projects outside Indonesia.
Nickel Price Forecast Scenarios
| Year | Conservative ($/tonne) | Base Case ($/tonne) | Optimistic ($/tonne) |
|---|---|---|---|
| 2027 | $15,200 | $16,700 | $18,500 |
| 2030 | $17,800 | $19,000 | $21,200 |
| 2032 | $20,500 | $22,000 | $24,800 |
Hedging Mechanisms for Price Volatility Management
Producers require sophisticated hedging strategies to manage price volatility while maintaining upside exposure to geopolitical premiums. Traditional hedging approaches must incorporate geopolitical risk assessment and potential supply disruption scenarios that could drive prices substantially above fundamental levels.
Financial instruments including futures, options, and structured products provide various risk management approaches, though geopolitical volatility creates additional complexity for hedge ratio optimization and duration selection.
Merger and Acquisition Activity in Nickel Sector
Industry consolidation opportunities emerge from the intersection of surplus market conditions and geopolitical volatility. Well-capitalised companies may pursue acquisition opportunities among distressed higher-cost producers, while strategic buyers seek vertical integration or geographical diversification benefits.
Indonesian quota restrictions potentially enhance the strategic value of processing assets relative to mining assets, influencing M&A valuations and strategic priorities. Companies with diversified geographical exposure and integrated value chains may command premium valuations during geopolitical uncertainty periods.
Why Energy Cost Escalation Affects Global Production Competitiveness
Energy represents a substantial component of nickel production costs, particularly for energy-intensive processes such as HPAL operations and smelting activities. The Iran war contributed to energy cost escalation globally, creating additional pressure beyond direct sulphur supply constraints.
Regional Energy Price Differential Analysis
Energy cost differentials between producing regions influence competitive positioning and capacity utilisation decisions. Indonesian operations benefit from relatively stable domestic energy costs, while operations in regions experiencing energy price volatility face margin pressure and potential production curtailment decisions.
Natural gas and electricity pricing volatility affects different processing technologies disproportionately, with HPAL operations requiring substantial energy inputs for maintaining operating temperatures and pressure conditions throughout the leaching process.
Operational Efficiency Optimisation Under Cost Pressure
Rising energy costs accelerate operational efficiency optimisation initiatives, including process automation, energy recovery systems, and alternative energy integration. Companies implementing efficiency improvements may maintain competitive positions despite broader cost inflation pressures.
Energy-efficient technologies and process optimisation become increasingly valuable during periods of sustained energy cost elevation, potentially altering long-term competitive advantages among producers with different technological approaches.
Renewable Energy Integration in Mining Operations
Renewable energy integration provides potential insulation from fossil fuel price volatility while supporting sustainability objectives increasingly important for ESG-focused investors and customers. Solar and wind power integration requires substantial capital investment but offers long-term cost stability.
Mining operations in regions with favourable renewable energy resources may develop competitive advantages through energy cost stability and reduced exposure to geopolitical energy market disruptions.
How Precious Metals Markets Reflect Broader Commodity Volatility
Precious metals markets function as both industrial commodities and financial assets, creating complex interactions with geopolitical developments that extend beyond direct supply-demand fundamentals. The Iran war demonstrates how regional conflicts propagate through global commodity markets with varying intensity across different metals.
Gold Price Performance During Geopolitical Uncertainty
Gold climbed as much as 1% to nearly $4,839 per ounce on April 16, 2026, as diplomatic progress eased immediate inflation concerns while maintaining underlying geopolitical risk premiums. The metal subsequently moderated to $4,808 per ounce at midday London trading, demonstrating rapid response to diplomatic developments.
The 8% decline from conflict initiation through mid-April illustrates how geopolitical premiums can reverse quickly when immediate escalation risks diminish. However, Standard Chartered's analysis emphasises that given the fragile ceasefire situation and focus on real yields, gold remains vulnerable to further volatility.
Silver Market Structural Deficit: Six-Year Trend Analysis
Silver rose 0.7% to $79.5 per ounce on April 15, 2026, though remaining 35% below its January 29, 2026 record high of $121.6 per ounce. The silver market approaches a sixth consecutive year of structural deficit, with the supply shortfall expected to widen to 46.3 million ounces in 2026 from 40.3 million ounces in 2025.
According to the World Silver Survey 2026, published by the Silver Institute and produced by Metals Focus, multiple factors shape silver's trajectory including sulphur shortages, liquidity squeeze risks in London vaults, and Iran war-related demand disruptions. Philip Newman, Managing Director at Metals Focus, noted that whilst lease rates in London have largely normalised, risks of another liquidity squeeze during 2026 remain elevated.
Cross-Commodity Investment Flow Patterns
Geopolitical developments create cross-commodity investment flows as investors adjust portfolio allocations based on risk assessment and relative value considerations. The reversal from 94-tonne outflows in March 2026 to 25-tonne inflows in April 2026 for bullion-backed ETFs demonstrates rapid institutional allocation changes.
These flow patterns influence price discovery mechanisms across commodity complexes, with safe-haven demand competing against industrial demand fundamentals in determining price levels and volatility patterns.
What Long-Term Price Trajectories Emerge from Current Fundamentals?
Long-term nickel price trajectories reflect the intersection of supply constraint policies, technology transition effects, and evolving geopolitical risk assessment. BMI projects market conditions transitioning from surplus to deficit as demand growth accelerates and supply constraints become more binding over the medium term.
2027-2030 Market Deficit Transition Scenarios
The projected transition from 324,000-tonne surplus in 2026 to deficit conditions by 2030 depends critically on the interaction between Indonesian capacity scaling and global demand acceleration. BMI forecasts average prices of $16,700 in 2027, rising to $19,000 by 2030 and $22,000 by 2032 as market balance shifts.
This transition timeline assumes continued technology adoption in clean energy applications offsetting battery chemistry shifts toward lithium iron phosphate. Stainless steel demand growth and emerging industrial applications provide additional demand support during the transition period.
Clean Energy Transition Impact on Demand Acceleration
Clean energy transition acceleration creates long-term nickel demand through electric vehicle adoption, renewable energy infrastructure, and grid-scale energy storage systems. Whilst battery chemistry evolution reduces nickel intensity per unit, overall market growth potentially compensates for per-unit reduction effects.
Electric vehicle market penetration rates, renewable energy deployment schedules, and energy storage system adoption determine the pace of clean energy-related nickel demand growth. These applications demonstrate different nickel intensity and substitution characteristics compared to traditional industrial uses.
Technology Disruption Risk Assessment for Nickel Applications
Technology disruption risks include further battery chemistry evolution, alternative materials development, and process innovation reducing nickel requirements in key applications. Solid-state battery development, alternative cathode chemistries, and recycling technology advancement represent potential demand disruption sources.
Conversely, new nickel applications in hydrogen production, advanced alloys, and emerging industrial processes could offset substitution effects in traditional applications. Technology trajectory uncertainty requires scenario-based analysis rather than linear demand projection approaches.
How Regulatory Policy Changes Shape Market Structure Evolution
Regulatory policy evolution in major producing and consuming regions creates fundamental changes in market structure that extend beyond typical supply-demand analysis. Indonesia's quota management represents one example of policy-driven market intervention, whilst other jurisdictions develop environmental compliance requirements and trade policy frameworks affecting global nickel flows.
Environmental Compliance Cost Integration
Environmental compliance costs increasingly influence production economics and competitive positioning among global producers. Stricter environmental standards in some jurisdictions create cost disadvantages relative to regions with different regulatory frameworks, potentially affecting long-term capacity allocation and investment decisions.
Carbon pricing mechanisms, waste management requirements, and biodiversity protection mandates represent evolving regulatory costs that vary substantially across producing regions. These compliance costs become increasingly significant components of total production economics.
Export Restriction Policy Development Trends
Indonesia's evolution from raw material exporter toward processed material exporter reflects broader policy trends among resource-rich nations seeking greater value capture from natural resource endowments. Similar policy development in other producing regions could fundamentally alter global trade patterns and processing location economics.
Export restriction policies create supply chain vulnerabilities for importing countries whilst potentially supporting domestic processing industry development in producing regions. These policies require long-term strategic planning among consuming country industries and governments.
International Trade Agreement Implications for Nickel Markets
Trade agreement evolution affects tariff structures, market access conditions, and investment frameworks across major nickel-trading relationships. Changes in trade policy create opportunities for some participants whilst disadvantaging others based on geographical positioning and supply chain structure.
Critical mineral classification and strategic material designation in various countries influence trade policy development and investment prioritisation decisions. These classifications affect government support availability, permit processing timelines, and foreign investment review processes.
This analysis is based on current market conditions and available information as of April 2026. Commodity markets involve substantial risks including price volatility, geopolitical uncertainty, and regulatory changes. Investment decisions should consider individual risk tolerance and involve consultation with qualified financial advisors. Past performance does not guarantee future results, and forward-looking projections represent estimates subject to substantial uncertainty.
Ready to Identify the Next Major Nickel Discovery Before Market Volatility Strikes?
Discovery Alert's proprietary Discovery IQ model delivers instant notifications on significant ASX mineral discoveries, helping investors navigate complex market conditions like Indonesia's quota restrictions and Middle East supply disruptions. Start your 14-day free trial today to gain real-time insights into emerging opportunities whilst geopolitical uncertainty reshapes commodity markets.