July 29, 2026
When Ore Grade Becomes the Most Powerful Variable in Mining Economics
The performance of a major diversified miner is rarely reducible to a single operational metric. Yet in copper mining, ore grade sits at the apex of every production equation. It determines how much rock must be moved per tonne of recoverable metal, how much energy and reagent is consumed in processing, and ultimately how efficiently capital is converted into saleable product. Understanding cut-off grade economics is essential here, because when grades improve across multiple operations simultaneously, the leverage effect on output volumes can be dramatic, even without a single new mine entering production.
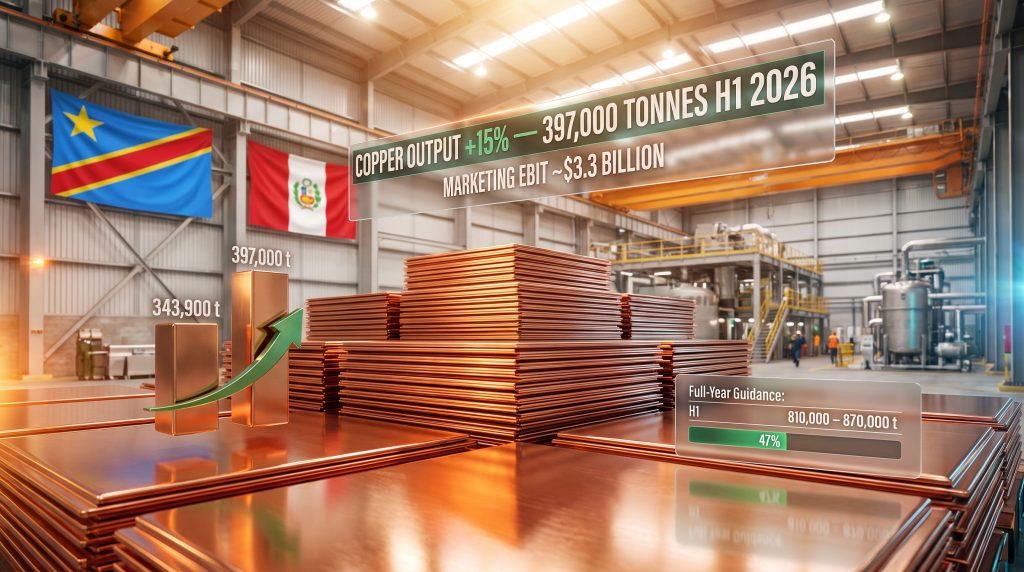
That dynamic is precisely what has propelled Glencore copper output up 15% and $3.3bn marketing earnings through the first half of 2026. With 397,000 tonnes of copper produced in the six months to June 30, the Swiss-headquartered commodities giant delivered a 15% year-on-year increase compared to the 343,900 tonnes recorded in H1 2025. The catalyst was not greenfield expansion or aggressive capital deployment into new projects. It was ore grade recovery, concentrated primarily across African operations and reinforced by Antamina's contribution in Peru.
When big ASX news breaks, our subscribers know first
The Mechanics Behind a 15% Copper Production Surge
Why Ore Grade Is the Defining Lever
In copper mining, ore grade is expressed as the percentage of copper contained within each tonne of mined rock. A shift from, say, 0.8% to 1.0% copper grade across a large-scale open-pit operation can translate into a 20% or greater increase in recoverable metal without any meaningful change in throughput volumes. The grade variability at many African copper mines is structurally significant because the geology of the Central African Copperbelt features high-grade zones interspersed with lower-grade transition material.
When mining sequences access higher-grade ore bodies, production volumes respond almost immediately. This is fundamentally different from volume-driven expansion, which requires capital expenditure, permitting timelines, and ramp-up periods that can span years. Grade-driven output gains arrive faster but also carry an implicit warning: they are not permanent unless underpinned by sustained reserve quality through the ore body.
For Glencore's H1 2026 copper result, the operational implication is meaningful. The 15% uplift was not manufactured through large-scale investment cycles but through improved mine sequencing into higher-grade zones at its African portfolio, most likely across its Katanga and other DRC-adjacent assets, supported by favourable grade conditions at the Antamina polymetallic mine in Peru.
Antamina's Role as a Secondary Growth Engine
Antamina, situated in Peru's Ancash region at elevations exceeding 4,300 metres above sea level, is one of the world's largest copper-zinc mines. Its ore body is a skarn deposit, a geologically complex formation where copper, zinc, molybdenum, and silver occur in varying concentrations depending on which ore zone is being processed. This compositional variability means Antamina's copper output can shift materially from period to period based purely on which part of the ore body is in the mining sequence.
Peru's broader copper sector had faced several years of operational disruption linked to community relations challenges and logistical constraints. The partial recovery in Peruvian copper output during 2026 reflects both improved operating conditions at site level and the natural rotation of mine plans into copper-dominant ore zones. For Glencore, Antamina's contribution during H1 2026 reinforced the geographic diversification thesis, demonstrating that the production uplift was not solely dependent on a single jurisdiction.
Q1 2026 as an Early Signal
The strength of H1 was not without foreshadowing. Q1 2026 copper production reached 199,600 tonnes, representing a 19% year-on-year increase for that quarter alone. This early data established that the operational momentum was broad-based rather than a statistical artifact of a single strong month. The Q1 figure also framed market expectations ahead of the August 5 full H1 results announcement, with analysts able to anticipate that full-half copper output would likely test or exceed the 390,000-tonne threshold.
Glencore's $3.3 Billion Marketing Earnings: What the Number Really Reveals
The Dual-Engine Business Model
Unlike pure-play copper miners, Glencore operates a trading and marketing division that monetises physical commodity flows across dozens of markets simultaneously. The marketing segment generates earnings through commodity arbitrage, logistics optimisation, price spread capture between geographies, and the management of physical inventory across the supply chain. This creates an earnings profile that is structurally uncorrelated with production volumes alone.
Marketing adjusted EBIT measures the profitability of this trading activity, stripping out the financial engineering of interest and tax to isolate the operational performance of commodity flows. It is a metric that rewards volatility, market dislocation, and the ability to move physical material from surplus to deficit markets efficiently. Furthermore, as copper market trends continue to evolve in 2025 and 2026, the advantages of Glencore's integrated model become increasingly pronounced.
Benchmarking $3.3 Billion Against Guidance
The H1 2026 marketing result of approximately $3.3 billion in adjusted EBIT is extraordinary in one specific context: it has already consumed the vast majority of Glencore's full-year marketing guidance range in just six months.
| Metric | Value |
|---|---|
| H1 2026 Marketing Adjusted EBIT | ~$3.3 billion |
| Annual Guidance Low End | $2.3 billion |
| Annual Guidance High End | $3.5 billion |
| Guidance Midpoint | ~$2.9 billion |
| H1 Result as % of Midpoint | ~114% achieved in six months |
| H2 Surplus Headroom (vs. High End) | ~$0.2 billion |
With only approximately $200 million of headroom remaining before the top of the annual guidance band is breached, Glencore's marketing division is on track to test or exceed the upper boundary of its $2.3 billion to $3.5 billion annual guidance range. Whether H2 marketing earnings sustain the same run rate or experience mean reversion will be a central focus of the August 5 results presentation.
What Macro Conditions Supercharged Trading Returns
Commodity trading earnings at this scale require specific market conditions to materialise. The 2025 to 2026 period has been characterised by:
- Persistent supply chain fragmentation driven by geopolitical realignments
- Trade flow rerouting as tariff structures altered the economics of commodity logistics
- Elevated copper price volatility creating wider arbitrage windows between regional markets
- Physical commodity scarcity in specific geographies generating location premiums that well-positioned traders can capture
Glencore's physical trading infrastructure, built over decades of acquisitions and operational integration, is specifically designed to exploit these conditions. The company's ability to source, transport, finance, and deliver physical copper, cobalt, coal, and other commodities across complex logistics chains gives it earnings leverage during periods of market stress that no financial instrument can replicate. Indeed, Glencore copper outlook analyses have consistently highlighted this structural advantage as a key differentiator.
Cobalt: The 46% Decline Hiding Inside a Strong Report
DRC Export Policy and Its Cascading Effects
Cobalt production fell to 10,200 tonnes in H1 2026, down 46% year-on-year, in what represents the most significant operational constraint embedded within an otherwise strong production update. The decline was not caused by geological underperformance or operational failures at the mine level. It was a direct consequence of export quota restrictions imposed by the Democratic Republic of Congo, the country that produces roughly 70% of global cobalt supply.
The timeline of the DRC cobalt export ban and its subsequent evolution into quota restrictions is instructive:
- Prior to 2025: Cobalt prices declined sharply over multiple years, eventually reaching nine-year lows as battery chemistry innovation reduced cobalt intensity per cell and supply growth from DRC operations outpaced demand.
- 2025: The DRC government suspended cobalt exports outright, attempting to create a price floor by restricting supply.
- October 2025: The outright ban was replaced with an export quota system, allowing managed volumes to flow while maintaining upward price pressure.
- H1 2026: Quota constraints continued to suppress Glencore's cobalt shipment volumes, with the company prioritising copper output at integrated operations where the two metals are co-produced.
The Strategic Deferral Mechanism
Glencore's decision to prioritise copper processing over cobalt at integrated operations where both metals are recovered from the same ore is a financially rational response to the quota environment. By deferring cobalt inventory, the company effectively accumulates a stock of processed or partially processed material that can be released into the market once export restrictions ease.
This deferred inventory represents a potential earnings acceleration mechanism. If DRC quotas are relaxed during H2 2026 or into 2027, the release of accumulated cobalt supply could generate a meaningful revenue event, though it simultaneously introduces a risk: if multiple producers release deferred inventory simultaneously, the resulting supply surge could suppress cobalt prices at precisely the moment Glencore seeks to monetise its stockpile.
Cobalt's Long-Term Position in the Energy Transition
Battery chemistry trends have been pulling in two directions simultaneously. On one side, lithium iron phosphate chemistry, which contains no cobalt, has gained significant market share in lower-cost EV segments, particularly within Chinese manufacturing. On the other side, high-energy-density applications including aerospace, premium EV batteries, and grid storage continue to favour nickel-manganese-cobalt chemistries where cobalt remains an essential component.
The DRC's export restriction policy reflects a sovereign resource strategy, but its long-term effectiveness depends on whether demand growth from energy transition applications can absorb supply once restrictions ease, or whether cobalt demand destruction from chemistry substitution limits price recovery.
Full-Year Guidance: Reading Between the Lines of Maintained Targets
What 397,000 Tonnes in H1 Means for H2 Requirements
With 397,000 tonnes of copper already produced in H1, Glencore's maintained full-year guidance of 810,000 to 870,000 tonnes implies the following H2 production requirements:
| Scenario | H2 Production Required | Full-Year Total | Guidance Status |
|---|---|---|---|
| Low-End Guidance | 413,000 t | 810,000 t | Met (lower bound) |
| Mid-Guidance | 443,000 t | 840,000 t | Met (midpoint) |
| High-End Guidance | 473,000 t | 870,000 t | Met (upper bound) |
| Outperformance | 480,000+ t | 877,000+ t | Above guidance |
The midpoint scenario requires H2 copper output that is broadly comparable to H1 performance, suggesting Glencore's guidance is achievable under normal operational conditions. However, the company's decision to maintain rather than upgrade guidance is telling. Grade sustainability risk is real: if African operations rotate into lower-grade ore zones during H2, the production rate could moderate. Guidance conservatism may reflect internal uncertainty about how long the favourable grade conditions persist.
The Rio Tinto Standstill: Why August 5 Carries Strategic Weight Beyond Earnings
Background on the Merger Discussion Timeline
Glencore has publicly communicated its appetite for transformational M&A on multiple occasions. Its pursuit of Rio Tinto, the world's second-largest mining company by market capitalisation, has been characterised by a standstill agreement that temporarily restricted renewed merger discussions. That standstill period approaches its expiry around the time of the August 5 H1 2026 results announcement, creating a confluence of financial reporting and potential corporate activity that has drawn significant market attention.
A Glencore-Rio Tinto combination would create an entity with extraordinary scale across copper, coal, iron ore, aluminium, and commodity trading. The strategic logic centres on complementarity: Glencore's marketing and trading infrastructure combined with Rio Tinto's tier-one asset base in iron ore and bauxite would produce a diversification profile unlike any existing mining company.
Why Strong H1 Results Matter for Negotiating Dynamics
A strong operational and financial performance ahead of renewed merger discussions is not strategically irrelevant. Glencore's ability to demonstrate 15% copper production growth, marketing earnings near the top of annual guidance, and disciplined management of the cobalt production challenge strengthens its standing in any future negotiation. In addition, questions around Rio Tinto shareholder value remain central to how any prospective transaction would be structured and received by the market. The August 5 results commentary will consequently be watched carefully for any signals regarding M&A intentions or strategic direction.
The next major ASX story will hit our subscribers first
Key Metrics at a Glance
| Indicator | H1 2026 Result | Year-on-Year Change |
|---|---|---|
| Copper Production | 397,000 tonnes | +15% |
| Prior Period Copper Output | 343,900 tonnes | Baseline |
| Q1 2026 Copper Production | 199,600 tonnes | +19% YoY |
| Marketing Adjusted EBIT | ~$3.3 billion | Near top of annual guidance |
| Annual Marketing Guidance Range | $2.3bn to $3.5bn | On track to test upper bound |
| Cobalt Production | 10,200 tonnes | -46% |
| Full-Year Copper Guidance | 810,000 to 870,000 tonnes | Maintained |
Frequently Asked Questions
What caused Glencore's copper production to rise 15% in H1 2026?
The increase was driven primarily by improved ore grades at African operations within Glencore's portfolio and by a strengthened contribution from the Antamina polymetallic mine in Peru. Grade improvement, rather than new project development, was the dominant mechanism behind the volume uplift. According to Glencore's 2020 preliminary results, the company has historically demonstrated this capacity to leverage grade improvements across its diversified asset base.
What is marketing adjusted EBIT and why does $3.3 billion matter?
Marketing adjusted EBIT measures the operating profitability of Glencore's commodity trading and marketing division, excluding interest and tax impacts. The $3.3 billion H1 figure matters because it has already reached approximately 114% of Glencore's full-year guidance midpoint of roughly $2.9 billion in just six months, placing full-year marketing earnings on track to test the upper boundary of the $2.3 billion to $3.5 billion annual guidance range.
Why did Glencore's cobalt production fall 46%?
Cobalt output declined due to export quota restrictions imposed by the Democratic Republic of Congo, not from operational underperformance. Glencore also made a deliberate decision to prioritise copper processing at integrated operations, deferring cobalt inventory for potential sale once export restrictions ease.
What is Glencore's full-year copper production guidance for 2026?
Glencore has maintained its full-year copper production guidance at 810,000 to 870,000 tonnes. With 397,000 tonnes produced in H1, the company requires between 413,000 and 473,000 tonnes in H2 to meet the guidance range. Industry observers tracking SP Angel's market commentary have noted that the maintained guidance reflects a degree of caution around grade sustainability in the second half.
When does Glencore report its full H1 2026 financial results?
Full H1 2026 results are scheduled for release on August 5, 2026, a date that also coincides with the approaching expiry of the standstill period that had restricted renewed merger discussions with Rio Tinto.
What is the current status of the Glencore-Rio Tinto merger discussion?
A standstill agreement had temporarily restricted renewed merger talks between the two companies. That standstill period approaches expiry around the August 5 results date. No confirmed merger agreement or formal offer has been announced. Any renewed discussions would face substantial regulatory and shareholder scrutiny given the scale of both companies.
This article contains forward-looking statements, scenario modelling, and market analysis that reflect publicly available information and general industry commentary. It does not constitute financial advice. Investors should conduct independent due diligence before making any investment decisions.
Want to Capitalise on the Next Major Copper or Commodity Discovery Before the Broader Market?
Discovery Alert's proprietary Discovery IQ model delivers real-time alerts on significant ASX mineral discoveries, instantly transforming complex geological data into actionable investment insights for both short-term traders and long-term investors — start your 14-day free trial today, or explore historic discovery returns to understand just how transformative early positioning in major mineral finds can be.