August 6, 2026
When Commodity Cycles Align: What Glencore's H1 2026 Earnings Reveal About the Mining Industry's New Reality
Commodity supercycles rarely announce themselves cleanly. They tend to reveal their character gradually, through earnings reports, capex decisions, and margin data that, when read collectively, paint a picture of structural transformation rather than temporary fluctuation. The first half of 2026 may represent precisely such a moment of clarity for the global mining sector, and no single company's results capture this dynamic more comprehensively than the H1 2026 financial performance of Glencore.
The Glencore revenue rise in first half earnings is not simply a story about commodity price luck. It is a case study in how an integrated business model, combining industrial mining operations with a global commodity trading and marketing division, can amplify returns during periods when market conditions converge in a company's favour. Understanding that convergence is essential for anyone attempting to read what these results mean for the broader sector.
When big ASX news breaks, our subscribers know first
H1 2026 vs H1 2025: The Full Financial Picture
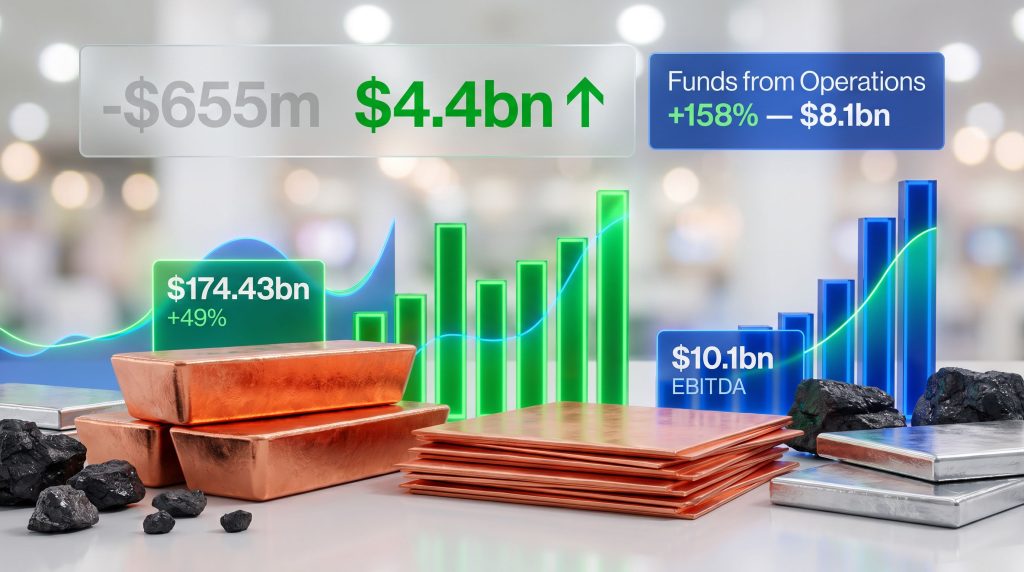
The numerical contrast between the two periods is striking. Total revenue climbed 49% year-on-year to $174.43 billion, up from $117.39 billion in H1 2025. However, revenue alone undersells the story. Profitability metrics expanded at an even faster rate, indicating that the earnings leverage embedded in Glencore's cost structure and business model was firing on multiple fronts simultaneously.
| Financial Metric | H1 2025 | H1 2026 | % Change |
|---|---|---|---|
| Total Revenue | $117.39bn | $174.43bn | +49% |
| Adjusted Group EBITDA | $5.43bn | $10.1bn | +86% |
| Industrial Adjusted EBITDA | ~$3.78bn | $6.5bn | +72% |
| Marketing Adjusted EBIT | ~$1.36bn | $3.3bn | +142% |
| Funds from Operations | ~$3.14bn | $8.1bn | +158% |
| Net Income (Equity Holders) | -$655m | $4.4bn | Turnaround |
| Capital Expenditure | $3.2bn | $4.0bn | +25% |
The swing from a $655 million net loss to $4.4 billion in net income attributable to equity holders in a single half-year period is among the most significant single-period earnings recoveries in the company's recent history. This recovery was supported by gains from the disposal of non-current assets and the recognition of deferred tax assets, partially offset by certain impairments.
What Adjusted EBITDA and Funds from Operations Actually Measure
For investors less familiar with mining-sector financial terminology, these two metrics carry specific analytical weight. Adjusted EBITDA strips out the distorting effects of depreciation, amortisation, interest costs, and tax, providing a cleaner view of underlying operational profitability. In capital-intensive industries like mining, where asset depreciation can be substantial, EBITDA offers a more comparable period-to-period performance measure than net income alone.
Funds from operations (FFO), furthermore, represents the cash actually generated from business activities after adjusting for non-cash items. An FFO increase of 158% to $8.1 billion signals that the earnings expansion was not merely accounting-driven but reflected genuine cash generation capacity, a distinction that matters enormously for assessing dividend sustainability, debt management, and reinvestment potential. The broader relationship between commodity prices and miners demonstrates just how decisively this kind of convergence can reshape sector performance.
Three Forces Behind the Glencore Revenue Rise in First Half Earnings
Price Tailwinds Across Core Commodities
The single largest driver of the H1 2026 earnings expansion was the substantially higher average commodity prices recorded across Glencore's core portfolio compared to the same period in 2025. Copper, zinc, and coal all recorded meaningful price increases on a period-over-period basis, translating directly into improved margins across the industrial segment.
The adjusted EBITDA mining margin breakdown illustrates just how profitably these commodity price movements flowed through to the bottom line:
- Copper mining margin: 52% on an adjusted EBITDA basis
- Steel-making coal margin: 38%
- Energy coal margin: 19%
A 52% copper EBITDA margin is notably high by historical standards and reflects both the elevated pricing environment and the operational efficiency across Glencore's copper asset base. This margin performance also provides context for the company's decision to direct a significant portion of its increased capital expenditure toward expanding copper operations, particularly given the ongoing copper supply crunch that continues to tighten global availability.
The Marketing Division's Near-Record Contribution
Perhaps the most analytically interesting element of the H1 2026 results is the performance of the marketing division. Marketing adjusted EBIT of $3.3 billion represented a 142% year-on-year increase and came close to record territory for a single half-year period.
This is worth examining in structural terms. Glencore's marketing arm does not simply sell the company's own production. It operates as a global commodity trading and logistics business, taking positions across physical and financial commodity markets, managing supply chain flows, and exploiting pricing differentials between geographies, time periods, and product specifications. These so-called arbitrage spreads tend to widen during periods of market disruption and volatility.
Periods of elevated geopolitical uncertainty, supply chain fragmentation, and commodity price volatility are not just operational challenges for Glencore's industrial division. They are, simultaneously, revenue-generating conditions for the marketing arm. This natural internal hedge is a structural feature that pure-play miners simply cannot replicate.
Industrial Operations Tracking Guidance
Industrial adjusted EBITDA of $6.5 billion reflected a 72% improvement compared to H1 2025. Management noted that asset performance across the portfolio came in broadly in line with previously issued market guidance, a statement that carries meaningful credibility weight. Companies that consistently deliver results within their own guidance ranges are rewarded with lower risk premiums from institutional investors over time.
The Integrated Model: Why Glencore Outperforms in Volatile Markets
The structural comparison between Glencore and single-commodity producers is instructive. A pure-play copper miner benefits during copper price upswings but has no offsetting mechanism when prices fall and no additional earnings lever beyond volume growth. Glencore's dual-engine architecture changes this calculus entirely.
| Business Segment | H1 2026 Adjusted Earnings | Primary Driver |
|---|---|---|
| Industrial (Mining and Processing) | $6.5bn EBITDA | Higher commodity prices |
| Marketing (Trading and Logistics) | $3.3bn EBIT | Market disruption and volatility |
| Combined Group | $10.1bn EBITDA | Dual-engine amplification |
When industrial margins compress due to falling prices, the conditions that cause that compression, namely market uncertainty and volatility, tend to simultaneously expand marketing spreads. This is not coincidental. It is an intentional design feature of Glencore's business model, built over decades through the integration of Glencore's original trading roots with its subsequent mining asset acquisitions.
Capital expenditure of $4.0 billion in H1 2026, up 25% from $3.2 billion in H1 2025, with a significant proportion directed toward copper growth assets, signals that the company is investing at scale during a period of strong cash generation rather than simply distributing all available capital to shareholders. In this respect, Glencore's approach mirrors that of other commodity trading giants that have similarly prioritised high-conviction asset positions during periods of elevated earnings.
Copper Strategy: Positioning for Electrification-Driven Demand
Glencore's capital allocation decisions in H1 2026 tell a deliberate story about where management believes the most durable value lies within their portfolio. The concentration of new capex in the copper segment, set against a backdrop of 52% EBITDA mining margins, reflects both near-term opportunism and longer-term strategic conviction.
Copper occupies a structurally unique position in the commodity landscape. It is irreplaceable in electrical wiring, motors, transformers, and the full spectrum of electrification infrastructure that underpins the global energy transition. Unlike many energy transition materials where substitution risk exists, copper has proven extraordinarily difficult to replace at scale in high-conductivity applications. Aluminium is the primary alternative in some transmission applications, but its conductivity per unit volume is approximately 60% that of copper, making full substitution technically constrained in many end uses.
With copper EBITDA margins at 52% and significant capex directed toward the copper portfolio, the strategic intent is clear: to grow exposure to a commodity where structural demand tailwinds are expected to intensify over the latter half of this decade and into the 2030s.
For investors seeking to understand the broader opportunity set, copper investment strategies are increasingly relevant given the structural demand dynamics driving this market. Glencore's half-year report provides further detail on the company's copper asset expansion plans and the assumptions underpinning its capital allocation framework.
Coal Operations: Margin Divergence and H2 Volume Outlook
The coal segment performance in H1 2026 revealed an instructive divergence between two distinct coal types that investors sometimes incorrectly treat as a single commodity.
| Coal Segment | Adjusted EBITDA Margin | H2 2026 Volume Outlook |
|---|---|---|
| Steel-Making (Metallurgical) Coal | 38% | Volume increase expected |
| Energy (Thermal) Coal | 19% | Stable |
Steel-making coal, also known as metallurgical or coking coal, is chemically and structurally different from thermal coal used in power generation. It is a critical input in blast furnace steel production and, despite the energy transition narrative, has no near-term scalable substitute in primary steelmaking. Electric arc furnace technology can recycle scrap steel but cannot produce the virgin steel needed to meet global infrastructure demand from scrap alone, particularly in developing economies still building out their industrial base.
Glencore has guided toward a volume increase in steel-making coal production during H2 2026, which, if realised at current pricing levels, would provide meaningful incremental earnings contribution to the full-year result. Consequently, tracking metallurgical coal prices through the second half will be essential for assessing whether this guidance translates into the projected contribution.
The lower margin profile of energy coal at 19% reflects both structural market dynamics and the ESG-related pricing pressures that increasingly affect thermal coal asset valuations. Glencore has publicly maintained its position that responsibly managing and eventually winding down coal assets, rather than divesting them to less regulated operators, represents the better environmental outcome. This remains a contested debate in capital markets, with institutional ESG frameworks pulling in the opposite direction.
The next major ASX story will hit our subscribers first
Shareholder Returns and the $19.7 Billion Full-Year Projection
The announcement of $1.5 billion in additional shareholder returns alongside the H1 2026 results reflects management's confidence in the sustainability of current cash generation levels. The decision to increase capital returns while simultaneously growing capex signals a balance sheet with sufficient flexibility to pursue both objectives concurrently, a position that was notably absent during the net-loss environment of H1 2025.
The full-year 2026 illustrative adjusted EBITDA projection of approximately $19.7 billion rests on several assumptions that investors should examine carefully:
- Current commodity price levels remain broadly stable through H2 2026
- Steel-making coal volumes increase as guided
- Marketing conditions remain constructive rather than normalising
- No material operational disruptions across major assets
Any deterioration in copper or coal pricing, a normalisation of marketing spreads, or unexpected operational setbacks would introduce meaningful downside risk to the $19.7 billion projection. This figure should be treated as an illustrative scenario rather than a formal earnings forecast.
The ASX Secondary Listing: A Strategic Expansion Into Australian Capital Markets
Among the strategic announcements accompanying the H1 2026 results, the intention to pursue a secondary listing on the Australian Securities Exchange by October 2026 warrants specific analysis. Glencore's primary listing remains on the London Stock Exchange, where it has traded since its 2011 IPO, one of the largest in London's history at the time.
A secondary ASX listing would provide several structural benefits:
- Access to a deep pool of Australian institutional capital with significant commodity sector expertise
- Improved trading liquidity through extended market hours across geographically distributed exchanges
- Enhanced visibility among retail and institutional investors in the Asia-Pacific region
- Potential re-rating if the ASX investor base places a different valuation multiple on commodity earnings
The timing of this announcement is not incidental. Glencore already has a meaningful operational footprint in Australia. In June 2026, Larvotto Resources finalised a binding offtake agreement with Glencore for gold concentrate supply from the Hillgrove Antimony-Gold Project in New South Wales, a transaction that deepens the company's commercial ties to Australian resource producers ahead of the planned exchange admission.
Forward-Looking Risks: What Could Interrupt the H2 2026 Momentum
The strong H1 2026 performance creates a high baseline against which H2 results will be measured. Several risk factors are worth monitoring:
- Commodity price volatility: Copper and coal prices are sensitive to Chinese industrial demand data, and any meaningful slowdown in Chinese fixed asset investment or manufacturing output could compress margins significantly
- Marketing spread normalisation: Near-record marketing earnings are, by definition, difficult to sustain; a stabilisation in geopolitical conditions or supply chain disruptions could tighten spreads
- Currency movements: Glencore reports in Swiss francs for certain metrics, and significant USD/CHF movements can affect reported figures
- Regulatory and ESG headwinds: Ongoing pressure on coal asset valuations and potential carbon pricing mechanisms in key operating jurisdictions
- Geopolitical disruptions: Supply chain events that benefit the marketing division can also create operational challenges for specific mine sites
Frequently Asked Questions: Glencore H1 2026 Earnings
What was Glencore's total revenue in H1 2026?
Glencore's total revenue for the first half of 2026 reached $174.43 billion, representing a 49% increase compared to $117.39 billion in H1 2025.
What drove the 86% rise in adjusted EBITDA?
The primary drivers were substantially higher average commodity prices across the core portfolio, including copper, zinc, and coal, combined with near-record performance from the marketing division, which posted a 142% increase in adjusted EBIT to $3.3 billion.
How much did funds from operations increase?
Funds from operations rose 158% to $8.1 billion, reflecting the combined effect of stronger earnings across both the industrial and marketing segments.
What is Glencore's full-year 2026 EBITDA projection?
Glencore has indicated a full-year 2026 illustrative adjusted EBITDA of approximately $19.7 billion, contingent on current commodity price stability and expected volume increases in steel-making coal during H2.
Why is Glencore pursuing an ASX secondary listing?
The company has announced its intention to apply for a secondary listing on the Australian Securities Exchange, targeting admission in October 2026, with the objective of broadening its investor base and improving trading liquidity.
What were Glencore's copper mining margins in H1 2026?
Glencore achieved an adjusted EBITDA copper mining margin of 52% in H1 2026, reflecting elevated copper prices and efficient operational performance across its copper asset portfolio.
Three Structural Takeaways From the H1 2026 Results
Reading the H1 2026 results purely as a commodity price story misses the more durable strategic messages embedded in the data. Three structural observations stand out.
First, the integrated trading and mining model continues to demonstrate its countercyclical resilience. The marketing division's near-record $3.3 billion contribution proves that Glencore's earnings capacity extends well beyond what commodity price charts alone would suggest.
Second, the deliberate capital concentration in copper during a period of peak cash generation reflects a long-duration strategic bet that electrification demand will sustain copper prices at levels that justify the growth investment. This is a high-conviction positioning decision that shareholders should evaluate against their own views on the pace and scale of the energy transition.
Third, the ASX secondary listing pursuit signals an ambition to diversify the company's capital markets exposure at a moment of financial strength, a strategically sensible window in which to execute such a move. Whether the listing achieves a meaningful valuation re-rating will depend on how Australian institutional investors price commodity earnings relative to their London counterparts.
The Glencore revenue rise in first half earnings is, at its core, a window into the machinery of one of the world's most complex commodity businesses operating at close to peak efficiency. For investors and industry observers alike, the H1 2026 results offer a rare opportunity to observe exactly what this integrated model looks like when commodity cycles, trading conditions, and operational execution align simultaneously. Reuters reporting on Glencore's earnings provides additional context on the market reaction and the company's forward guidance following the announcement.
This article contains forward-looking statements and financial projections sourced from publicly available company announcements. These projections are subject to material uncertainty and should not be construed as investment advice. Readers should conduct their own independent research before making any investment decisions.
Want to Catch the Next Major Mineral Discovery Before the Broader Market Does?
Discovery Alert's proprietary Discovery IQ model delivers real-time alerts on significant ASX mineral discoveries, transforming complex geological and commodity data into actionable investment insights for both short-term traders and long-term investors. Explore Discovery Alert's discoveries page to understand how historic mineral discoveries have generated substantial returns, and begin your 14-day free trial today to position yourself ahead of the market.