July 29, 2026
The Geography of Global Aluminium Supply Is Being Redrawn
For most of the past two decades, the story of primary aluminium supply was essentially a story about China. The country's extraordinary smelting expansion transformed global markets, compressed margins for producers elsewhere, and anchored pricing dynamics across the entire value chain. However, that era of China-driven supply growth has structurally ended. The country now operates under a self-imposed capacity ceiling, its smelters running at near-maximum utilisation, and the global industry is entering a fundamentally different phase.
What emerges from a close reading of current capacity data and forward commissioning schedules is a more fragmented, geographically distributed supply structure, one in which Indonesia, the Middle East, and select African producers carry increasing weight. Understanding how global aluminium capacity growth end-2026 evolves, and into 2027, is now one of the most consequential analytical tasks in commodity markets.
When big ASX news breaks, our subscribers know first
Projecting the 77.16 Mt Threshold: What the Numbers Actually Mean
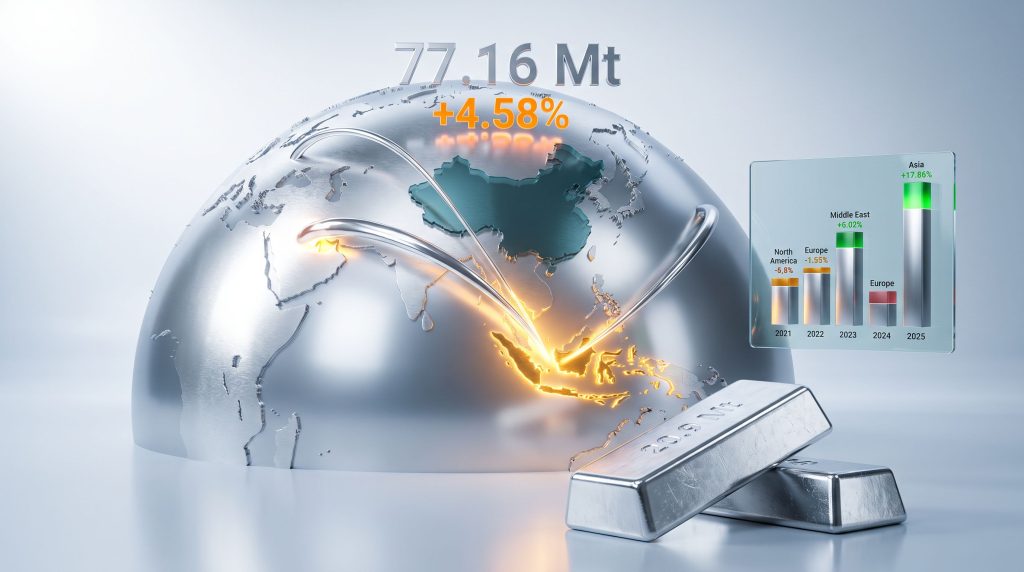
Global primary aluminium operating capacity is projected to reach approximately 77.16 million tonnes by end-2026, representing a 4.58% increase from the 2025 baseline of roughly 73.78 million tonnes. The implied net addition of approximately 20.9 million tonnes encompasses greenfield commissioning, resumptions of previously idled capacity, and replacement flows as older smelting infrastructure is retired and replaced by more efficient operations.
This distinction matters more than headline figures typically suggest. Nameplate capacity, the theoretical maximum output of installed smelting infrastructure, consistently overstates actual production. Operating rates, energy availability, and alumina supply logistics all introduce gaps between what a smelter can produce and what it does produce. The table below illustrates how this measurement gap has evolved and what it implies for 2026 projections.
| Metric | 2024 Estimate | 2025 Estimate | 2026 Projection |
|---|---|---|---|
| Global Operating Capacity (Mt) | ~73.5 | ~73.78 | ~77.16 |
| Year-on-Year Capacity Growth | — | ~1.1% | ~4.58% |
| Implied Production Utilisation | ~99% | ~97%+ | TBD by region |
| Net Capacity Addition (Mt) | — | ~0.77 | ~20.9 (cumulative) |
The 2025 growth rate of approximately 1.1% represented a five-year low, suppressed by China's regulatory ceiling and delayed commissioning of offshore projects. The projected acceleration to 4.58% in 2026 therefore reflects a genuine structural step-change rather than a continuation of recent trend. Furthermore, according to industry capacity forecasts, this scale of addition is unprecedented in the post-China expansion era.
Greenfield vs. Resumption: Why the Composition of Additions Matters
Not all capacity additions carry equal weight in supply forecasting. Greenfield smelters starting from scratch face longer ramp curves, typically reaching 50 to 70 percent of nameplate output in their first year of operation before approaching full utilisation over a 12 to 24 month period. Resumed idled capacity, by contrast, can return to meaningful output levels more quickly, provided the underlying infrastructure has been maintained.
This distinction is particularly relevant for the 2026 outlook because the Indonesian pipeline is predominantly greenfield, meaning the full supply impact of these projects will be felt progressively through 2026 and 2027, rather than arriving as a single demand-displacing volume.
Indonesia's Emergence as the Marginal Global Supplier
More than half of the near-term incremental capacity additions within the 20.9 Mt figure originate outside China, and Indonesia accounts for the largest single national contribution within that non-China cohort. This is a structural development with implications that extend well beyond single-year supply forecasting. In addition, the role of global bauxite production in enabling this shift cannot be understated, as raw material access underpins the entire Indonesian expansion thesis.
Indonesia's trajectory toward becoming a major primary aluminium producer reflects several converging advantages:
- Domestic bauxite resources: Indonesia holds substantial bauxite reserves and, following export restriction policies designed to encourage domestic processing, has strong structural incentives to develop downstream refining and smelting capacity.
- Energy access at competitive cost: Large-scale hydropower and coal-based power generation in specific Indonesian provinces offers the energy intensity required for economically viable primary smelting.
- Industrial policy alignment: The Indonesian government has consistently prioritised resource value-addition, creating a regulatory environment that encourages investment in smelting infrastructure rather than raw material export.
- Geographic positioning: Proximity to major Asian demand centres reduces logistics costs and positions Indonesian production favourably relative to Middle Eastern or African alternatives for key markets.
"The emergence of Indonesia as a primary aluminium production hub represents the most significant geographic shift in global smelting since the Gulf Cooperation Council countries began their own capacity build-out in the 2000s."
The China Capacity Ceiling and Its Global Implications
China's aluminium industry operates under an administrative capacity cap of 45 million tonnes, a policy measure introduced to limit energy consumption and manage environmental externalities from the energy-intensive smelting process. In 2025, Chinese smelters operated at approximately 97% of that ceiling, producing around 43.9 million tonnes of primary metal.
The practical consequence is straightforward but profound: with Chinese capacity effectively saturated, every incremental tonne of global aluminium supply through 2026 and beyond must originate from non-Chinese smelters. This is not a cyclical condition that will resolve as market prices rise. It is a regulatory constraint that has permanently altered the architecture of global aluminium supply. Consequently, China industrial demand patterns have become equally critical in determining how tightly the overall market is likely to balance.
The Middle East understood this dynamic early. Gulf producers have steadily expanded capacity over the past decade, rising from 6.44 Mt in 2021 to 7.05 Mt by 2025, leveraging competitive energy costs and access to capital. Indonesia is now following a similar playbook, but at larger scale and with the added advantage of domestic raw material integration.
Five Years of Regional Production: What the Data Reveals
Regional production trends between 2021 and 2025 tell a story of divergence that is accelerating rather than converging. The following table, compiled from regional production data, captures these structural shifts.
| Region | 2021 (Mt) | 2022 (Mt) | 2023 (Mt) | 2024 (Mt) | 2025 (Mt) |
|---|---|---|---|---|---|
| Asia | 43.67 | 45.49 | 47.31 | 49.09 | 50.06 |
| Middle East | 6.44 | 6.70 | 6.70 | 6.77 | 7.05 |
| North America | 4.06 | 3.90 | 4.06 | 3.99 | 3.95 |
| Europe | 4.31 | 3.41 | 3.17 | 3.20 | 3.22 |
Asia added approximately 6.4 million tonnes of annual production capacity across this period, consolidating its position as the overwhelming engine of global supply. The Middle East delivered steady incremental growth, reflecting continued investment in energy-advantaged smelting. North America and Europe, meanwhile, tell a fundamentally different story.
Europe's Structural Contraction: Cyclical Suppression or Permanent Impairment?
European primary aluminium output fell from 4.31 Mt in 2021 to just 3.17 Mt in 2023, a decline of more than 26% in two years. The proximate cause was the European energy crisis following the 2022 geopolitical disruption to natural gas supply, which rendered many energy-intensive smelting operations economically unviable at prevailing power prices.
The partial recovery to 3.22 Mt by 2025 is encouraging but contextually modest. European smelting capacity remains well below pre-crisis levels, and the fundamental energy cost disadvantage relative to the Middle East and Southeast Asia has not structurally resolved. The critical unresolved question is whether European smelting curtailments represent temporary idling that will reverse when energy markets normalise, or a permanent loss of competitive position.
Several factors suggest the latter scenario carries more weight than markets currently price:
- European industrial electricity prices remain structurally elevated relative to pre-2021 levels even after the immediate crisis passed.
- Carbon pricing mechanisms continue to add cost burden to energy-intensive production processes.
- Smelter cold-restarts are expensive and technically demanding; idled capacity that sits dormant for extended periods faces increasing rehabilitation costs.
- Capital allocation decisions by major European aluminium producers have increasingly favoured recycling and downstream processing over primary smelting investment.
North America: A Flat Decade With No Structural Catalyst in Sight
North American primary production has oscillated narrowly between 3.90 Mt and 4.06 Mt across the entire 2021 to 2025 period. No meaningful new smelting capacity has been commissioned, and the policy environment has not generated the sustained energy cost incentives required to attract large-scale greenfield investment.
The contrast with the Middle East's trajectory over the same period is instructive. The 0.61 Mt increase in Middle Eastern output between 2021 and 2025 represents organic, energy-arbitrage-driven growth. North America's flatness reflects a market where existing operators manage costs carefully but new entrants face prohibitive economics. The effects of US aluminium tariffs have further complicated the investment calculus for domestic capacity expansion, adding policy uncertainty to an already challenging cost environment.
Supply-Demand Balance Scenarios Through 2026 and 2027
The global aluminium market is projected to remain in structural deficit through 2026, with the magnitude of that deficit subject to meaningful scenario variation depending on how African smelting operations perform.
Scenario A: Base Case (Orderly Commissioning)
- Indonesian projects commission progressively through 2026 on schedule.
- Global market deficit holds at approximately 200,000 tonnes.
- Price environment remains supportive without becoming disruptive.
- Market transitions toward balance in late 2027 as Indonesian projects approach full utilisation.
Scenario B: African Curtailment Risk
- Smelting operations in Mozambique and sub-Saharan Africa face operational disruption or closure.
- Deficit widens toward 600,000 tonnes, representing a tighter market than most current price forecasts accommodate.
- Price spike accelerates approval of additional capacity resumptions globally.
- Supply tightness persists into mid-2027 before Indonesian volumes provide meaningful offset.
Scenario C: Demand Acceleration
- EV adoption rates exceed consensus forecasts, driving higher-than-expected aluminium intensity in the automotive supply chain.
- Construction sector recovery across Asia and the Middle East adds incremental demand above trend.
- Even with the full 20.9 Mt addition, the market remains in structural deficit through 2027.
- Price signals pull forward additional capacity resumptions that were not included in base case projections.
"The asymmetry of risk in these scenarios is notable. The upside surprise to deficit is more achievable than the surplus scenario, because Indonesian greenfield ramp curves are inherently uncertain while African curtailment risk is an active and ongoing concern."
According to deficit price support analysis, the combination of constrained Chinese output and rising non-China demand means price floors are likely to remain elevated well into 2026 regardless of which scenario materialises.
Demand Fundamentals: Where Aluminium Consumption Is Actually Growing
Understanding the supply outlook requires an equally rigorous view of demand drivers. Two structural forces dominate the aluminium demand narrative into 2026.
Automotive electrification is the more dynamic of the two. Electric vehicles require meaningfully more aluminium per unit than equivalent internal combustion vehicles, driven by battery enclosure structures, thermal management systems, and the broader lightweighting imperative that offsets battery weight. As EV penetration rates increase across key markets, the aluminium intensity of the global vehicle fleet rises structurally rather than cyclically.
Construction and infrastructure activity across Asia and the Middle East provides the volume baseline. Aluminium's role in structural framing, curtain wall systems, and roofing applications means that sustained construction investment in high-growth markets creates durable, long-cycle demand that is relatively insensitive to short-term price movements.
Where demand growth is more subdued:
- Packaging applications are facing material substitution pressure and lightweighting-driven thrifting that constrains volume growth.
- European industrial demand remains constrained by the same energy economics that suppressed smelting output.
- North American demand growth is heavily dependent on infrastructure policy execution, which introduces timing uncertainty.
The next major ASX story will hit our subscribers first
Risk Factors That Could Disrupt the 2026 Capacity Outlook
| Risk Factor | Probability | Impact on Capacity | Affected Region |
|---|---|---|---|
| Indonesian project delays | Medium | High: removes largest incremental contributor | Southeast Asia |
| African smelter curtailments | Medium-High | Moderate: net reduction of 200-400 kt | Sub-Saharan Africa |
| China capacity ceiling breach | Low | High: regulatory and market disruption | China / Global |
| Energy price spike | Medium | Moderate: European restarts stall | Europe |
| Demand shortfall | Medium | Low on capacity, high on utilisation | Global |
The concentration risk in Indonesia deserves particular attention. When a single jurisdiction is responsible for the majority of incremental global supply additions, project-level risks in that jurisdiction carry outsized market consequences. Infrastructure delivery timelines, power availability, port logistics, and regulatory approvals in Indonesia all become variables with global pricing implications.
Contextualising 4.58%: How Does This Compare to Historical Expansion Cycles?
The projected 4.58% capacity growth rate for 2026 needs historical context to be properly interpreted. Following the 2008 financial crisis, the aluminium industry experienced a period of aggressive Chinese capacity expansion that delivered growth rates well above this level for several consecutive years. The post-2015 period saw more measured growth as Chinese policy tightened and the 45 Mt ceiling became the binding constraint.
The 2025 growth rate of approximately 1.1% represented the slowest expansion in five years, creating a statistical base effect that makes 2026's projected acceleration appear more dramatic than the underlying project pipeline might otherwise suggest. Crucially, even with 20.9 Mt of additions, the market is not moving into surplus. The deficit projection of 200,000 to 600,000 tonnes indicates that demand growth has kept pace with much of the capacity expansion.
Surplus conditions are a 2027 story, and only if Indonesian projects commission on schedule, African operations hold, and demand growth does not accelerate beyond current consensus. Furthermore, strategic moves by the top aluminium producers suggest that even the largest players anticipate an extended period of tight market conditions before any meaningful surplus emerges. For instance, the recent Alcoa joint venture activity signals that major producers are positioning for a multi-year supply constraint environment rather than near-term abundance.
Frequently Asked Questions: Global Aluminium Capacity Growth End-2026
What is the projected total global aluminium operating capacity by end-2026?
Approximately 77.16 million tonnes, up from around 73.78 million tonnes in 2025, representing a 4.58% year-on-year increase driven by roughly 20.9 million tonnes of new, resumed, and replacement capacity additions.
Which country is contributing the most new aluminium capacity outside China in 2026?
Indonesia is identified as the largest single incremental contributor to non-China capacity additions, driven by domestic bauxite resources, competitive energy access, and industrial policy incentives that favour downstream processing.
Is the global aluminium market in surplus or deficit in 2026?
The market is projected to remain in deficit, estimated at approximately 200,000 tonnes under a base case scenario, potentially widening to 600,000 tonnes if smelting operations in regions such as Mozambique face curtailment or closure.
Why can China not simply increase production to close the global supply gap?
China operates under a self-imposed administrative capacity ceiling of 45 million tonnes. With smelters running at approximately 97% utilisation in 2025, there is minimal headroom for incremental Chinese output, making overseas capacity additions the primary lever for global aluminium capacity growth end-2026.
When does the aluminium market shift from deficit to surplus?
Current analysis suggests the market remains in deficit through 2026, with a potential transition toward surplus conditions in 2027 and beyond as large-scale Indonesian projects reach full operating capacity and ramp toward nameplate utilisation.
What are the main demand drivers for aluminium in 2026?
The automotive sector, particularly electric vehicle lightweighting requirements, and the construction industry across Asia and the Middle East are the primary structural demand drivers. Traditional sectors such as packaging show more subdued growth trajectories.
Key Takeaways: What the 77.16 Mt Milestone Signals for Markets
- The projected 4.58% capacity growth rate for 2026 represents a sharp acceleration from the five-year low of approximately 1.1% recorded in 2025.
- The 20.9 Mt addition is heavily concentrated in non-China sources, with Indonesia as the dominant contributor and the Middle East providing steady incremental growth.
- China's 45 Mt administrative ceiling has permanently transferred the role of marginal global supplier to Southeast Asia, with Indonesia now the single most important jurisdiction for forward supply forecasting.
- The market faces a structural deficit through 2026, with surplus conditions only emerging as Indonesian greenfield projects approach full nameplate utilisation in 2027 and beyond.
- Europe's smelting contraction from 4.31 Mt to 3.22 Mt over five years, and North America's persistent stagnation, mean the geographic centre of gravity for primary aluminium production has irreversibly shifted toward Asia and the Middle East.
- Demand-side fundamentals remain structurally supportive through EV adoption and Asian construction activity, while traditional sector softness limits the pace of demand-driven price escalation in the near term.
- The concentration of incremental supply in Indonesia introduces meaningful project-level risks that carry global pricing consequences if commissioning timelines slip or energy delivery commitments are not met.
This article contains forward-looking projections and scenario analysis based on current market data and publicly available industry research. Capacity and production forecasts are subject to revision as commissioning timelines, energy markets, and demand conditions evolve. Nothing in this article constitutes financial or investment advice.
Want to Track the ASX Companies Positioned to Benefit From the Global Aluminium Supply Shift?
Discovery Alert's proprietary Discovery IQ model delivers real-time alerts on significant ASX mineral discoveries — including bauxite and aluminium-related announcements — instantly translating complex data into actionable opportunities for investors at every level. Explore historic discoveries and their market returns on Discovery Alert's dedicated discoveries page, and begin your 14-day free trial today to position yourself ahead of the market.