
July 29, 2026
The Infrastructure Buildout That Will Define the Next Decade of Energy
Energy infrastructure transformations rarely unfold in straight lines. The electrification of industrial economies, the buildout of transmission networks, and the commercialisation of natural gas all followed decades-long arcs shaped by technology cost curves, policy cycles, and geopolitical disruption. Battery energy storage is different. The trajectory currently underway compresses what would historically have been a multi-decade transition into a five-year sprint, with global battery energy storage capacity by 2030 projected to reach levels that would have seemed implausible at the start of this decade.
Understanding what is driving that acceleration, which forecasts are credible, where the supply chain vulnerabilities lie, and which geographies stand to gain or lose requires more than reading a single projection. It requires understanding the structural forces at work beneath the headline numbers.
When big ASX news breaks, our subscribers know first
From 224.8 GW to 1,300 GW: What a Sixfold Expansion Actually Means
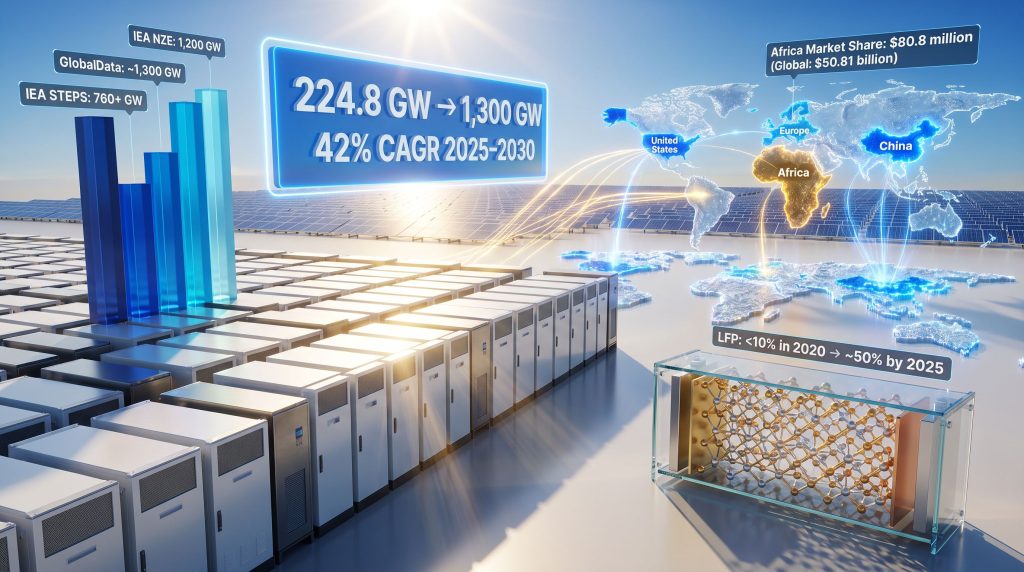
At the end of 2025, total global installed battery energy storage capacity stood at 224.8 GW, according to GlobalData's Strategic Intelligence: Batteries in Power (2026) report. The same report projects that figure reaching approximately 1,300 GW by 2030, representing a compound annual growth rate of 42% over the five-year period.
To contextualise that rate of growth: global solar capacity took roughly fifteen years to achieve a comparable multiplication factor. Wind power deployment, despite strong policy tailwinds across Europe and North America, never sustained a CAGR anywhere near 42% across a five-year window. Battery storage is now expanding faster than any major energy infrastructure category in recorded history.
Part of the reason this growth rate is achievable is that batteries are modular. Unlike large hydroelectric dams or nuclear plants, battery systems can be deployed in months rather than years, scaled incrementally, and co-located with existing generation assets without requiring new transmission corridors. That modularity is both a technical advantage and a commercial accelerant.
GW vs. GWh: Why the Numbers in Different Reports Never Match
One of the most persistent sources of confusion when comparing battery storage forecasts is the distinction between power capacity and energy capacity.
Gigawatts (GW) measure the maximum rate at which a battery system can discharge electricity at any given moment. Gigawatt-hours (GWh) measure the total volume of electricity a system can store and release over time. A 100 MW battery with a four-hour discharge duration has an energy capacity of 400 MWh. Conflating these metrics is the single most common error when comparing forecasts from different sources.
| Metric Type | What It Measures | Representative 2030 Forecast |
|---|---|---|
| GW (Power Capacity) | Maximum discharge rate | IEA NZE: 1,200 GW |
| GWh (Energy Capacity) | Total stored energy volume | Statista: 1,800+ GWh |
| Annual Installed GWh | New capacity added per year | McKinsey: 500-700 GWh/year |
| Cumulative GW (BESS only) | All battery storage installed | GlobalData: ~1,300 GW |
This table alone explains why a reader comparing an IEA report to a Statista dataset to a McKinsey scenario analysis will encounter numbers that appear contradictory but are actually measuring entirely different things.
What the Major Scenarios Actually Project for 2030
Forecast divergence across credible institutions stems from three variables: measurement methodology, the policy environment assumed, and whether the estimate covers all storage technologies or battery storage exclusively.
| Source | 2030 Forecast | Metric | Scenario Basis |
|---|---|---|---|
| GlobalData (2026) | ~1,300 GW | Cumulative installed capacity | Base case, commercially driven |
| IEA | 1,200 GW | Cumulative installed capacity | Net Zero Emissions (NZE) |
| IEA | 760+ GW | Cumulative installed capacity | Stated Policies (STEPS) |
| S&P Global Commodity Insights | 600+ GW | Power sector battery capacity | Base scenario |
| McKinsey | 500-700 GWh/year | Annual installation rate | Scenario range |
| Statista | 1,800+ GWh | Total energy storage capacity | Market projection |
The two figures that sit closest together are the IEA's Net Zero Emissions scenario projection of 1,200 GW and GlobalData's base case of ~1,300 GW. That alignment is meaningful but should not be over-interpreted. The NZE scenario assumes full global implementation of net-zero policy commitments, which represents an optimistic ceiling. GlobalData's base case, by contrast, is grounded in commercially driven investment trends and does not require comprehensive policy alignment to materialise.
The fact that both arrive at similar numbers suggests the high end of the forecast range has genuine commercial justification beyond pure policy aspiration. The IEA's Stated Policies Scenario (STEPS), which anchors projections exclusively to legislation already enacted or formally announced, produces a more conservative estimate of 760+ GW. The approximately 440 GW gap between the STEPS and NZE outcomes represents what analysts sometimes call the policy execution risk premium. Regulatory lag, grid interconnection bottlenecks, permitting delays, and financing constraints in emerging markets are the primary mechanisms through which this gap could widen further.
Under the IEA's NZE pathway, batteries are projected to account for approximately 90% of all new energy storage additions globally through 2030, according to the IEA's Batteries and Secure Energy Transitions (2024) report.
Four Structural Forces Driving the 2025-2030 Deployment Acceleration
1. Renewable Integration Is Creating Structural Demand for Dispatchable Storage
Solar and wind generation are inherently non-dispatchable. They produce electricity when conditions allow, not when demand peaks. This mismatch becomes increasingly problematic as renewable penetration rises, creating periods of surplus generation that cannot be economically absorbed by grids without storage.
The rapid expansion of utility-scale solar has produced a well-documented phenomenon in high-penetration markets: midday electricity prices periodically collapse, sometimes turning negative, as solar output saturates grid capacity. Battery storage systems convert this structural surplus into a dispatchable asset, charging during low-price periods and discharging during high-demand evening windows. This arbitrage function is becoming the primary commercial driver for new battery deployments in mature renewable markets.
Hybrid solar-plus-storage configurations accelerate this dynamic further by sharing a single grid connection point, significantly reducing the capital cost per unit of dispatchable capacity and making projects viable at smaller scale.
2. Lithium-Ion Battery Prices Are Falling Faster Than Most Models Predicted
The IEA projected a 40% decline in lithium-ion battery prices between 2023 and 2030, a forecast that has already been partially validated by market data in the years since publication. Cost compression at this rate changes the economics of storage deployment non-linearly: each percentage point reduction in battery cost expands the addressable market for storage applications that were previously sub-economic.
One of the most consequential consequences of falling costs has been the shift from two-hour to four-hour battery systems. Two-hour systems were engineered primarily for frequency regulation and short-duration grid services. Four-hour systems, at today's costs, can economically capture midday solar surplus and dispatch it into the evening demand peak, a capability that was commercially unviable as recently as 2022.
Analysis from GlobalData's Strategic Intelligence: Batteries in Power (2026) indicates that the power sector is increasingly standardising procurement around four-hour configurations, a shift that is restructuring long-term power purchase agreements across multiple regulated electricity markets. Furthermore, the battery raw materials landscape continues to evolve rapidly, with cost trajectories for key inputs influencing project economics in ways that were not anticipated even two years ago.
3. AI Data Centres Are Creating a New High-Value Commercial Market for BESS
Hyperscale computing facilities require a level of power reliability that conventional backup infrastructure struggles to guarantee. Battery storage systems are progressively displacing traditional uninterruptible power supply (UPS) architecture in large data centres, performing three distinct functions simultaneously:
- Providing millisecond-level power continuity that eliminates the micro-interruptions that can disrupt computing workloads
- Enabling peak shaving by drawing from stored energy during high-tariff periods, directly reducing electricity costs
- Participating in grid ancillary services markets to generate revenue from spare battery capacity
This combination of reliability, cost reduction, and revenue generation makes battery storage economically compelling for data centre operators in a way that purely passive backup systems never were. As AI infrastructure investment accelerates globally, data centres are becoming one of the fastest-growing customer segments for utility-scale battery systems.
4. Broad Electrification Is Expanding Total Electricity Demand
Rising electric vehicle penetration, industrial process electrification, and heat pump deployment are collectively reshaping load profiles across major electricity markets. Higher baseline electricity demand amplifies the economic case for storage systems capable of smoothing supply-demand imbalances, particularly during peak periods when wholesale electricity prices spike. This creates a reinforcing dynamic: more electrification generates more storage demand, which in turn enables more electrification by making variable renewable power more reliable.
How Battery Chemistry Is Evolving Toward 2030
The LFP Transition: From Niche to Dominant
Lithium iron phosphate chemistry has undergone a remarkable commercial transformation. LFP batteries represented less than 10% of the global EV battery market in 2020 and had climbed to approximately 50% by 2025, driven by a combination of thermal stability advantages, longer cycle life, and reduced dependence on cobalt and nickel — two minerals subject to significant price volatility and supply concentration risk.
For stationary storage applications, LFP's dominance is even more pronounced than in the EV segment. The chemistry's tolerance for frequent full charge-discharge cycles without significant capacity degradation makes it well-suited to daily solar arbitrage applications. However, LFP's ascendancy has created a new supply chain concentration: China controls approximately 75% of global phosphoric acid production, a key input material for LFP cell manufacturing. Reducing cobalt exposure has therefore partially replaced one geopolitical dependency with another.
Sodium-Ion Batteries: Genuine Alternative or Long-Term Hedge?
Sodium-ion chemistry has attracted considerable attention as a pathway to reduce lithium dependency in stationary storage. The IEA's Global Critical Minerals Outlook 2025 identifies sodium-ion as a gradually emerging alternative technology, acknowledging its potential while noting it remains commercially marginal relative to LFP.
A less widely understood dimension of sodium-ion's supply chain profile is its manganese sulfate dependency. China produces approximately 95% of global manganese sulfate, the key precursor material for sodium-ion cathode manufacturing. This means that the transition away from lithium-based chemistries does not, in its current form, resolve the underlying geopolitical concentration problem. It redistributes it across a different set of minerals and processing facilities, most of which remain within China's industrial control. In addition, the global lithium market continues to face structural questions that bear directly on which chemistries achieve commercial scale within the 2030 planning window.
The Two-Hour to Four-Hour Inflection Point
The shift in procurement standards from two-hour to four-hour battery systems represents more than a technical specification change. It signals a fundamental reorientation of what battery storage is being deployed to achieve. Two-hour systems were designed around grid ancillary services. Four-hour systems are designed around energy arbitrage — the capture and re-dispatch of variable renewable generation. This operational inflection point is one of the clearest indicators that battery storage has transitioned from a supplementary grid service to a primary generation asset class.
Geographic Concentration and the Market Share Race
China and the United States: Commanding 74.6% of Installed Capacity
At the end of 2025, China and the United States together held 74.6% of global installed battery storage capacity, according to GlobalData. Both markets benefit from vertically integrated supply chains, established regulatory frameworks for storage procurement, and large-scale deployment programmes that have driven down project-level costs through experience curve effects.
China's position is reinforced by its manufacturing dominance. The country controls approximately 85% of global battery cell production capacity and more than 75% of the refining capacity for battery-grade raw materials, according to the IEA. This vertical integration gives Chinese battery manufacturers a structural cost advantage that European and North American competitors have found extremely difficult to close through policy intervention alone.
Europe's 15% Target: Structural Headwinds Ahead
Europe has set a strategic objective to capture approximately 15% of global battery storage capacity by 2030. Achieving that target requires not only accelerating project deployment but reducing dependence on Chinese cell supply chains — a structural challenge that cannot be resolved within a single planning horizon. European gigafactory investment has expanded materially, but the cost competitiveness gap relative to Chinese producers remains significant.
The policy question is whether that gap can be closed through manufacturing subsidies, carbon border adjustments, and procurement preferences, or whether European battery supply chains will remain structurally reliant on Chinese components for the foreseeable future. Moreover, the battery recycling breakthrough now emerging from Chinese industrial facilities adds a further layer of competitive complexity for European manufacturers attempting to build domestically integrated value chains.
Africa: The Resource Paradox
Africa holds some of the world's largest reserves of lithium, cobalt, manganese, and copper — the foundational minerals of battery manufacturing. Yet the continent's battery energy storage market was valued at only $80.8 million in 2025, according to Next Move Strategy Consulting, against a global market valued at $50.81 billion, according to MarketsandMarkets. Africa's share of that global market amounted to approximately 0.16% by value.
This disconnect between resource endowment and industrial participation is one of the more striking structural features of the global battery value chain. The IEA projects a 40% lithium supply deficit and a 30% copper supply deficit by 2035 without a substantial acceleration in upstream mining investment. Africa's mineral wealth positions the continent as a critical upstream supplier, but value-added processing and battery cell manufacturing remain almost entirely absent from the African industrial landscape.
The window for African resource-holding nations to negotiate value-added processing arrangements rather than simply exporting raw materials is finite. As supply deficits materialise, the leverage of resource-rich nations in negotiating downstream industrial partnerships will be greatest before, not after, those deficits become acute.
The next major ASX story will hit our subscribers first
Critical Mineral Supply Risks That Could Constrain 2030 Targets
Projected Deficits in Key Battery Input Materials
| Mineral | Projected Deficit by 2035 | Primary Risk Mechanism |
|---|---|---|
| Lithium | ~40% supply shortfall | Insufficient new mining investment |
| Copper | ~30% supply shortfall | Long project development timelines |
| Phosphoric Acid (LFP) | 75% sourced from China | Geopolitical supply chain exposure |
| Manganese Sulfate (Na-ion) | 95% sourced from China | Limited alternative production capacity |
The growing critical minerals demand driven by the battery storage buildout is reshaping long-term procurement strategies across the energy sector. A less commonly understood dimension of the copper deficit is its timeline. Major copper mining projects typically require eight to twelve years from discovery to sustained commercial production. Even if capital investment in copper mining accelerated substantially today, new supply would not reach the market in time to prevent the projected deficit emerging by 2035.
This structural lag is the primary reason the IEA treats copper supply security as a systemic risk to the energy transition, not merely a commodity price concern. The copper supply crunch represents one of the most tangible constraints on achieving the upper range of global battery energy storage capacity by 2030 projections, particularly for grid-scale installations requiring significant copper wiring and transformer infrastructure.
Why Emerging Chemistries Don't Resolve the Concentration Problem
The instinct to treat next-generation battery chemistries as a solution to supply chain concentration risk is understandable but largely incorrect when examined at the processing level. Transitioning from NMC to LFP reduces cobalt and nickel exposure while increasing phosphate dependency. Moving to sodium-ion reduces lithium dependency while increasing manganese sulfate dependency.
In both cases, the concentration of refining and processing capacity remains overwhelmingly within China's industrial system. Supply chain diversification therefore requires investment in refining and processing infrastructure outside China — a challenge that operates on decadal rather than annual timescales. The Global Battery Alliance's Battery 2030 framework outlines a pathway toward more resilient and circular battery supply chains, however implementation remains uneven across regions.
Strategic Implications for the 2025-2030 Investment Window
The 42% CAGR in battery storage deployment carries direct implications for capital allocation across the energy sector value chain. Consequently, investors and policymakers alike must reckon with the structural conditions shaping global battery energy storage capacity by 2030 across the following dimensions:
- Project developers and utilities are increasingly designing generation portfolios around co-located storage as a default configuration rather than an optional addition
- Equipment manufacturers producing four-hour system components face procurement demand that could structurally outpace supply expansion in certain component categories
- Critical mineral producers operating in lithium, copper, and phosphate sit at an inflection point where supply deficit projections are beginning to influence long-term offtake contract negotiations
- Grid operators are restructuring interconnection standards and ancillary services markets to reflect the growing contribution of battery storage to system reliability
The widening gap between resource endowment and industrial value capture — particularly visible in Africa but relevant across Latin America and parts of Central Asia — represents both a structural risk and a potential opportunity. Nations that invest in refining and processing capability within the current decade stand to capture disproportionate value from the battery supply chain buildout. Those that remain purely upstream mineral suppliers will find the economic gains from the storage revolution concentrated in the manufacturing economies that control the downstream value chain.
This article incorporates data and scenario analysis drawn from the IEA's Batteries and Secure Energy Transitions (2024) report, the Global Critical Minerals Outlook 2025*, and GlobalData's* Strategic Intelligence: Batteries in Power (2026). Market valuation data is sourced from Next Move Strategy Consulting and MarketsandMarkets. All forecasts represent projections based on current data and are subject to material revision as policy, technology, and commodity market conditions evolve. Nothing in this article constitutes financial or investment advice.
Want to Identify ASX Mining Opportunities Fuelled by the Battery Storage Revolution?
Discovery Alert's proprietary Discovery IQ model delivers real-time alerts on significant ASX mineral discoveries — including the critical minerals driving the global battery energy storage buildout — instantly translating complex geological data into actionable insights for investors at every level. Explore historic discovery returns on Discovery Alert's dedicated discoveries page and begin a 14-day free trial to position yourself ahead of the market.