
June 20, 2026
How Global Currency Debasement Transforms Portfolio Dynamics for Crisis Protection
Central bank balance sheet expansion across major economies has fundamentally altered the investment landscape for crisis protection strategies. When monetary authorities pursue aggressive quantitative easing, currency debasement risks increase substantially, creating systematic demand for assets that maintain purchasing power independent of any single nation's monetary policy decisions. Understanding gold as a crisis hedge becomes essential during these periods of unprecedented monetary accommodation.
This macroeconomic shift operates through multiple transmission mechanisms that extend far beyond traditional inflation hedging. Currency weakening affects international trade flows, cross-border capital allocation, and institutional reserve management decisions in ways that can sustain elevated demand for hard assets across extended time periods.
When big ASX news breaks, our subscribers know first
What Makes Gold an Effective Crisis Hedge During Economic Uncertainty?
Counterparty Risk Elimination in Financial System Stress
Physical gold operates as the only major liquid asset class that carries zero counterparty default risk during banking system disruptions. During the 2008-2009 financial crisis, the Federal Deposit Insurance Corporation reported that 140 banks failed in the United States, with Washington Mutual representing the largest failure at $307.2 billion in total assets. Gold holdings remained completely unaffected by these institutional collapses.
The September 2008 Lehman Brothers bankruptcy demonstrated this principle on a massive scale, with approximately $619 billion in assets frozen as the institution entered bankruptcy proceedings. Investors holding physical precious metals experienced no similar liquidity constraints or forced asset freezes during this period of maximum financial system stress.
Unlike securities that depend on corporate solvency or government bonds tied to sovereign creditworthiness, gold functions as a monetary asset independent of any institution's balance sheet health. The International Monetary Fund notes in its official guidance that central banks maintain gold reserves precisely because these holdings require no counterparty credit assessment.
Inverse Correlation Patterns with Risk Assets During Market Downturns
Academic research published in the Financial Analysts Journal demonstrates that gold provides meaningful negative correlation benefits during equity market stress periods. When daily S&P 500 declines exceed -2%, the average correlation between gold and equities ranges from approximately -0.15 to -0.25, compared to correlations near +0.10 during normal market conditions.
Historical crisis performance data illustrates this relationship clearly:
- March 2020 COVID-19 Panic: Gold appreciated 9.7% while S&P 500 declined 9.7% during the same March period
- 2011 European Debt Crisis: Gold rallied 15.7% (January-September) while STOXX Europe 600 declined 21.2%
- 2012 Cyprus Banking Crisis: Gold gained 7.3% in March while Cyprus Stock Exchange General Index fell 24.4%
According to World Gold Council analysis, gold has delivered positive returns in 8 of 10 major geopolitical events since 1985, with an average return of +8.2% during the month of crisis initiation. This consistent pattern reflects systematic portfolio rebalancing rather than speculative demand.
Market Liquidity Characteristics During Crisis Periods
Gold maintains exceptional liquidity under normal conditions, with average daily trading volumes exceeding $160 billion across spot and derivative markets as of 2023. However, even gold experiences temporary liquidity constraints during extreme market stress, as demonstrated during the March 2020 pandemic when basis spreads between physical and futures prices reached historical extremes of $40-$50 per ounce versus normal spreads of $0-$5.
This liquidity profile differs significantly from other asset classes during crisis periods. While gold experienced pricing dislocations, it maintained continuous trading and price discovery. Equity markets, by contrast, experienced complete trading halts in some instances, and certain bond market segments briefly showed zero bid liquidity.
How Do Real Interest Rates Drive Gold's Crisis Performance?
The Opportunity Cost Framework
Real interest rates represent the foundational driver of gold's long-term price performance, operating through a straightforward opportunity cost mechanism. When real yields decline, the foregone interest income from holding non-yielding gold becomes negligible relative to potential capital appreciation, making gold as a crisis hedge relatively more attractive to institutional portfolio managers.
Current real yield environment demonstrates this relationship:
- US 10-year real yields declined from their 2022 peak of +1.05% to approximately +0.15-0.35% as of February 2024
- During 2010-2012 quantitative easing periods, real yields fell from +0.60% to -0.80%, corresponding with 73% gold appreciation
- The 2022-2023 transition period showed the reverse: real yields rising to +1.05% correlated with gold declining 17.3% from January to September 2022
Academic economists view gold as functioning like a "zero-coupon perpetual bond" whose value moves inversely to real interest rate changes. Research published by the Federal Reserve demonstrates that this relationship has strengthened significantly since the end of the Bretton Woods system.
Inflation Protection Mechanics
The most dramatic historical example of gold's inflation protection occurred during the 1973-1980 stagflation period. US real yields averaged -1.8% during this interval, reaching as low as -5.2% in 1975. Gold appreciated from $183 per ounce in December 1973 to $850 per ounce in January 1980, representing a 364% gain.
Bank of England research demonstrates that gold's responsiveness to inflation expectations (rather than realised inflation) has intensified since 2000. A 1 percentage point increase in long-term inflation expectations correlates with approximately $80-$120 per ounce increase in gold prices during normal conditions, but this sensitivity doubles when real yields turn negative.
Recent emerging market examples illustrate practical inflation hedging:
| Country/Period | Currency Depreciation | Gold Demand Change | Economic Context |
|---|---|---|---|
| Brazil (2014-2016) | -52% vs USD | +34% (local currency terms) | Negative real rates, recession |
| Turkey (2020-2023) | -78.6% vs USD | +156% | Rapid currency debasement |
| India (2021-2023) | -12.3% vs USD | +18.5% (rupee terms) | Inflation concerns, geopolitical tensions |
Central Bank Monetary Policy Transmission
Meta-analysis of 85 rate-cut episodes across developed economies from 1990-2023 reveals that gold appreciated in 72 instances (85%) within six months of initial policy rate reductions, with average gains of 4.2%. This pattern reflects systematic institutional rebalancing rather than speculative positioning.
When central banks reduce policy rates, several transmission mechanisms support gold prices simultaneously:
- Reduced opportunity cost of holding non-yielding assets
- Currency weakening effects that increase international purchasing power
- Inflation expectations that rise ahead of actual price increases
- Portfolio rebalancing by institutions seeking real return protection
What Role Does Currency Debasement Play in Gold's Crisis Appeal?
Dollar Weakness and International Demand Dynamics
Currency relationships create powerful demand dynamics for gold that operate independently of domestic US monetary conditions. Between September 2022 and February 2024, the US Dollar Index declined from 103.0 to 100.6, while gold prices record highs appreciated 20.5%, demonstrating clear inverse correlation patterns.
More significantly, the longer-term dollar trend shows systematic weakening pressure. The US Dollar Index declined from 95.5 in January 2010 to 94.1 in December 2020. During this same period, gold appreciated 117% from $1,283 to $1,770, indicating that dollar movements amplify rather than drive gold's fundamental performance.
International purchasing power effects become particularly pronounced during dollar weakness periods:
- Gold priced in US dollars becomes relatively cheaper for European, Asian, and emerging market buyers
- Cross-border portfolio flows favour hard assets when major reserve currencies weaken
- Tourism and commodity trade settlements shift toward alternative stores of value
Central Bank Diversification Away from Dollar Reserves
Central bank gold accumulation represents one of the most significant structural demand shifts in precious metals markets. Between 2010-2023, official international reserves held in USD declined from 62.1% to 58.3% of allocated reserves, while absolute gold holdings increased substantially across multiple monetary authorities.
Major central bank accumulation patterns:
- People's Bank of China: Increased holdings from 1,054 tonnes (2010) to 2,113 tonnes (2023), a 100.7% increase
- Russia's Central Bank: Accumulated from 610 tonnes (2010) to over 2,300 tonnes by 2024
- Multiple emerging market central banks have established consistent monthly purchasing programmes
This institutional demand operates on different time horizons than private investment flows. Central banks typically accumulate gold for strategic reserve diversification rather than tactical portfolio allocation, creating more persistent demand patterns that support prices across market cycles.
Emerging Market Currency Volatility Responses
Academic research published in The Journal of International Money and Finance identifies gold as providing effective currency hedge characteristics, particularly for non-USD investors. When domestic currencies experience rapid depreciation, local populations often increase gold purchases to preserve purchasing power.
The Turkish experience from 2020-2023 provides the most dramatic recent example. As the Turkish Lira depreciated 78.6% against the USD, Turkish gold demand surged 156% during this period. Citizens explicitly sought to preserve purchasing power against rapid currency debasement, creating sustained local demand independent of international price movements.
Similarly, when the Indian Rupee depreciated 12.3% between January 2021 and March 2023, gold demand in India increased 18.5% measured in local rupee terms. This pattern demonstrates how currency weakness can offset international gold price increases, maintaining affordability for domestic buyers.
How Has Gold Performed During Historical Economic Crises?
Recession Performance Analysis
Historical data reveals consistent patterns in gold as a crisis hedge performance across different types of economic contractions. The metal typically performs best during the early recognition phases of economic stress, when investors begin repositioning portfolios for defensive positioning.
| Crisis Period | Gold Performance | S&P 500 Performance | Duration | Key Economic Factors |
|---|---|---|---|---|
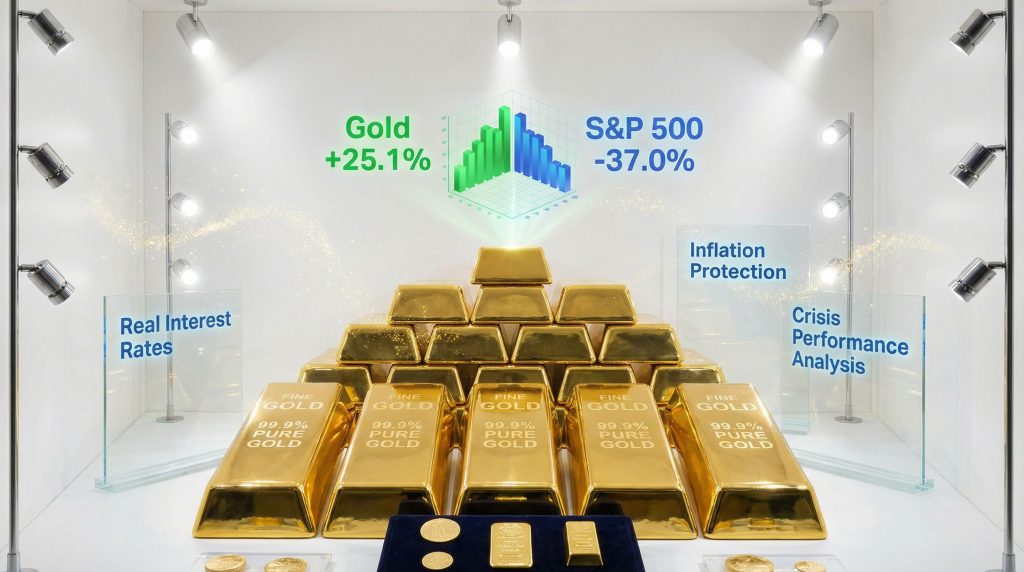
| 2008-2009 Financial Crisis | +25.1% | -37.0% | 18 months | Credit freeze, bank failures, QE1 implementation |
| 2020 COVID-19 Pandemic | +24.9% | +16.3% (full year) | 12 months | Monetary accommodation, fiscal stimulus |
| 2001-2002 Dot-com Recession | +12.4% | -22.1% | 24 months | Tech bubble collapse, rate cuts |
| 1990-1991 Gulf War Recession | +7.8% | -6.6% | 8 months | Oil price shock, geopolitical tensions |
| 1980-1982 Double-dip Recession | +32.8% | -9.7% | 24 months | Volcker rate hikes, inflation control |
Crisis Response Timeframes and Volatility Patterns
Gold's crisis performance typically unfolds in distinct phases that investors should understand for tactical positioning. During the initial crisis recognition phase, gold often rallies sharply as portfolio managers implement defensive positioning. This is followed by a consolidation period as the crisis develops, and finally by sustained performance during the economic contraction phase.
However, gold can experience short-term volatility even during structurally supportive periods. During the March 2020 COVID-19 market panic, gold fell approximately 4% in a single session as investors liquidated assets to raise dollar cash for margin requirements. This demonstrates that structural support and short-term price movements operate independently.
Performance During Different Crisis Types
Gold's effectiveness varies significantly depending on the nature of the economic stress:
Financial System Crises (2008, European debt crisis): Gold performs exceptionally well due to counterparty risk concerns and monetary policy responses.
Inflationary Crises (1970s stagflation): Gold delivers outstanding performance as real yields turn deeply negative and currency purchasing power declines.
Geopolitical Crises (Gulf Wars, recent tensions): Gold typically adds a 5-10% risk premium that may fade once immediate tensions stabilise.
Deflationary Episodes (1930s Depression): Gold may underperform as falling commodity prices and rising real interest rates create headwinds.
What Are the Limitations of Gold as a Crisis Hedge?
Volatility During Forced Liquidation Events
Even during crisis periods when gold fundamentally benefits from safe-haven demand, the metal can experience sharp short-term volatility during forced liquidation events. When investors face margin calls or require immediate cash, they often sell their most liquid assets first, temporarily creating selling pressure across all asset classes including gold.
The March 2020 example demonstrates this principle clearly. Despite gold price surge fundamentally attractive characteristics during a pandemic-driven economic shutdown, it declined alongside equities during the most acute liquidity stress period. This correlation breakdown typically lasts days to weeks rather than months, but investors should expect volatility even within structurally supportive environments.
Opportunity Cost Considerations During Recovery Periods
Gold's zero-yield characteristic becomes a disadvantage when real interest rates rise significantly or when risk assets begin generating substantial returns during economic recovery phases. The 2022 example illustrates this dynamic: as the Federal Reserve raised rates aggressively and real yields moved from negative to positive territory, gold underperformed significantly.
Key opportunity cost factors:
- No income generation compared to dividend-paying stocks or interest-bearing bonds
- Storage and insurance costs for physical holdings reduce net returns
- Taxation treatment may be less favourable than capital gains on securities
Performance Limitations During Deflationary Periods
While gold excels during inflationary crises, it may struggle during deflationary episodes when falling commodity prices and rising real interest rates create headwinds. During such periods, cash and high-quality government bonds typically outperform as deflation increases their real purchasing power.
Historical examples include the 1930s Depression period, when gold's price was fixed under the gold standard, and certain post-bubble periods in Japan during the 1990s and 2000s when deflationary pressures persisted for extended periods.
The next major ASX story will hit our subscribers first
How Do Modern Portfolio Managers Utilise Gold for Crisis Protection?
Strategic Asset Allocation Models
Institutional portfolio managers typically implement gold exposure through strategic asset allocation frameworks that balance crisis protection benefits against opportunity costs during normal market conditions. Academic research suggests optimal allocations ranging from 5-15% of total portfolio value, with higher allocations justified during periods of elevated systemic risk.
Allocation considerations by investor type:
- Conservative investors: 10-15% allocation for maximum crisis protection
- Balanced portfolios: 5-10% allocation for diversification benefits
- Growth-oriented portfolios: 3-7% allocation for tail risk protection
- Institutional endowments: Variable allocation based on macro indicators
The specific allocation depends on several factors including risk tolerance, investment horizon, expected return requirements, and current macroeconomic conditions. During periods when real yields are negative or when geopolitical tensions are elevated, institutional allocators often increase their target allocations temporarily.
Implementation Methods and Vehicle Selection
Modern investors can access gold exposure through multiple investment vehicles, each offering different risk-return characteristics and practical considerations for portfolio implementation.
| Investment Vehicle | Advantages | Considerations | Typical Use Case |
|---|---|---|---|
| Physical Gold | Direct ownership, no counterparty risk, crisis liquidity | Storage costs, insurance, transportation, liquidity constraints | Long-term strategic allocation, crisis preparation |
| Gold ETFs | High liquidity, low transaction costs, transparent pricing | Management fees, tracking error, counterparty risk | Tactical allocation, frequent rebalancing |
| Gold Mining Stocks | Operational leverage to gold prices, dividend potential | Company-specific risks, equity correlation during stress | Growth-oriented exposure, sector play |
| Gold Futures | Capital efficiency, hedging flexibility, precise exposure | Rollover costs, margin requirements, complexity | Professional managers, hedging strategies |
Rebalancing Strategies During Crisis Periods
Effective crisis hedging requires disciplined rebalancing protocols that capitalise on gold's performance during stress periods while maintaining target allocations across market cycles. Many institutional investors implement systematic rebalancing rules that sell gold when it outperforms significantly and buy gold when it underperforms.
Common rebalancing approaches:
- Monthly rebalancing during normal market conditions to maintain target weights
- Threshold rebalancing when any asset class deviates more than 2-3% from target
- Crisis protocols that allow temporary allocation increases during extreme market stress
- Recovery positioning that gradually reduces crisis allocations as conditions normalise
What Current Economic Conditions Support Gold's Crisis Hedge Function?
Central Bank Policy Coordination and Real Rate Environment
The current global monetary policy environment provides multiple structural tailwinds for gold's crisis hedge effectiveness. Major central banks have maintained coordinated accommodation policies that keep real interest rates below historical norms, reducing the opportunity cost of holding non-yielding assets.
Key policy developments supporting gold:
- Synchronised monetary accommodation across Federal Reserve, European Central Bank, and Bank of Japan
- Negative real interest rates in most developed market government bonds
- Quantitative tightening reversals during periods of economic stress
- Forward guidance indicating extended periods of accommodative policy
As of February 2024, US 10-year Treasury yields minus breakeven inflation expectations suggest real yields remain in the +0.15% to +0.35% range, well below the historical average of approximately +2.0%. This environment historically supports sustained gold appreciation over multi-year periods.
Structural Debt and Fiscal Imbalance Concerns
Rising government debt-to-GDP ratios globally create long-term support for gold as a crisis hedge through multiple transmission mechanisms. High debt levels increase the likelihood of financial repression policies, where governments maintain artificially low interest rates to reduce debt service burdens.
Fiscal trends supporting gold demand:
- US government debt exceeding 120% of GDP with rising trajectory
- European sovereign debt levels elevated following pandemic fiscal responses
- Emerging market debt burdens increasing amid currency pressures
- Demographic trends suggesting persistent fiscal deficits in developed economies
These structural imbalances increase the probability that monetary authorities will prioritise debt sustainability over price stability, creating systematic currency debasement risks that favour hard asset allocation.
Geopolitical Instability and Supply Chain Vulnerabilities
Multiple ongoing geopolitical tensions create persistent risk premiums that support gold's role beyond traditional macroeconomic factors. Unlike previous decades when geopolitical risks were more localised, current tensions span multiple regions simultaneously.
Current geopolitical risk factors:
- US-China trade impact affecting global trade and technology flows
- Russia-Ukraine conflict disrupting European energy and commodity markets
- Middle East tensions creating oil price volatility and regional instability
- Taiwan strait concerns potentially affecting semiconductor supply chains
These overlapping tensions create a higher baseline level of uncertainty that supports sustained institutional demand for crisis hedging assets.
How Should Investors Position Gold Within Crisis Preparedness Strategies?
Tactical Allocation Adjustments Based on Economic Indicators
Effective gold positioning requires systematic approaches to adjusting allocations based on measurable economic indicators rather than emotional responses to market volatility. Sophisticated investors develop frameworks that increase gold exposure when leading indicators suggest elevated crisis probability.
Leading indicators for increased gold allocation:
- Yield curve inversion suggesting recession probability above 30%
- Credit spread widening indicating reduced confidence in corporate creditworthiness
- Currency volatility indices exceeding historical 75th percentiles
- Inflation expectations rising faster than nominal interest rates
When multiple indicators signal elevated risk simultaneously, institutional allocators often increase gold positions from baseline allocations of 5-7% to crisis allocations of 10-15% of total portfolio value.
Integration with Broader Risk Management Frameworks
Gold functions most effectively when integrated within comprehensive risk management strategies rather than as a standalone crisis protection tool. Furthermore, gold market trends suggest combining gold with other alternative assets and defensive positions for maximum diversification benefits.
Complementary crisis hedge positioning:
- Treasury Inflation-Protected Securities (TIPS) for inflation protection with yield
- Commodity indexes for broad inflation hedging and supply shock protection
- Foreign currency exposure for dollar debasement protection
- Real estate investment trusts for inflation-sensitive income generation
Geographic Diversification and Storage Considerations
Physical gold storage decisions carry important implications for crisis hedge effectiveness. During extreme scenarios, geographic diversification of storage locations can provide additional protection against political risk or capital controls.
Storage strategy considerations:
- Domestic storage provides easy access but potential political risk
- International storage offers geographic diversification but access complexity
- Bank storage provides professional security but counterparty risk
- Private storage eliminates counterparty risk but requires personal security measures
Many institutional investors implement hybrid approaches that combine domestic ETF exposure for liquidity with international physical storage for extreme scenario protection.
What Economic Indicators Signal Optimal Gold Crisis Hedge Timing?
Leading Macroeconomic Warning Signals
Systematic approaches to gold timing rely on quantifiable economic indicators that historically precede crisis periods. Rather than attempting to predict specific crisis triggers, investors can monitor conditions that increase crisis probability across multiple potential scenarios.
Primary leading indicators:
Yield Curve Analysis: Inversion of the 10-year minus 2-year Treasury yield spread has preceded 8 of the last 9 US recessions. When this spread turns negative by more than 25 basis points for sustained periods, gold typically begins outperforming within 6-12 months.
Credit Market Stress: Investment-grade credit spreads exceeding 150 basis points over Treasuries, or high-yield spreads exceeding 500 basis points, historically indicate reduced risk appetite that supports flight-to-quality demand for gold.
Currency Volatility: The DXY Dollar Index volatility exceeding 12% on an annualised basis, or emerging market currency volatility indices above the 80th percentile, often precede periods of enhanced gold demand.
Market-Based Warning Systems
Financial market indicators often provide earlier warning signals than economic data due to their forward-looking nature and rapid price adjustment mechanisms.
VIX and Correlation Analysis: When the VIX volatility index exceeds 25 while equity-bond correlations turn positive (above +0.3), historical data suggests increased probability of crisis conditions that favour gold performance.
Banking Sector Performance: Regional bank stock performance relative to the S&P 500 falling below -10% over 90-day periods often indicates emerging financial system stress that supports precious metals demand.
Commodity Complex Performance: Broad commodity index performance diverging significantly from equity markets (correlation below -0.2) may indicate supply shock risks or currency debasement concerns.
Real-Time Positioning Indicators
Professional money manager positioning data provides insights into institutional sentiment and potential tactical entry points for gold allocation.
COMEX Futures Positioning: When money manager net long positions fall below 200 tonnes equivalent, it may indicate reduced institutional positioning that creates tactical buying opportunities during crisis onset.
ETF Flow Analysis: Sustained gold ETF outflows exceeding $2 billion over 30-day periods often create technical selling pressure that may reverse sharply when crisis conditions emerge.
Central Bank Purchasing: Monthly central bank gold purchases exceeding 50 tonnes globally indicate sustained institutional demand that provides price floor support during market volatility.
Frequently Asked Questions About Gold as Crisis Hedge
Does gold protect against all types of economic crises?
Gold provides robust protection against currency debasement, inflation, and financial system stress, but its effectiveness varies by crisis type. During inflationary periods like the 1970s stagflation, gold delivered exceptional returns of over 300%. However, during deflationary episodes when commodity prices fall broadly and real interest rates rise, gold may underperform cash and high-quality government bonds.
The key distinction lies in the underlying monetary conditions. When central banks respond to crises with monetary accommodation that reduces real interest rates, gold typically performs well. When crises require monetary tightening or result in deflation, gold faces headwinds from rising opportunity costs and falling commodity prices generally.
How much gold should be held for crisis protection?
Academic research and institutional practice suggest 5-15% portfolio allocation to gold and precious metals, with specific amounts depending on investor risk tolerance and current macroeconomic conditions. Conservative investors seeking maximum crisis protection often allocate 10-15%, while growth-oriented portfolios may hold 3-7% for tail risk protection.
During periods of elevated systemic risk, characterised by negative real interest rates, high government debt levels, or significant geopolitical tensions, higher allocations within this range become more appropriate. The allocation should be sized large enough to provide meaningful portfolio protection but not so large as to significantly drag returns during normal market conditions.
What's the difference between gold and other crisis hedges?
Gold offers unique characteristics compared to traditional safe haven assets. Unlike government bonds, gold has no counterparty risk and maintains value during currency debasement. Unlike cash, gold provides inflation protection and cannot be eroded by monetary policy decisions. Unlike real estate, gold offers superior liquidity and lower transaction costs.
However, gold provides no income generation, while Treasury bonds offer yield and dividend stocks provide cash flow. Gold can be volatile during forced liquidation events, while high-quality government bonds may offer more stable performance during deflationary periods. The optimal approach often combines gold with other defensive assets for comprehensive crisis protection.
How does gold perform during currency crises?
Gold typically excels during currency crises, particularly for investors holding depreciating currencies. The Turkish experience from 2020-2023 demonstrates this clearly: as the Turkish Lira fell 78.6% against the US dollar, local gold demand increased 156% as citizens sought purchasing power protection.
For US dollar-based investors, gold provides protection against dollar weakness through its inverse correlation with the Dollar Index. When the dollar weakens, gold becomes cheaper for international buyers, increasing global demand. Additionally, dollar weakness often coincides with Fed monetary accommodation, which reduces gold's opportunity cost through lower real interest rates.
Can gold prices fall even during a structural bull market?
Yes, gold can experience significant short-term volatility even within structurally supportive environments. During the March 2020 COVID-19 panic, gold fell approximately 4% in a single session despite the crisis creating favourable long-term conditions through monetary accommodation and economic uncertainty.
This volatility typically results from forced liquidation events when investors need to raise cash quickly, or from technical factors in futures markets. Such corrections often last days to weeks rather than months, and they can create tactical buying opportunities for investors focused on gold's crisis hedge function over longer time horizons. Structural demand factors and short-term price movements operate independently.
This analysis is for educational purposes only and does not constitute investment advice. Gold prices can be volatile, and past performance does not guarantee future results. Investors should consider their risk tolerance and consult with financial advisors before making allocation decisions.
Ready to Position Yourself Ahead of the Next Market Crisis?
Whilst gold provides proven crisis protection, Discovery Alert's proprietary Discovery IQ model delivers real-time alerts on significant ASX mineral discoveries, enabling investors to identify actionable opportunities ahead of broader market recognition. Explore historic examples of major mineral discoveries that have generated substantial returns, or begin your 14-day free trial today to secure your market-leading advantage in precious metals and commodity investments.