May 19, 2026
Global Energy Market Tensions and Supply Chain Vulnerabilities
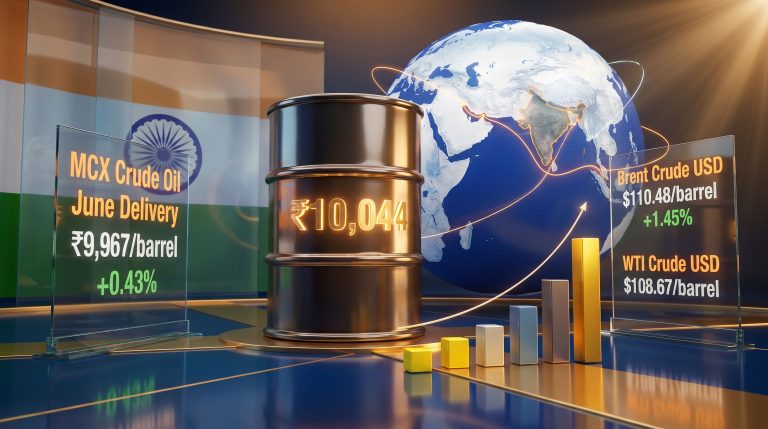
Oil prices surge after Russia-Ukraine talks breakdown, highlighting the fragile nature of global energy security in an increasingly interconnected world. The convergence of pipeline vulnerabilities, strategic reserve constraints, and monetary policy responses creates cascading effects that extend far beyond immediate price fluctuations.
Energy market volatility reflects deeper structural weaknesses in global supply chains that have developed over decades of optimization for efficiency rather than resilience. Modern economies depend on complex networks of pipelines, shipping routes, and storage facilities that create single points of failure capable of triggering widespread disruption.
How Market Psychology Amplifies Energy Price Volatility
Fear-driven trading patterns during geopolitical crises demonstrate how psychological factors can overwhelm fundamental supply-demand calculations. When diplomatic negotiations falter, markets typically incorporate risk premiums that reflect worst-case scenarios rather than actual supply losses. Understanding these oil price rally insights becomes crucial for investors navigating volatile markets.
Historical analysis reveals consistent patterns in crisis-driven price movements. The 1973 oil embargo caused prices to quadruple from $3 to $12 per barrel within months, triggering widespread panic-buying behavior among consuming nations. Similarly, the 2022 Russia-Ukraine invasion saw Brent crude surge 46% in two weeks, climbing from $95 to $139 per barrel before any meaningful supply disruption materialized.
Fear Premium Calculations in Commodity Markets
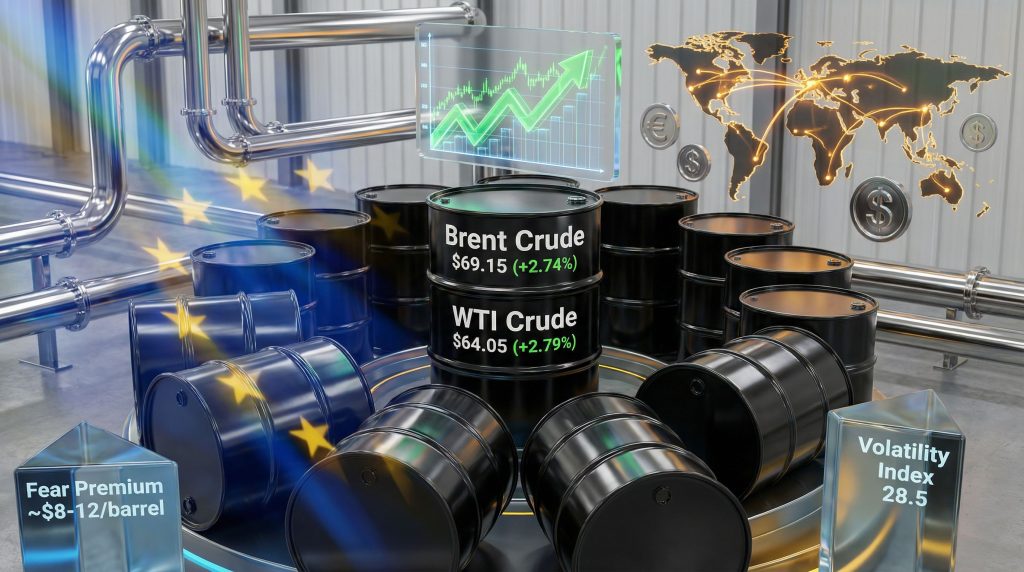
Academic research indicates that geopolitical risk premiums typically range from $5-25 per barrel depending on perceived disruption severity and expected duration. These premiums reflect market psychology more than actual supply constraints, as traders position for potential worst-case outcomes.
During the March 2022 crisis period, crude oil volatility measured by 30-day rolling standard deviation remained 2-3 times baseline levels for over six months. This volatility clustering effect demonstrates how uncertainty perpetuates itself through feedback loops between price movements and trader behavior.
Key volatility indicators during crisis periods:
- Bid-ask spreads widen from normal $0.05-0.10/barrel to $0.25-0.50/barrel
- Trading volumes spike by 75% above historical averages
- Options volatility pricing increases by 200-300%
- Cross-commodity correlations strengthen significantly
Institutional vs Retail Trading Behavior
Different investor classes respond distinctly to geopolitical shocks, creating multi-layered price dynamics. Institutional investors typically reduce speculative positions and increase hedging during uncertainty, creating initial selling pressure. Retail and momentum traders often chase rallies higher as news circulates, generating secondary buying waves.
The 2020 oil price collapse demonstrated extreme psychology-driven behaviour when WTI futures traded at negative $37.63 per barrel in April contracts. This unprecedented event reflected storage saturation fears rather than fundamental supply excess, highlighting how psychological factors can drive markets beyond rational bounds.
When big ASX news breaks, our subscribers know first
Pipeline Infrastructure Vulnerabilities and Economic Consequences
European energy security depends heavily on pipeline networks that create concentrated vulnerabilities across the continent. Pre-2022 data shows Russian pipeline gas supplied approximately 40% of EU natural gas demand, representing roughly 155 billion cubic metres annually through major transit routes.
The Druzhba pipeline system, spanning over 2,700 kilometres, historically transported 1.5-1.6 million barrels per day to Central and Eastern Europe. Ukraine hosts three major Russian pipeline routes accounting for approximately 50% of Russian oil and gas transit to European markets, creating single-point-of-failure risks with no immediate technical redundancy.
Furthermore, these vulnerabilities have led to significant concerns about OPEC production impact on global markets. Additionally, analysts closely monitor natural gas price trends to understand broader energy market dynamics.
Alternative Supply Cost Structures
Liquefied Natural Gas serves as the primary alternative to pipeline gas but carries significant cost differentials that reshape market economics:
| Supply Source | Historical Cost | Crisis Period Cost | Cost Multiplier |
|---|---|---|---|
| Pipeline Gas | $6-8/MMBtu | $40-60/MMBtu | 5-8x increase |
| LNG Spot Market | $8-12/MMBtu | $40-65/MMBtu | 4-5x increase |
| Long-term LNG | $10-15/MMBtu | $25-35/MMBtu | 2-3x increase |
These cost multipliers reflect infrastructure constraints including liquefaction capacity limitations, shipping bottlenecks, and regasification terminal availability. Europe operated approximately 10 major LNG terminals as of early 2022, insufficient to handle massive supply substitution requirements.
Regional Price Differential Dynamics
Supply disruptions create distinct regional pricing patterns that reflect infrastructure constraints and alternative supply costs. The Brent-WTI spread widened from historical $2-3 per barrel to $15-20 per barrel during 2022 sanctions implementation, as Brent incorporated Atlantic Basin supply disruption premiums while WTI reflected domestic US market conditions.
Asian LNG markets experienced dramatic price decoupling from European natural gas markets, creating 3-5 times arbitrage opportunities for flexible supply. Singapore LNG spot prices reached $65/MMBtu compared to European prices of $40/MMBtu, demonstrating how regional infrastructure limitations prevent price convergence.
Inflation Transmission Through Energy Price Shocks
Energy price volatility creates multiple transmission channels that propagate inflationary pressures throughout economic systems. Energy comprises approximately 8-9% of consumer price index baskets in major developed economies, but its volatility historically explains 30-40% of overall CPI volatility.
Oil-to-gasoline pass-through rates demonstrate the speed and magnitude of energy price transmission to consumers. Short-term elasticity measures show 70-80% pass-through within 1-3 weeks, with long-term pass-through approaching 90-100% over monthly periods.
However, various factors contribute to oil price stagnation factors that can moderate these transmission effects during certain market conditions.
Central Bank Policy Response Frameworks
Monetary authorities face complex trade-offs when responding to energy-driven inflation. The Federal Reserve's historical approach involves distinguishing between temporary energy price spikes and persistent inflationary pressures that require policy intervention.
Energy inflation impact calculations:
- 1% oil price increase = approximately 0.06-0.08% immediate CPI impact
- Secondary effects through transportation and manufacturing add 0.04-0.06%
- Cumulative 6-month impact reaches 0.10-0.15% for sustained price increases
Central banks monitor core inflation measures that exclude energy to assess underlying price pressures. However, sustained energy price increases create second-round effects through wage negotiations and business pricing decisions that can become embedded in longer-term inflation expectations.
Currency Market Interactions
Energy price shocks create significant pressures on currency markets, particularly affecting energy-importing nations' exchange rates and balance of payments positions. Historical analysis shows 5-8% currency depreciation for major energy importers during sustained oil price spikes.
Petrodollar recycling patterns during price spike periods involve:
- Increased current account surpluses for energy exporters
- Capital outflows from energy importers to cover trade deficits
- Safe-haven asset demand during geopolitical uncertainty
- Commodity currency strength (CAD, NOK) relative to energy-importing currencies
Supply Chain Resilience and Critical Chokepoint Analysis
Global energy flows depend on critical infrastructure chokepoints that create systemic vulnerabilities. The Strait of Hormuz handles approximately 20-21% of global oil supply, while the Suez Canal accommodates roughly 12% of global trade including significant energy flows. The broader implications of these vulnerabilities are explored in research on oil market disruptions.
Pipeline network analysis reveals concentration risks across major transit routes. Three Ukrainian pipelines represent 50% of Russian transit capacity to Europe, while alternative routing through Belarus-Poland faces both capacity limitations and political restrictions.
Strategic Reserve Deployment Strategies
International Energy Agency member countries maintain strategic petroleum reserves equivalent to 90 days of net imports as minimum requirements. Current average holdings of 120 days provide buffer capacity for coordinated emergency releases during supply disruptions.
The 2022 coordinated release involved 180 million barrels from US Strategic Petroleum Reserve combined with 60+ million barrels from other IEA members. This 240+ million barrel release created sustained downward price pressure for 4-6 months, demonstrating the effectiveness of coordinated intervention.
Reserve utilisation effectiveness metrics:
- Release timing: Most effective within 48-72 hours of crisis onset
- Volume thresholds: Minimum 1-2% of global demand for measurable impact
- Duration: 90-180 day releases provide sustained market influence
- Coordination: Multi-country releases multiply effectiveness by 2-3x
Financial Market Dynamics and Energy Price Discovery
Futures markets serve as primary price discovery mechanisms for global energy commodities. WTI and Brent crude futures typically lead physical crude pricing by 24-48 hours, with futures market signals providing guidance for spot transactions worldwide.
During crisis periods, futures market participation patterns shift dramatically. March 2022 WTI futures averaged over 350,000 contracts daily compared to historical averages of 200,000 contracts, indicating increased hedging and speculative activity. These patterns often correlate with broader oil price trade war trends.
Options Market Volatility Pricing
Energy options markets provide insights into expected volatility and tail risk pricing during geopolitical uncertainty. Implied volatility measures from crude oil options typically spike 200-300% above baseline levels during crisis periods.
Volatility term structure analysis:
- Short-term (30-day) implied volatility: 35-45% during crisis vs 20-25% baseline
- Medium-term (90-day) implied volatility: 30-35% during crisis vs 18-22% baseline
- Long-term (180-day) implied volatility: 25-30% during crisis vs 15-20% baseline
Cross-Asset Correlations During Energy Crises
Energy price shocks create predictable correlation patterns across asset classes that reflect inflation expectations and economic growth concerns. Historical analysis shows typical sector rotation patterns during sustained energy price increases:
| Sector | Crisis Performance | Recovery Performance | Correlation to Oil |
|---|---|---|---|
| Energy | +15% to +25% | -5% to -10% | +0.85 |
| Utilities | +8% to +12% | +2% to +5% | +0.45 |
| Materials | +5% to +8% | -2% to +3% | +0.65 |
| Consumer Discretionary | -12% to -15% | +8% to +12% | -0.55 |
Bond markets typically experience selling pressure as energy-driven inflation expectations rise. 10-year Treasury yields historically increase by 40-60 basis points during sustained oil price spikes as investors demand higher real returns to compensate for inflation risk.
Regional Energy Security Policy Evolution
Energy crises accelerate policy changes that reshape long-term supply relationships and infrastructure priorities. The 2022 European energy crisis catalysed unprecedented policy responses including emergency LNG procurement, pipeline diversification projects, and accelerated renewable energy deployment.
LNG infrastructure expansion timelines:
- Emergency floating storage units: 6-12 months deployment
- Permanent regasification terminals: 24-36 months construction
- Pipeline interconnections: 18-48 months depending on complexity
- Strategic reserve expansion: 12-24 months for additional capacity
Alternative Energy Investment Acceleration
Crisis-driven renewable energy investment follows predictable patterns based on energy security concerns rather than purely economic considerations. Historical analysis shows 2-3x acceleration in renewable deployment during extended fossil fuel price spikes.
European renewable capacity additions increased 40-50% above planned levels during 2022-2023, reflecting policy prioritisation of energy independence. However, grid stability considerations limit the pace of renewable integration, requiring parallel investments in storage and grid infrastructure.
Technology deployment cost-benefit analysis:
- Solar PV: Break-even at oil prices above $70-80/barrel for 5+ years
- Wind power: Competitive with gas-fired generation at $60+/barrel oil equivalent
- Battery storage: Economic for grid balancing at energy costs above $100/MWh
- Green hydrogen: Requires sustained high fossil fuel prices for competitiveness
The next major ASX story will hit our subscribers first
Investment Portfolio Positioning for Energy Volatility
Energy market volatility creates both risks and opportunities for diversified investment portfolios. Historical analysis reveals predictable patterns in asset performance during different phases of energy price cycles. Consequently, understanding when oil prices surge after Russia-Ukraine talks breakdown provides valuable timing insights for portfolio managers.
Portfolio hedging strategies during energy crises:
- Direct energy sector allocation: 5-15% depending on risk tolerance
- Inflation-protected securities: Treasury Inflation-Protected Securities (TIPS)
- Currency hedging: Particularly for energy-importing economy exposure
- Commodity exposure: Broader commodity basket beyond energy alone
Volatility Trading Opportunities
Energy derivatives markets offer sophisticated instruments for capitalising on price volatility without direct commodity exposure. Volatility ETFs and options strategies provide access to energy market movements with defined risk parameters.
During the 2022 crisis, energy volatility strategies generated 25-40% returns for investors positioned ahead of geopolitical developments. However, these strategies require precise timing and risk management given the rapid reversal potential in energy markets.
Key volatility indicators for timing:
- VIX levels above 30 indicate heightened market stress
- Energy sector relative strength index (RSI) above 70 suggests overbought conditions
- Crude oil futures contango/backwardation patterns signal supply expectations
- Options put/call ratios reveal sentiment extremes
Long-Term Structural Market Changes
Geopolitical energy crises create lasting changes in global supply chain configuration and investment flows. The shift toward energy supply diversification and regional energy independence represents a structural change from decades of globalisation and efficiency optimisation.
Supply chain reconfiguration trends:
- Nearshoring of energy-intensive manufacturing to secure supply regions
- Redundant pipeline and LNG infrastructure development
- Strategic reserve expansion beyond minimum IEA requirements
- Long-term supply contract renegotiation with geographic diversification
Investment capital increasingly incorporates geopolitical risk premiums into energy project evaluation, favouring developments in politically stable regions even at higher cost. This shift potentially adds 10-20% to project capital costs but provides supply security benefits valued by energy importers.
The transition creates both challenges and opportunities across energy markets. While higher costs and supply disruption risks persist, the accelerated development of alternative energy sources and more resilient infrastructure may ultimately enhance global energy security through diversification. In addition, detailed analysis from CNBC's Iran oil coverage provides insights into regional supply dynamics.
Investment disclaimer: This analysis is for educational purposes only and does not constitute investment advice. Energy markets involve substantial risks and may not be suitable for all investors. Past performance does not guarantee future results. Readers should consult qualified financial professionals before making investment decisions.
Ready to Capitalise on Energy Market Volatility?
Discovery Alert's proprietary Discovery IQ model delivers real-time alerts on significant ASX mineral discoveries, including energy and resource opportunities that could benefit from current market volatility. With global energy tensions creating unprecedented opportunities in resource markets, explore Discovery Alert's historic examples of how major discoveries can generate substantial returns, then begin your 14-day free trial to position yourself ahead of market movements.