June 6, 2026
The global energy landscape stands at a pivotal juncture where traditional supply-demand dynamics undergo fundamental restructuring. Industrial economies worldwide face mounting pressure to secure reliable energy sources while navigating complex geopolitical realignments and infrastructure constraints. This transformation reflects deeper macroeconomic currents that extend beyond short-term market fluctuations, encompassing structural shifts in production capacity, trade relationships, and consumption patterns across major economic regions.
Natural gas markets exemplify these broader energy system transitions, with global gas demand 2026 projections indicating significant acceleration following a period of constrained growth. The intersection of supply capacity expansion, regional demand variations, and evolving trade mechanisms creates a complex framework for understanding future energy market dynamics. Furthermore, energy security policies across major economies are reshaping market fundamentals.
Economic Fundamentals Driving Market Recovery
Industrial expansion across key consuming regions forms the cornerstone of anticipated demand acceleration. Manufacturing sectors requiring consistent baseload energy capacity demonstrate renewed investment activity, particularly in Asia-Pacific markets where economic recovery gains momentum. This industrial resurgence reflects broader macroeconomic stabilization following supply chain disruptions and inflationary pressures that characterized earlier periods.
The projected 2% global gas demand 2026 growth represents substantial improvement from 2025's sub-1% expansion rate. This acceleration stems from multiple convergent factors: strengthened manufacturing output, power generation infrastructure investments, and energy transition challenges that promote natural gas as a transitional fuel. According to the International Energy Agency's Gas Market Report, this recovery trajectory reflects "renewed industrial activity and infrastructure development programs" across major consuming economies.
Key Recovery Indicators:
• Manufacturing PMI improvements in major Asian economies
• Infrastructure investment commitments exceeding $200 billion globally
• Energy-intensive industries resuming capacity expansion plans
• Power generation facilities transitioning from coal-based systems
Regional economic fundamentals vary significantly, with Asia-Pacific markets leading consumption growth while North American demand remains relatively stable. This geographical disparity reflects differing industrial policy frameworks, energy transition strategies, and economic development trajectories. European markets face unique challenges balancing energy security concerns with decarbonisation objectives, creating complex demand dynamics influenced by geopolitical considerations.
The supply-side response to strengthening demand fundamentals involves substantial infrastructure investments and capacity expansions. Production facilities worldwide demonstrate increased utilisation rates, while new project developments accelerate through regulatory approval processes. This supply-demand rebalancing represents a crucial test of global energy market resilience and adaptability.
When big ASX news breaks, our subscribers know first
Regional Market Dynamics and Consumption Patterns
Asia-Pacific markets function as the primary engine for global gas demand 2026 expansion, with China and emerging economies driving majority consumption increases. Manufacturing sector requirements for reliable energy sources support sustained demand growth, while power generation transitions favour cleaner-burning fossil fuel alternatives over traditional coal-based systems.
Chinese industrial policy frameworks emphasise energy security through supply diversification, creating sustained demand for imported natural gas. This strategic approach reflects broader economic priorities balancing environmental objectives with industrial competitiveness requirements. In addition, Southeast Asian markets similarly demonstrate growing natural gas adoption as economies expand manufacturing capacity and modernise energy infrastructure.
Asian Market Characteristics:
| Country/Region | Demand Growth Driver | Infrastructure Focus |
|---|---|---|
| China | Industrial expansion | Import terminal capacity |
| India | Power generation | Pipeline distribution networks |
| Southeast Asia | Manufacturing growth | LNG receiving facilities |
| Japan/South Korea | Energy security | Supply diversification |
North American market dynamics present contrasting patterns, with domestic consumption remaining stable while export capacity expands dramatically. United States production capabilities exceed internal demand requirements, positioning the country as a major global supplier through liquefied natural gas exports. For instance, the US natural gas forecast indicates continued strong production levels supporting global exports.
Industrial demand patterns across North America reflect broader economic shifts toward technology and service sectors, reducing traditional heavy industry natural gas consumption. However, power generation applications demonstrate growth as utilities transition from coal-fired facilities to cleaner-burning gas-powered plants. This sectoral rebalancing maintains overall demand stability while supporting environmental policy objectives.
European consumption patterns face unique pressures from geopolitical developments and policy mandates. The European Union's commitment to eliminate Russian natural gas imports by November 2027 necessitates substantial supply chain restructuring and infrastructure investments. This transition period creates temporary demand volatility while longer-term consumption patterns adjust to new supply arrangements.
The regional integration of natural gas markets accelerates through enhanced LNG trade flexibility and infrastructure improvements. Traditional pipeline-dependent regions gain access to global supply sources, reducing dependence on specific producers and improving supply security. Consequently, this structural evolution toward more integrated global markets represents a fundamental shift from historically isolated regional pricing and supply dynamics.
LNG Infrastructure Expansion and Market Transformation
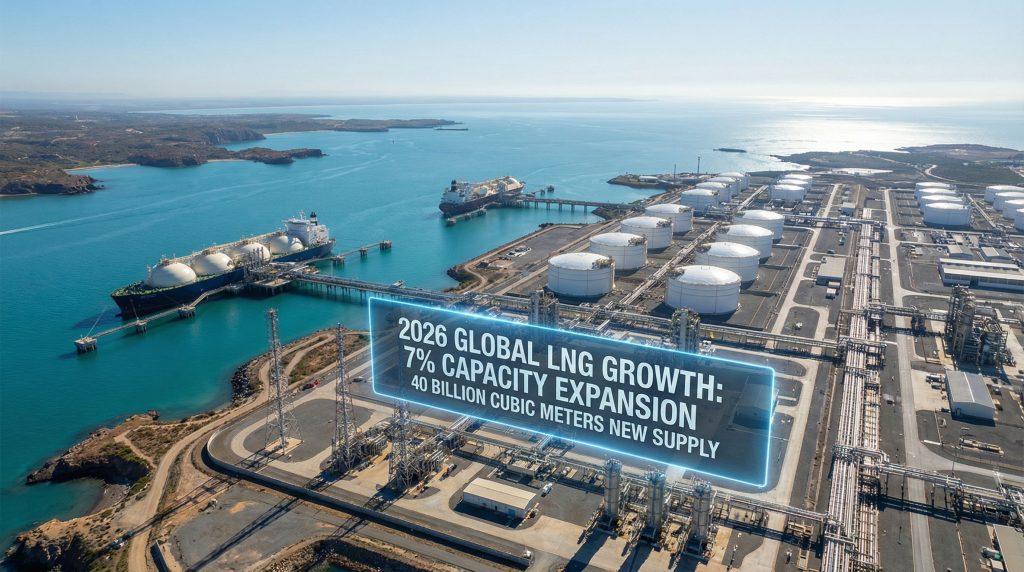
Liquefied natural gas production capacity expansion reaches unprecedented scales, with global LNG supply growth accelerating to more than 7% in 2026. This represents the fastest expansion pace since 2019, adding approximately 40 billion cubic meters (bcm) of new global supply capacity. The infrastructure buildout reflects massive capital commitments and technical achievements in gas processing and transportation technologies.
North American facilities account for the vast majority of new capacity additions, with three major United States export terminals entering operational phases. This capacity concentration in North America transforms global supply dynamics, providing flexible export capability responsive to international price differentials and demand variations. The U.S. Gulf Coast region emerges as a critical global supply hub with world-class infrastructure and operational capabilities.
Major Infrastructure Developments:
• Investment Decisions: More than 90 bcm annually of LNG capacity reaching final investment decision
• U.S. Leadership: Over 80 bcm of approved annual capacity in United States projects
• Capital Intensity: Individual projects requiring $10-15 billion total investment
• Technical Specifications: Advanced cooling systems achieving -161°C for gas liquefaction
The infrastructure expansion enables destination-flexible LNG operations, allowing cargo redirection based on market conditions and price optimisation. This operational flexibility transforms natural gas from a pipeline-constrained regional commodity into a globally tradeable product similar to crude oil. Shipping capabilities expand correspondingly, with specialised LNG carrier fleets growing to support increased trade volumes.
Project development timelines reflect improved regulatory processes and standardised engineering approaches. Environmental approval procedures streamline while maintaining safety and environmental protection standards. Furthermore, financial markets demonstrate renewed confidence in LNG project economics, providing necessary capital at competitive rates for approved developments.
Global Project Distribution
The geographical distribution of new capacity heavily favours North American projects, though global development activity spans multiple regions. Australian facilities contribute additional capacity, while Middle Eastern and African projects advance through development phases. This diversified global expansion reduces supply concentration risks while improving market resilience against regional disruptions.
Technology improvements enhance operational efficiency and reduce production costs across new facilities. Modular construction techniques accelerate project timelines while standardised equipment designs improve reliability and maintenance efficiency. These technological advances support project economics and improve long-term operational performance.
Global Price Dynamics and Market Integration
Natural gas pricing mechanisms undergo fundamental transformation as LNG trade flexibility increases market integration across traditionally isolated regions. Henry Hub natural gas spot prices, the North American benchmark, average approximately $3.50 per MMBtu throughout 2026, representing modest stability despite accelerating demand growth.
This pricing stability reflects balanced market dynamics where accelerating supply growth offsets demand acceleration. The 7%+ LNG supply expansion provides downward price pressure, while 2% demand growth creates upward pressure. Infrastructure improvements enhance market liquidity and reduce regional price disparities, contributing to overall price moderation.
Price Correlation Factors:
| Market Influence | Direction | Price Impact |
|---|---|---|
| LNG Supply Growth (>7%) | Accelerating | Downward Pressure |
| Global Demand Growth (~2%) | Accelerating | Upward Pressure |
| Infrastructure Expansion | Improving | Enhanced Liquidity |
| Geopolitical Tensions | Variable | Volatility Increases |
Destination-flexible LNG capabilities strengthen correlations between regional pricing benchmarks. European Title Transfer Facility (TTF) and Asian Japan-Korea-Malaysia (JKM) pricing demonstrate increased correlation with North American Henry Hub rates as arbitrage opportunities narrow. This price convergence reflects improved market efficiency and reduced regional isolation.
Regional price differentials compress as flexible supply responds rapidly to temporary scarcity premiums. LNG operators optimise cargo allocation based on real-time price signals, directing supply to highest-value markets. This arbitrage mechanism reduces extreme regional price spikes while supporting more stable global pricing patterns.
Weather and Volatility Factors
Weather-related demand variations continue influencing short-term price movements across all regions. Winter heating requirements in northern markets and summer cooling demand in hot climates create seasonal volatility patterns. However, improved supply flexibility moderates extreme price swings compared to historical patterns when pipeline constraints limited supply responses.
Early 2026 price volatility demonstrates ongoing market sensitivity to geopolitical developments and adverse weather conditions. Natural gas prices displayed "strong volatility across Asia, Europe and North America in January 2026 amid adverse weather effects and geopolitical tensions." These temporary disruptions highlight continued risk factors despite overall market improvements.
Financial markets develop increasingly sophisticated natural gas trading mechanisms, including futures contracts, options, and other derivative instruments. These financial tools enable price risk management and support more efficient price discovery across regional markets. Market participants gain improved tools for hedging price exposure and optimising supply arrangements.
Investment Patterns and Capital Allocation
Capital investment in LNG infrastructure reaches extraordinary levels, with 2025 marking the second highest annual amount on record for final investment decisions. More than 90 billion cubic meters per year of liquefaction capacity receives project approval, demonstrating unprecedented industry confidence in long-term market fundamentals.
United States projects dominate investment activity, securing over 80 billion cubic meters of approved annual capacity. This concentration reflects favourable regulatory environments, abundant feedstock supplies, and strategic geographical positioning for global export markets. Gulf Coast terminals benefit from existing pipeline infrastructure and deep-water port facilities optimised for LNG carrier operations.
Investment Distribution Analysis:
• Total Global Commitments: $150+ billion across approved projects
• U.S. Project Share: Approximately 75% of global capacity additions
• Average Project Scale: 15-20 bcm annual production capacity
• Construction Timeline: 4-6 years from approval to operations
Project financing structures reflect mature capital markets and institutional investor confidence in LNG sector fundamentals. Long-term supply contracts provide revenue certainty supporting project debt arrangements, while equity investors demonstrate appetite for infrastructure assets with stable cash flow profiles. Export credit agencies from multiple countries support international project development through competitive financing programmes.
The capital allocation pattern indicates strategic positioning for anticipated demand growth in Asian markets. Project developers prioritise flexible supply arrangements enabling cargo optimisation based on market conditions. This commercial approach reflects lessons learned from earlier LNG projects with restrictive destination clauses that limited operational flexibility. Investors exploring energy sector opportunities might consider the Shell investment opportunity as part of broader portfolio diversification.
Technology and Environmental Investment
Technological innovation receives substantial investment focus, with advanced liquefaction processes improving energy efficiency and reducing operational costs. Modular construction techniques reduce project risks and accelerate deployment timelines. Digital monitoring systems enhance operational efficiency and safety performance across new facilities.
Environmental compliance requirements influence project design and operational procedures, with developers implementing advanced emission control systems and carbon reduction initiatives. These environmental investments reflect regulatory requirements and market preferences for cleaner energy infrastructure.
Record-level LNG contracting activity accompanies infrastructure investments, with long-term supply agreements providing commercial foundation for project development. Asian utility companies secure supply arrangements extending 15-20 years, demonstrating confidence in natural gas's role in their energy transition strategies.
Risk Assessment and Market Vulnerabilities
Despite positive growth fundamentals, multiple risk factors maintain potential for significant market disruption. Geopolitical tensions affect critical supply routes and infrastructure facilities, while weather-related events create temporary supply constraints and demand spikes. These risk sources require careful monitoring and contingency planning across the global gas supply chain.
Primary Risk Categories:
Geopolitical Risks: Trade route disruptions, export restrictions, and international sanctions affecting major producing regions
Infrastructure Vulnerabilities: Technical failures, maintenance requirements, and capacity bottlenecks limiting distribution capabilities
Economic Sensitivity: Industrial demand fluctuations, currency volatility, and financing availability affecting project development
Environmental Factors: Extreme weather events, regulatory changes, and climate policy developments impacting operations
The European Union's mandate to eliminate Russian natural gas imports by November 2027 creates substantial supply chain restructuring requirements. Alternative supply arrangements necessitate new infrastructure investments and commercial relationships, introducing transitional risks during the adjustment period. This policy-driven market transformation represents the largest supply chain reorganisation in global natural gas history.
Asian market dependence on LNG imports creates vulnerability to supply disruptions and shipping constraints. Critical chokepoints including the Strait of Hormuz and Strait of Malacca concentrate shipping risks, while limited domestic production alternatives reduce supply security. Emergency storage capabilities provide limited buffer capacity against extended supply interruptions.
Weather and Climate Risks
Weather volatility demonstrates significant impact potential, with extreme cold events driving unprecedented demand spikes while hurricanes and storms affect production and infrastructure operations. Climate change trends suggest increasing frequency and intensity of extreme weather events, requiring enhanced system resilience and emergency response capabilities.
Financial market conditions influence project development timelines and operational flexibility. Rising interest rates increase project financing costs, while currency fluctuations affect international trade arrangements. Capital market disruptions could delay planned infrastructure investments and reduce supply growth rates below projected levels. The broader oil price rally impact on energy markets also influences natural gas investment decisions.
Technological risks encompass both operational failures and cybersecurity threats targeting critical infrastructure. Complex LNG facilities require sophisticated control systems vulnerable to technical malfunctions and cyber attacks. Industry investments in cybersecurity and redundant systems address these vulnerabilities while maintaining operational efficiency.
The increasing interconnectedness of global gas markets provides enhanced resilience against localised disruptions while creating potential for systemic risks. Market concentration in key supply regions or infrastructure bottlenecks could amplify regional problems into global market disruptions.
The next major ASX story will hit our subscribers first
Market Outlook and Strategic Implications
The convergence of accelerating supply capacity and recovering demand creates favourable conditions for global gas demand 2026 expansion, though multiple variables could influence actual outcomes. Market participants must navigate evolving trade relationships, infrastructure constraints, and policy frameworks while positioning for long-term growth opportunities.
Supply-demand balance calculations suggest adequate global capacity to meet projected consumption growth, with new LNG facilities providing crucial flexibility for regional demand variations. However, the concentration of new supply sources in North America creates dependencies that require careful risk management and supply diversification strategies.
Strategic implications for energy companies encompass investment priorities, geographical focus areas, and technological capabilities. Companies with flexible supply arrangements and diversified market exposure demonstrate competitive advantages in volatile market conditions. Operational excellence and financial strength become critical differentiators during periods of rapid market evolution.
Policy and Regulatory Considerations
Policy developments across major consuming regions influence long-term demand trajectories and investment requirements. Energy security priorities drive infrastructure investments and supply diversification initiatives, while environmental regulations shape technology choices and operational procedures. Market participants must adapt strategies to accommodate evolving regulatory frameworks.
The transformation toward more integrated global natural gas markets creates opportunities for improved efficiency and risk management while introducing new competitive dynamics. Traditional regional market incumbents face increased competition from global suppliers, while consumers benefit from enhanced supply security and price transparency.
According to Reuters analysis, the substantial supply increases expected in 2026 will likely maintain competitive pricing while enabling greater market access for developing economies.
Investment decisions should consider multiple scenario outcomes and maintain flexibility to adapt to changing market conditions. The analysis presented reflects current market intelligence and projections that may differ from actual outcomes due to unforeseen developments in global energy markets, geopolitical events, or technological changes.
Ready to Capitalise on Energy Market Transitions?
Discovery Alert's proprietary Discovery IQ model delivers real-time alerts on significant mineral discoveries across the energy transition sector, instantly empowering subscribers to identify actionable opportunities in critical minerals and resources that power global energy infrastructure. Understand why major mineral discoveries can lead to substantial market returns by exploring Discovery Alert's dedicated discoveries page, showcasing historic examples of exceptional outcomes, and begin your 30-day free trial today to position yourself ahead of the market.