May 17, 2026
Central banks worldwide face an increasingly complex challenge as traditional monetary policy transmission mechanisms intersect with volatile energy markets in unprecedented ways. The relationship between borrowing costs and commodity pricing has evolved beyond simple inverse correlations, creating multi-layered feedback loops that influence everything from infrastructure investment to currency valuations. Understanding these dynamics becomes critical as global interest rate hikes and energy prices continue to shape investment landscapes and economic policy decisions across major economies, particularly as markets grapple with gold as an inflation hedge and broader inflationary pressures.
This interconnected system operates through various channels, where monetary policy decisions ripple through financial markets, affecting energy sector financing, production economics, and ultimately consumer pricing. The complexity increases when considering how different regional economies respond to these pressures, creating opportunities and risks for investors navigating these turbulent waters.
What Drives the Complex Relationship Between Interest Rates and Energy Pricing?
The Transmission Mechanism of Monetary Policy to Commodity Markets
When central banks adjust interest rates, the impact on energy markets extends far beyond simple supply and demand fundamentals. Higher borrowing costs directly affect energy companies' ability to finance exploration, production expansion, and infrastructure development. Capital-intensive projects such as offshore drilling, LNG terminals, and renewable energy installations become less attractive when financing costs increase by 200-300 basis points, as seen during recent tightening cycles.
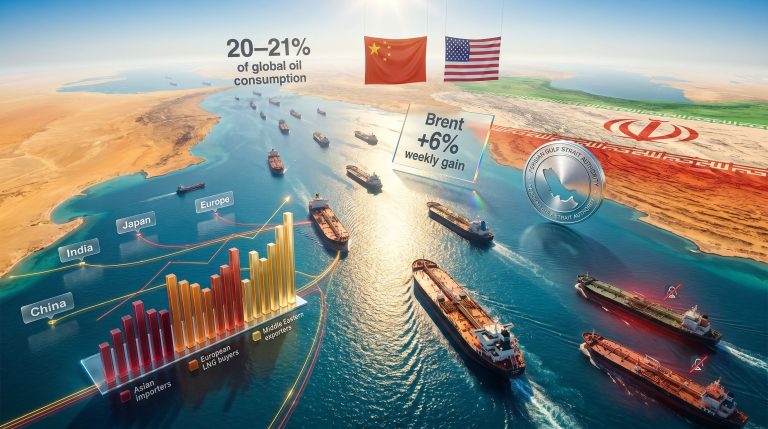
The currency effect amplifies these impacts significantly. As interest rates rise in major economies, their currencies typically strengthen, making dollar-denominated commodities more expensive for international buyers. This dynamic has been particularly pronounced in oil price movements, where a 5% appreciation in the US dollar historically correlates with approximately a 3-4% decline in crude oil prices, all else being equal.
Investment flow dynamics create additional complexity. Higher rates redirect capital from energy assets toward fixed-income securities, reducing liquidity in commodity markets. Private equity and institutional investors often require risk premiums of 300-500 basis points above government bonds for energy infrastructure projects, making these investments less competitive during rate hiking cycles.
Investment Flow Dynamics in Energy Markets
The movement of capital between asset classes during monetary policy shifts creates distinct patterns in energy markets. Institutional investors managing $85 trillion globally regularly rebalance portfolios based on risk-adjusted returns, with energy allocations typically declining when risk-free rates rise above 4%.
Risk premium adjustments become particularly important for long-term energy infrastructure projects. When 10-year government bond yields increase from 2% to 5%, energy project developers typically see their required returns rise to 12-15%, making marginal projects uneconomical. This threshold effect explains why energy investment can drop sharply rather than gradually during tightening cycles.
Furthermore, this trend is compounded by concerns about US inflation and debt, which continue to influence Federal Reserve policy decisions and market sentiment across multiple asset classes.
When big ASX news breaks, our subscribers know first
How Do Central Bank Decisions Shape Energy Market Expectations?
Forward Guidance and Energy Futures Markets
Central bank communications have become increasingly influential in shaping energy market expectations. Federal Reserve forward guidance affects energy futures markets through multiple channels, with oil futures volatility increasing by 25-30% following FOMC meetings that signal policy changes. This relationship has strengthened as algorithmic trading now accounts for approximately 70% of energy futures trading volume.
European Central Bank policy impacts extend beyond traditional monetary channels to affect renewable energy investments directly. ECB asset purchase programmes have kept European government bond yields artificially low, enabling countries like Germany to issue green bonds at yields 50-100 basis points below comparable sovereign debt. This preferential treatment has accelerated Europe's energy transition, with renewable capacity additions averaging 40 GW annually since 2020.
The Bank of England's response to North Sea oil production economics illustrates how regional central banks must balance multiple objectives. As North Sea production costs average $45-55 per barrel, BoE policy decisions affecting the pound's exchange rate directly impact project viability and investment flows.
Quantitative Tightening Effects on Commodity Financing
The reversal of quantitative easing policies creates specific challenges for energy sector financing. As central banks reduce bond holdings, credit spreads typically widen, with energy sector bonds seeing spreads increase 150-200 basis points more than investment-grade corporates during tightening cycles.
Reduced liquidity affects energy trading and hedging strategies significantly. Market makers report that bid-ask spreads in energy derivatives can double during periods of central bank balance sheet reduction, increasing transaction costs for energy companies managing price risk.
Corporate bond market conditions deteriorate particularly for energy companies during monetary tightening. High-yield energy issuers face refinancing costs that can increase by 400-600 basis points, forcing companies to reduce capital expenditure or delay project development.
What Are the Regional Variations in Rate-Energy Price Correlations?
North American Energy Market Responses
North American energy markets demonstrate unique sensitivity patterns to interest rate changes due to the prevalence of short-cycle shale production. Shale oil economics typically require breakeven prices of $35-50 per barrel, but financing costs can shift these thresholds significantly. When drilling rig day rates increase from $15,000 to $25,000 due to higher equipment financing costs, marginal wells become uneconomical.
Canadian oil sands projects show different sensitivity patterns due to their longer payback periods of 15-20 years. These projects require stable, long-term financing, making them particularly vulnerable to sustained periods of higher rates. Oil sands capital expenditure has historically declined by 30-40% when Canadian government bond yields rise above 4%, creating additional challenges alongside energy transition challenges facing the sector.
LNG export facility investment decisions reflect complex interactions between rate policy and global demand. US LNG projects requiring $20-30 billion in capital become challenging to finance when project IRRs fall below 12-15%, typically occurring when long-term rates exceed 5%.
European Energy Security and Monetary Policy
European energy markets face unique challenges as natural gas import dependency reaches 85% in some countries. Currency-adjusted pricing becomes critical when the euro weakens during divergent monetary policy periods. A 10% euro depreciation typically increases gas import costs by 8-12% for European utilities.
Renewable energy transition financing under ECB policy shifts demonstrates the interaction between monetary and environmental policy. European renewable energy investment has averaged €180 billion annually, with approximately 60% dependent on favourable financing conditions enabled by accommodative ECB policy.
Energy storage investment economics in rate-sensitive markets show how emerging technologies depend on monetary conditions. Battery storage projects typically require 8-10% IRRs to compete with conventional generation, making them sensitive to changes in the risk-free rate.
Asia-Pacific Energy Import Dynamics
Japanese and South Korean LNG purchasing power varies significantly with rate policy and currency movements. Japan imports approximately 75 million tons of LNG annually, with costs fluctuating based on yen strength and domestic financing conditions. A 15% yen weakening can increase LNG import costs by $8-12 billion annually.
Chinese energy demand patterns interact with domestic monetary policy through credit availability for heavy industry. China's industrial electricity consumption, representing 65% of total demand, responds to credit cycles with a 6-9 month lag.
Australian resource export competitiveness depends partly on RBA policy decisions affecting the Australian dollar. LNG export revenues of $50-70 billion annually benefit from currency weakness during accommodative monetary policy periods.
How Do Energy Price Shocks Influence Central Bank Rate Decisions?
Inflation Targeting Challenges During Energy Volatility
Central banks face complex decisions when energy price movements threaten inflation targets. According to recent analysis of interest rate hikes, central banks must carefully balance their response to energy-driven inflation. The following table illustrates typical responses to different energy shock scenarios:
| Energy Shock Type | Typical Central Bank Response | Timeline |
|---|---|---|
| Supply Disruption | Temporary accommodation | 6-12 months |
| Demand Surge | Gradual tightening | 12-18 months |
| Geopolitical Crisis | Case-by-case assessment | Variable |
Supply disruptions often prompt central banks to look through temporary price spikes, recognising that tighter monetary policy cannot address supply constraints. However, when energy price increases persist beyond 12-18 months, central banks typically begin tightening to prevent broader inflation expectations from becoming unanchored.
Demand-driven energy price increases present different challenges, as they often reflect underlying economic strength that may justify monetary tightening. Central banks monitor core goods and services inflation to distinguish between energy-specific and broad-based price pressures.
Core vs. Headline Inflation Considerations
Central banks increasingly focus on core inflation measures that exclude energy prices, but this approach has limitations. Energy costs represent 15-25% of consumer price indices in major economies, making it difficult to ignore sustained energy price movements.
Communication strategies during energy-driven inflation spikes require careful balance. Central banks must acknowledge energy price impacts while maintaining credibility regarding their inflation targets. Market surveys suggest central bank credibility declines when energy-driven inflation exceeds targets for more than 18 months.
Policy tool effectiveness varies when energy costs dominate price indices. Traditional interest rate policy may be less effective when inflation stems primarily from supply constraints rather than demand pressures.
What Investment Strategies Work During Rate-Energy Price Cycles?
Sector Rotation Patterns During Monetary Cycles
Energy sector performance relative to broader markets shows predictable patterns during rate cycles. Energy stocks typically outperform by 5-10 percentage points during the initial phases of rate hiking cycles when energy prices rise faster than discount rates adjust.
Utility sector positioning during rate hiking cycles requires careful consideration of regulatory frameworks. Regulated utilities with rate adjustment mechanisms often perform better during inflationary periods, while competitive generators face margin pressure from rising financing costs.
Renewable energy investment timing strategies depend on policy support and financing conditions. Solar and wind project development typically accelerates during low-rate periods, with installation delays of 12-24 months common when financing costs rise significantly.
Currency and Commodity Hedging Approaches
Dollar strength impacts energy pricing through multiple channels, creating opportunities for sophisticated hedging strategies. Commodity producers often hedge 60-80% of near-term production when currency volatility exceeds 15% annually.
Cross-currency energy investment strategies become important when monetary policies diverge between major economies. European energy companies investing in US projects typically hedge 75-100% of dollar exposure when interest rate differentials exceed 200 basis points.
Inflation-protected securities during energy price volatility offer portfolio diversification benefits. TIPS breakeven rates often underestimate actual inflation when energy price increases persist, creating opportunities for informed investors. However, concerns about global market impacts continue to influence broader portfolio allocation decisions.
How Do Emerging Market Dynamics Amplify Rate-Energy Interactions?
Capital Flight and Energy Import Costs
Interest rate differentials between developed and emerging markets create capital flow patterns that amplify energy price impacts. Emerging market currencies typically depreciate 15-25% during major central bank tightening cycles, increasing energy import costs substantially.
Local currency devaluation impacts on fuel import bills create fiscal challenges for energy-importing emerging economies. Countries spending more than 5% of GDP on energy imports often face balance of payments crises during combined rate hiking and energy price shock periods.
Energy subsidy sustainability during monetary tightening becomes a critical policy challenge. Emerging market governments often reduce energy subsidies by 20-40% when fiscal pressures mount, creating additional inflationary pressures.
Resource Exporter Vulnerability Patterns
Oil-dependent economies face complex trade-offs during rate-energy price cycles. While higher energy prices improve terms of trade, reduced global demand from tighter monetary policy can offset these benefits. Countries with oil exports exceeding 40% of total exports show particular sensitivity to these dynamics.
Natural gas exporters and project development financing face challenges when long-term contracts fail to keep pace with financing cost increases. LNG projects with 20-year purchase agreements may become uneconomical if contracted prices don't adjust for higher capital costs.
Mining sector capital allocation under global rate pressures reflects changing risk-return profiles. Base metals mining companies typically reduce exploration budgets by 25-35% when global financing costs rise above historical averages.
The next major ASX story will hit our subscribers first
What Are the Long-Term Structural Changes in Rate-Energy Relationships?
Energy Transition and Capital Requirements
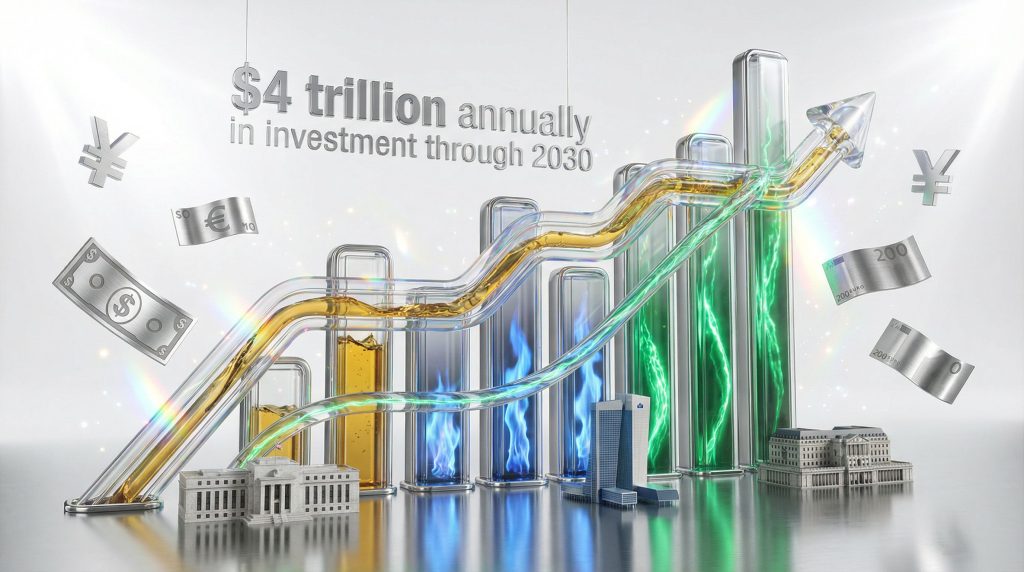
The global energy transition fundamentally alters traditional rate-energy relationships due to massive capital requirements and long asset lives. Renewable energy projects typically have asset lives of 25-30 years, making them highly sensitive to long-term interest rates.
The global energy transition requires an estimated $4 trillion annually in investment through 2030, making interest rate environments critical for renewable energy deployment timelines and costs.
Wind and solar projects show 60-80% sensitivity to financing costs, meaning a 200 basis point increase in borrowing costs can reduce project IRRs by 150-200 basis points. This sensitivity explains why renewable capacity additions slow significantly during tightening cycles.
Technology Innovation and Financing Sensitivity
Battery storage economics under varying cost of capital scenarios demonstrate how emerging technologies depend on favourable financing conditions. Grid-scale battery projects require capital costs below $300/kWh to compete with conventional generation, but financing costs above 8% can push total project costs beyond economic thresholds.
Hydrogen infrastructure development and rate environment impacts show similar patterns. Green hydrogen projects typically require 15-20 year payback periods, making them extremely sensitive to long-term rates. Each 100 basis point increase in financing costs adds approximately $0.50/kg to hydrogen production costs.
Carbon capture technology investment thresholds depend heavily on financing conditions due to unproven commercial viability and high capital intensity. CCUS projects require government support or carbon prices above $80/ton to achieve adequate returns, with financing costs often determining project feasibility.
Geopolitical Risk Premiums in Energy Markets
Monetary policy uncertainty compounds energy security concerns by affecting long-term investment decisions. Energy security investments typically require 20-30 year commitments, making them vulnerable to shifts in rate expectations.
Strategic petroleum reserve policies and interest rate considerations involve complex cost-benefit calculations. Maintaining strategic reserves costs approximately $1-2 per barrel annually, with financing costs representing 30-40% of total carrying costs.
Energy independence investment priorities across rate cycles show how national security concerns interact with economic considerations. Countries typically accelerate domestic energy development when rate environments favour long-term infrastructure investment.
Frequently Asked Questions About Interest Rates and Energy Prices
Do Higher Interest Rates Always Reduce Energy Demand?
Higher interest rates don't uniformly reduce energy demand due to complex transmission mechanisms. Direct effects through consumer spending typically take 12-18 months to materialise, while indirect effects through economic activity can extend 24-36 months.
Consumer behaviour changes during rate hiking cycles vary by income level and energy type. Higher-income households reduce discretionary energy consumption first, while essential heating and transportation demand remains relatively stable even during significant rate increases.
Industrial energy consumption patterns under monetary tightening show manufacturing sectors reducing energy use by 5-15% during recessions, but data centres and technology sectors often maintain growth despite higher financing costs.
How Long Do Rate Changes Take to Impact Energy Markets?
Financial market reactions occur immediately, but real economy effects develop gradually. Energy futures markets typically adjust within hours of central bank announcements, while physical market impacts emerge over 6-18 months.
Investment decision lag times in energy sector projects create extended adjustment periods. Exploration and development spending typically responds within 2-4 quarters, while major infrastructure projects may take 3-5 years to reflect changed financing conditions. As RBA options become limited, these timing considerations become increasingly critical for policy makers.
Supply response timelines to changed financing conditions vary significantly by energy type. Shale oil production can adjust within 6-12 months, while conventional oil projects require 3-7 years to respond to changed economics.
Which Energy Sectors Are Most Sensitive to Rate Changes?
Capital-intensive sectors show highest sensitivity to interest rate changes. Offshore oil, nuclear, and large-scale renewables typically see investment reductions of 40-60% when financing costs rise substantially.
Short-cycle production activities like shale oil and gas processing demonstrate moderate sensitivity, with investment adjustments of 20-30% during rate cycles.
Energy trading and marketing operations show low direct sensitivity to rates but face indirect impacts through credit availability and hedging costs.
Conclusion: Navigating the Intersection of Monetary Policy and Energy Markets
Key Takeaways for Investors and Policymakers
Successfully navigating global interest rate hikes and energy prices requires understanding multiple timeframes and transmission mechanisms. Short-term traders must monitor central bank communications and policy signals, while long-term investors need to assess structural changes in energy transition financing.
Risk management strategies across monetary policy cycles should incorporate correlation breakdowns during crisis periods. Energy-focused portfolios historically show 15-25% higher volatility during periods of monetary policy uncertainty.
Portfolio diversification considerations during energy price volatility include geographic diversification across monetary policy regimes and exposure to both conventional and renewable energy sources with different financing sensitivities.
Future Outlook and Monitoring Framework
Leading indicators for rate-energy price correlation shifts include central bank balance sheet changes, credit spread movements, and currency volatility patterns. Investors monitoring these indicators gain 3-6 month advance warning of significant correlation shifts.
Central bank communication patterns to track include forward guidance on neutral rates, financial stability assessments, and climate-related policy statements. These communications increasingly influence long-term energy investment decisions.
Energy market structural changes that may alter traditional relationships include grid modernisation, storage deployment, and hydrogen infrastructure development. These changes create new sensitivity patterns that require updated analytical frameworks.
Disclaimer: This analysis is for educational purposes only and does not constitute investment advice. Energy markets and interest rate relationships are subject to rapid changes based on economic conditions, geopolitical events, and policy decisions. Investors should conduct their own research and consider their risk tolerance before making investment decisions.
Want to Stay Ahead of Energy Market Opportunities?
Discovery Alert's proprietary Discovery IQ model delivers real-time insights on significant ASX mineral discoveries, helping investors identify actionable opportunities as energy and commodity markets respond to changing interest rate environments. Understand why major mineral discoveries can lead to substantial market returns by exploring Discovery Alert's dedicated discoveries page, and begin your 14-day free trial today to position yourself ahead of the market.