July 27, 2026
Understanding the Current Global Refining Crisis
The global petroleum industry operates through an intricate network of processing facilities designed to transform crude oil into usable products, yet this critical infrastructure faces unprecedented strain. While crude oil extraction garners significant attention, the downstream refining sector represents a distinct bottleneck that increasingly constrains fuel availability worldwide. Understanding these oil refining bottleneck limitations requires examining capacity utilisation metrics, maintenance cycles, and the technical complexities that prevent refineries from operating at theoretical maximum output.
When big ASX news breaks, our subscribers know first
What Defines the Global Oil Refining Bottleneck Crisis?
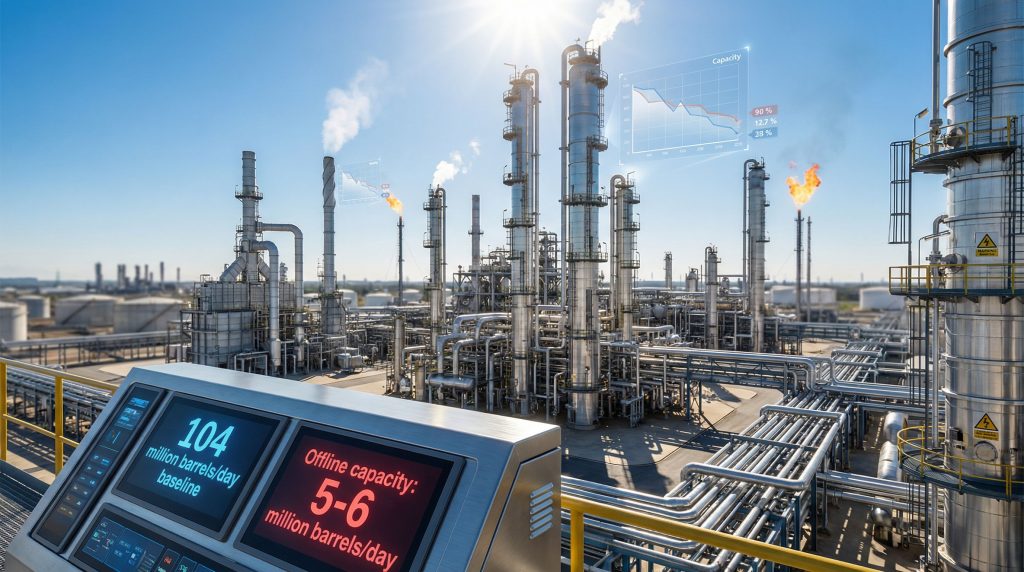
The International Energy Agency reports global refining capacity at approximately 104.8 million barrels per day as of 2025, yet operational reality differs substantially from nameplate capacity. This infrastructure operates under significant constraints, with 5-6 million barrels per day of capacity remaining offline or severely limited, representing roughly 5.2-5.7% of total global processing capability.
Capacity Utilisation vs. Demand Growth Metrics
Global refining facilities currently achieve utilisation rates between 82-85%, translating to actual production of 85.8 to 89.1 million barrels per day. This gap between theoretical and practical capacity reflects several operational realities that plague the industry. Furthermore, this oil price stagnation insights analysis reveals how refining constraints contribute to pricing volatility.
Key Capacity Constraints:
• Scheduled maintenance cycles: 3-4 million barrels per day reduction during peak maintenance seasons
• Unplanned outages: 0.15-0.25 events per facility annually, lasting 5-15 days each
• Aging infrastructure: Average facility age exceeding 30 years increases failure frequency
• Operational flexibility requirements: Crude grade switching necessitates reduced throughput
The demand side presents equally challenging dynamics. Global oil demand grows at approximately 1.2 million barrels per day annually through 2027, driven primarily by aviation fuel recovery and petrochemical feedstock requirements. Meanwhile, refining capacity additions struggle to match this pace, averaging only 0.8-1.0 million barrels per day in new capacity annually.
| Metric | Current Level | Annual Change |
|---|---|---|
| Global Refining Capacity | 104.8 million bpd | +0.8-1.0 million bpd |
| Operational Capacity | 85.8-89.1 million bpd | Variable |
| Global Demand Growth | – | +1.2 million bpd |
| Offline Capacity | 5-6 million bpd | +3-4% annually |
Technical Infrastructure Constraints
October 2025 exemplified how multiple factors can converge to create severe capacity reductions. During this period, global refining experienced a 2.9 million barrel per day month-over-month capacity decline, representing a 3.1% reduction from September levels. This event resulted from hurricane-related shutdowns in the U.S. Gulf Coast, planned turnaround maintenance at three major Asian refineries, and environmental compliance upgrades at a European facility.
Unplanned outages occur with increasing frequency as infrastructure ages. Historical data indicates 8-12 unplanned events annually across major U.S. refining facilities, with aging facilities experiencing 3-4% annual increases in outage frequency. These disruptions compound scheduled maintenance impacts, creating cascading supply pressure across global petroleum markets.
The current market environment reflects a multi-year structural supply deficit rather than cyclical tightness, where steady demand maintenance against declining supply capacity creates violent pricing dynamics.
Modern refineries require 6.0-6.5 megajoules per barrel of crude processed, while aging facilities consume 7.5-9.0 megajoules per barrel, reducing effective capacity and increasing operating costs. This efficiency differential explains why older facilities face closure pressure, particularly in North America where aging infrastructure cannot compete economically with modern Asian facilities.
How Do Geopolitical Disruptions Amplify Refining Constraints?
Geopolitical events create asymmetric impacts on global refining capacity, with relatively small absolute losses triggering disproportionate market effects. The oil refining bottleneck intensifies when facilities serving strategic crude grades or regional markets experience disruption, forcing remaining capacity to operate beyond sustainable levels.
Regional Capacity Loss Assessment
Ukrainian long-range drone campaigns against Russian refining infrastructure resulted in permanent capacity losses of approximately 0.7-0.8 million barrels per day through early 2026. The International Energy Agency confirmed that seven major Russian refineries experienced significant production reductions, including facilities at Ryazan, Tuapse, Syzran, and TATNEFT complexes. Moreover, these disruptions have influenced broader oil price movements trade war dynamics across global markets.
| Region | Capacity Loss (bpd) | Impact Type | Recovery Timeline |
|---|---|---|---|
| Russian Facilities | 700,000-800,000 | Permanent | Indefinite |
| Ukrainian Domestic | 350,000-450,000 | Infrastructure | 12-24 months |
| California Regulatory | 340,000-380,000 | Policy-driven | Permanent |
These losses represent 2.0-2.2% of global refining capacity, yet market impacts exceed proportional expectations due to crude grade specificity. Russian refineries typically processed heavy, sour crude grades that require specialised equipment configurations. When these facilities shut down, alternative refineries cannot simply increase throughput without accepting significant operational penalties.
Supply Chain Vulnerability Mapping
Shipping route disruptions compound refining constraints by extending delivery times and increasing freight costs. Ongoing Middle East tensions and Red Sea instability have increased shipping distances by 3,200-4,200 nautical miles from Persian Gulf origins to European and Asian destinations. This rerouting around the Cape of Good Hope adds 10-14 days to transit times and increases freight costs by 25-35%.
The concentration of global refining capacity creates systemic vulnerability. The top 10 refining companies operate 40-45% of global capacity, with the top three companies controlling 12-15% combined. This concentration means single facility shutdowns affect 0.5-1.5% of global capacity, while simultaneous disruptions at multiple facilities create cascading supply pressure.
Critical Chokepoints:
• Strait of Hormuz: Controls access to 20% of global petroleum liquids
• Suez Canal/Red Sea: Primary route for Middle East exports to Europe and Asia
• Singapore Strait: Key transit point for Asian refining products
• Panama Canal: Critical for inter-ocean petroleum product movements
In addition, OPEC market influence continues to shape how these disruptions affect global supply chains.
Why Are Premium Fuel Grades Disappearing First?
The oil refining bottleneck manifests most visibly in premium fuel shortages, as these products require more complex processing and higher-quality feedstock. Sydney's 95 ULP shortage during late 2025 exemplifies how capacity constraints eliminate premium products before affecting base fuel availability.
Technical Processing Requirements for High-Octane Fuels
Premium fuel production demands specialised processing units and extensive energy inputs. The production sequence for high-octane gasoline requires multiple stages:
- Primary distillation separating crude into base fractions
- Catalytic cracking breaking heavy molecules into lighter components
- Reforming processes rearranging molecular structures for higher octane
- Alkylation units combining light molecules for octane enhancement
- Final blending achieving precise octane specifications
Each stage consumes energy and processing capacity, making premium fuels economically rational candidates for production cuts during capacity constraints. Refineries prioritise base fuel production to maintain overall supply volumes, accepting margin compression on premium products rather than risking broader supply disruption.
Refinery Prioritisation During Capacity Constraints
When refineries face feedstock limitations or capacity constraints, operational decisions follow economic and technical hierarchies. Base fuels require less complex processing and accept wider quality specifications, allowing refineries to maintain production volumes with reduced complexity.
Production Priority Hierarchy:
• Diesel fuel: Essential for commercial transport and logistics
• Regular gasoline: Largest volume consumer product
• Jet fuel: Critical infrastructure with limited substitution options
• Premium gasoline: Higher complexity, smaller market share
• Specialty products: Lowest priority during constrained operations
Australia's import dependency exacerbates premium fuel vulnerability. According to recent government negotiations with oil refiners, the country imports 85-90% of refined petroleum products, making domestic markets particularly susceptible to global supply disruptions. When global refining becomes constrained, Australian importers face extended shipping times of 3-4 weeks from major regional refining centres, increased freight costs, and potential product unavailability when preferred specifications become globally scarce.
What Role Does Shipping Fuel Play in the Crisis?
Heavy fuel oil markets represent a critical component of the oil refining bottleneck, as these "bottom-of-barrel" products experience extreme price volatility during capacity constraints. Container shipping relies heavily on marine fuel specifications that require specific refining processes, creating additional pressure on already constrained facilities.
Heavy Fuel Oil Market Dynamics
Marine fuel represents the heaviest fraction of refining output, traditionally considered a low-value byproduct. However, shipping industry demand for compliant bunker fuel has transformed this market segment into a critical constraint. The International Maritime Organization's 2020 sulfur regulations eliminated high-sulfur fuel options, forcing refineries to produce more complex low-sulfur marine fuels.
| Fuel Type | Sulfur Content | Processing Complexity | Price Premium |
|---|---|---|---|
| High Sulfur Fuel Oil | >3.5% | Low | Baseline |
| Low Sulfur Fuel Oil | <0.5% | Medium | +15-25% |
| Marine Gas Oil | <0.1% | High | +40-60% |
Global shipping fleet fuel consumption averages 4-5 million barrels per day, representing roughly 4.5-5% of global petroleum demand. When refining capacity tightens, marine fuel production competes directly with other distillate products including diesel fuel, heating oil, and jet fuel, creating cross-product pricing pressure throughout the refining system.
Marine Fuel Specification Requirements
Shipping fuel specifications require precise sulfur content control and specific viscosity characteristics. Refineries must balance marine fuel production against other distillate demands, particularly during maintenance cycles or unplanned outages. The complexity of marine fuel compliance has reduced the number of refineries capable of producing specification-compliant products, concentrating production at facilities with advanced sulfur removal capabilities.
Container shipping cost transmission mechanisms amplify the economic impact of marine fuel price increases. A $10 per barrel increase in marine fuel costs translates to approximately $200-300 per twenty-foot equivalent unit (TEU) in shipping costs, depending on route distance and fuel efficiency. These costs transmit directly to consumer goods pricing, creating inflationary pressure beyond direct petroleum product increases.
How Do Refinery Types Create Processing Bottlenecks?
Refinery configuration specificity creates fundamental constraints in the global oil refining bottleneck. Different refineries are engineered for specific crude oil grades based on API gravity and sulfur content, with minimal interchangeability between crude types without significant operational penalties.
Crude Oil Grade Compatibility Matrix
Global refining capacity divides roughly into three categories based on crude processing capability. Approximately 40% of global capacity is specialised for heavy crude processing, 35% for medium crude, and 25% for light crude. These configurations cannot efficiently substitute alternative crude grades without accepting 10-20% capacity reductions and significant margin compression.
| Crude Type | API Gravity | Sulfur Content | Global Refining % | Processing Complexity |
|---|---|---|---|---|
| Light Sweet | >35° API | <0.5% | 25% | Low |
| Medium Sour | 25-35° API | 0.5-1.5% | 35% | Medium |
| Heavy Sour | <25° API | >1.5% | 40% | High |
When geopolitical disruptions alter crude supply patterns, refineries configured for unavailable crude grades cannot simply switch to alternative feedstock. Heavy crude refineries require specialised equipment including coker units, hydrocracking facilities, and extensive sulfur removal systems. Light crude refineries lack this equipment and cannot process heavy crude without major capital investment.
Geographic Mismatch Analysis
The oil refining bottleneck intensifies when available crude grades mismatch regional refinery configurations. Sanctions preventing Iranian heavy crude from reaching configured capacity, or shipping disruptions affecting light crude exports from West Africa, force refineries to operate below capacity or shut down entirely.
Australia exemplifies geographic mismatch vulnerability. The country's remaining refining capacity is configured primarily for light, sweet crude processing, yet global light crude availability fluctuates based on production decisions in countries including Libya, Algeria, and Nigeria. When light crude becomes scarce or expensive, Australian refineries cannot efficiently process alternative crude grades, forcing increased reliance on imported refined products.
Regional Mismatch Examples:
• European refineries: Configured for Russian heavy crude, now seeking alternative supplies
• Asian facilities: Optimised for Middle Eastern medium crude, vulnerable to shipping disruption
• U.S. Gulf Coast: Designed for heavy Canadian and Venezuelan crude, affected by production changes
• Australian refineries: Light crude dependency creates import vulnerability
The next major ASX story will hit our subscribers first
Which Regions Face the Highest Refining Stress?
Regional analysis reveals significant disparities in refining capacity, utilisation rates, and vulnerability to supply disruption. The oil refining bottleneck affects different regions based on infrastructure age, crude access, and strategic positioning within global petroleum flows.
Asia-Pacific Refining Capacity Assessment
Asia-Pacific represents 35-37% of global refining capacity, with China alone accounting for 14-15% of worldwide processing capability. Chinese refining capacity has expanded rapidly, overtaking the United States as the world's largest refining region. However, this expansion creates new vulnerabilities as Chinese facilities rely heavily on imported crude from the Middle East and West Africa.
| Region | Capacity (million bpd) | Global Share | Utilisation Rate | Import Dependency |
|---|---|---|---|---|
| Asia-Pacific | 36-39 | 35-37% | 78-82% | 65-75% |
| North America | 25-27 | 24-26% | 85-90% | 15-25% |
| Europe | 14-16 | 13-15% | 70-75% | 85-95% |
| Middle East | 8-10 | 8-10% | 80-85% | Net Exporter |
Southeast Asian expansion projects include major facilities in Vietnam, Malaysia, and Indonesia, adding approximately 1.2-1.5 million barrels per day of new capacity between 2025-2028. However, these facilities enter operation during periods of constrained global capacity, potentially providing marginal relief rather than surplus capability.
North American Capacity Reduction Analysis
North American refining has contracted significantly since 2020, with 1.1 million barrels per day of capacity permanently removed through facility closures. Seven major facilities have shut down, including refineries in California, Pennsylvania, and Newfoundland. This capacity reduction occurs as domestic crude production remains elevated, creating export pressure on crude while importing refined products.
The U.S. Gulf Coast maintains the highest concentration of refining capacity, processing approximately 8-9 million barrels per day across dozens of facilities. However, this concentration creates vulnerability to weather-related disruption, as demonstrated during Hurricane seasons when multiple facilities shut down simultaneously.
West Coast refining faces particular pressure from environmental regulations and aging infrastructure. California's remaining capacity of 1.77 million barrels per day operates under strict environmental constraints that exceed national standards, limiting operational flexibility and increasing compliance costs.
What Are the Economic Implications of Refining Bottlenecks?
The economic impact of the oil refining bottleneck extends far beyond petroleum product pricing, affecting inflation expectations, transportation costs, and industrial competitiveness. Refining constraints create pricing volatility that disrupts economic planning and forces structural adjustments across multiple sectors. Furthermore, recent oil price rally analysis demonstrates how these bottlenecks contribute to broader market dynamics.
Margin Structure Analysis
Crack spreads, representing the differential between crude oil prices and refined product prices, have expanded significantly during the current refining bottleneck. Historical crack spreads averaged $15-20 per barrel for gasoline and $12-18 per barrel for distillate fuels. Current observations show spreads frequently exceeding $30-35 per barrel for gasoline and $25-30 per barrel for distillates.
| Product | Historical Crack Spread | Current Range | Peak Observations |
|---|---|---|---|
| Gasoline | $15-20/bbl | $25-35/bbl | $45-50/bbl |
| Distillates | $12-18/bbl | $20-30/bbl | $40-45/bbl |
| Jet Fuel | $10-15/bbl | $18-25/bbl | $35-40/bbl |
Regional pricing differentials have widened dramatically as transportation constraints prevent efficient arbitrage between markets. West Coast gasoline has traded at premiums exceeding $20-30 per barrel above Gulf Coast pricing during supply disruptions, compared to historical differentials of $5-10 per barrel.
Investment Flow Redirection
Global refining investment has shifted dramatically toward Asian facilities, with approximately 60-70% of new capacity additions concentrated in China, India, and Southeast Asia. Total annual refining investment has declined from peak levels of $45-50 billion during 2012-2014 to approximately $18-22 billion in 2024-2025.
Investment Allocation by Region (2024-2026):
• Asia: $12-14 billion annually (65-70% of global investment)
• Middle East: $3-4 billion annually (15-20% of global investment)
• North America: $2-3 billion annually (10-15% of global investment)
• Europe: $1-2 billion annually (5-10% of global investment)
Maintenance deferral creates additional economic pressure as aging facilities require increasing capital investment to maintain operational reliability. Deferred maintenance costs compound over time, often requiring 2-3x the investment to address accumulated reliability issues compared to preventive maintenance programmes.
How Do Energy Security Concerns Shape Refining Strategy?
Strategic petroleum reserve management and energy security considerations increasingly influence refining capacity planning. The oil refining bottleneck intersects with national security priorities as governments recognise refining infrastructure as critical to economic resilience.
Strategic Petroleum Reserve Implications
The U.S. Strategic Petroleum Reserve remains partially depleted following releases during 2021-2022, currently holding approximately 370-380 million barrels compared to historical levels exceeding 700 million barrels. This depletion reduces emergency response capability during refining disruptions, as emergency reserves consist of crude oil requiring processing rather than finished products available for immediate distribution.
Emergency response protocols typically assume 2-3 million barrels per day of surge refining capacity during crisis scenarios. However, current global utilisation rates suggest limited surge capability, with most facilities operating near sustainable maximum levels. This constraint means emergency crude releases may not translate effectively to increased product availability without corresponding refining capacity.
Critical Infrastructure Protection Measures
Refining facilities face increasing cybersecurity and physical security threats as critical infrastructure targets. The complexity of modern refining operations creates multiple vulnerability points:
- Distributed control systems managing refining processes
- Pipeline connections linking facilities to crude supplies and product distribution
- Electrical grid dependencies for processing power requirements
- Transportation networks for crude delivery and product shipment
- Communications systems coordinating operations and emergency response
- Personnel security protecting specialised technical knowledge
International coordination mechanisms include information sharing protocols between major consuming countries and emergency response coordination through the International Energy Agency. However, these mechanisms focus primarily on crude oil supply disruption rather than refining capacity constraints, highlighting a strategic planning gap in current energy security frameworks.
What Solutions Can Address Refining Bottlenecks?
Addressing the oil refining bottleneck requires both immediate operational optimisation and long-term infrastructure development. Solutions must account for technical constraints, capital requirements, and regulatory frameworks while maintaining environmental compliance standards. Additionally, understanding oil price crash dynamics helps inform strategic planning approaches.
Short-Term Capacity Optimisation
Maintenance scheduling coordination across global refining could potentially free 2-3 million barrels per day of additional capacity during critical periods. Currently, maintenance scheduling follows facility-specific requirements without significant international coordination, creating unnecessary capacity reductions when multiple facilities undergo simultaneous maintenance.
Rapid Response Protocols:
• Emergency maintenance deferral: Temporarily extending operation cycles during crisis periods
• Product specification flexibility: Allowing temporary relaxation of premium fuel standards
• Strategic inventory releases: Coordinating government and commercial inventory drawdowns
• Import surge capacity: Expediting permitting and logistics for emergency product imports
• Inter-regional product transfers: Optimising transportation networks for supply balancing
Emergency response capability analysis suggests 2-3 million barrels per day of potential surge capacity through operational optimisation, maintenance deferral, and product specification flexibility. However, these measures create long-term risks through deferred maintenance, environmental impact, and equipment reliability concerns.
Long-Term Infrastructure Development
Modular refining technology offers potential solutions for rapid capacity additions without the 3-5 year development timelines required for conventional refining facilities. These modular systems can add 50,000-100,000 barrels per day of capacity with 12-18 month construction schedules.
| Technology Type | Capacity Range | Development Timeline | Capital Cost | Operational Flexibility |
|---|---|---|---|---|
| Conventional Refinery | 150,000-500,000 bpd | 3-5 years | $3-8 billion | Low |
| Modular Systems | 50,000-150,000 bpd | 12-18 months | $1-2 billion | Medium |
| Mobile Processing | 10,000-50,000 bpd | 6-12 months | $200-500 million | High |
Regional capacity rebalancing strategies must account for crude access, product demand patterns, and transportation infrastructure. Projected capacity additions through 2028 include 2.2-2.8 million barrels per day of new capacity globally, with 70-80% concentrated in Asia-Pacific and Middle East regions.
Future Outlook for Global Refining Capacity
The oil refining bottleneck appears likely to persist through 2026-2027 based on current capacity addition timelines and demand growth projections. Understanding future supply-demand balance requires analysing confirmed project developments, technological advancement integration, and evolving consumption patterns.
2026-2028 Capacity Addition Pipeline
Confirmed refining projects under construction include major facilities in Kuwait, India, Nigeria, and Mexico, collectively adding approximately 1.8-2.2 million barrels per day of new capacity. However, these additions must offset facility closures in mature markets and natural decline rates from aging infrastructure.
| Project | Location | Capacity | Completion Date | Status |
|---|---|---|---|---|
| Al-Zour Refinery | Kuwait | 615,000 bpd | 2025-2026 | Testing/Commissioning |
| Ratnagiri Refinery | India | 1,200,000 bpd | 2027-2028 | Under Construction |
| Dangote Refinery | Nigeria | 650,000 bpd | Operational | Ramping Up |
| Olmeca Refinery | Mexico | 340,000 bpd | 2026-2027 | Under Construction |
Technology advancement integration includes digital optimisation systems, advanced process control, and energy efficiency improvements. Modern refining technology can increase effective capacity by 5-8% through optimisation without physical expansion, though implementation requires significant capital investment and operational disruption.
Demand Evolution Scenarios
Transportation fuel demand projections suggest continued growth through 2027, despite increasing electric vehicle adoption in developed markets. Aviation fuel demand recovery and petrochemical feedstock requirements drive overall demand growth of approximately 620,000 barrels per day annually.
Demand Growth Drivers:
• Aviation recovery: Post-pandemic travel normalisation adding 200,000-300,000 bpd annually
• Petrochemical expansion: Asian capacity additions requiring 250,000-350,000 bpd of feedstock
• Marine fuel demand: Shipping industry growth adding 100,000-150,000 bpd annually
• Industrial fuel requirements: Manufacturing expansion in developing markets
Projected demand growth of 620,000 barrels per day annually through 2027 will continue pressuring global refining capacity, particularly in Asia-Pacific markets where economic expansion drives petroleum consumption.
The structural nature of the oil refining bottleneck suggests that capacity constraints may persist until significant new processing capability becomes operational in 2027-2028. Market participants should expect continued volatility in petroleum product pricing, particularly for complex products including premium gasoline, distillates, and marine fuels.
Alternative fuel development may gradually reduce pressure on refining capacity, though the timeline for meaningful impact extends beyond 2030 in most scenarios. Electric vehicle adoption affects gasoline demand primarily in developed markets, while developing economies continue expanding petroleum consumption for transportation and industrial applications.
Furthermore, research indicates concerns about whether Australia could run out of petrol, highlighting the importance of understanding these multifaceted refining constraints for navigating energy markets during this period of structural supply-demand imbalance. The combination of aging infrastructure, geopolitical disruption, and steady demand growth creates a challenging operating environment for global petroleum systems, with implications extending across economic sectors dependent on reliable fuel supplies.
Ready to Navigate Energy Market Volatility?
The global oil refining bottleneck creates significant investment opportunities across energy sectors, from traditional petroleum companies to alternative energy solutions. Discovery Alert's proprietary Discovery IQ model delivers real-time alerts on significant ASX mineral discoveries, including critical metals essential for energy infrastructure and alternative fuel technologies, empowering subscribers to identify actionable opportunities ahead of the broader market. Begin your 14-day free trial today to position yourself strategically during this period of structural energy market transformation.