
July 22, 2026
The Portfolio Construction Problem Most Investors Haven't Solved Yet
Forty years of relatively stable monetary conditions trained investors to think about portfolio construction in a specific way. Equities provided growth. Bonds provided ballast. The relationship between the two was predictable enough that a simple percentage split could carry most investors through most market environments without serious structural damage.
That relationship broke down decisively in 2022, and the conditions that replaced it have not reversed. Understanding why the old framework stopped working is the starting point for understanding why a gold allocation calculator produces a more defensible portfolio than any static percentage rule.
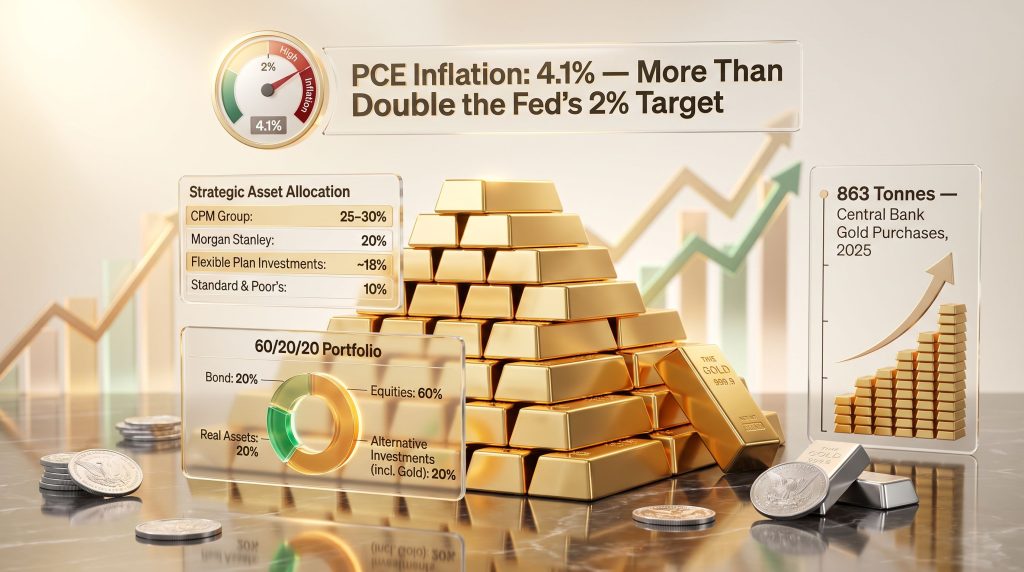
The fiscal backdrop matters here. U.S. national debt has surpassed $39.4 trillion, with annual interest servicing costs now exceeding $1 trillion per year (U.S. Treasury Fiscal Data, July 2026). The May 2026 PCE inflation reading registered 4.1% year-over-year against a Federal Reserve funds rate sitting at 3.50–3.75% (U.S. Bureau of Economic Analysis, May 2026). When the rate at which you borrow money is structurally below the rate at which prices rise, a silent erosion of purchasing power is already underway. That is the operating environment for which a personal gold allocation framework is designed.
When big ASX news breaks, our subscribers know first
Why the 60/40 Portfolio Lost Its Structural Foundation
The Correlation Breakdown That Changed Everything
The classic 60/40 portfolio worked because stock-bond correlation was reliably negative for most of the period between 1982 and 2021. When equities sold off, capital rotated into bonds, which rose in price. The result was a built-in shock absorber that reduced portfolio volatility without requiring the investor to actively manage risk.
The unwinding of that correlation began when central banks faced an inflation problem they could not solve through communication alone. Rate increases repriced both asset classes downward simultaneously. Equity valuations compressed as discount rates rose. Bond prices fell directly in response to rising yields. The buffer disappeared precisely when investors needed it most.
Furthermore, what replaced it is a higher-inflation, higher-debt environment where the two assets that once offset each other are now exposed to the same underlying risk: the erosion of the real value of paper-denominated assets through sustained above-target inflation. Understanding gold-bond dynamics in this context helps clarify why traditional portfolio structures require rethinking.
The Outdated Benchmark That Still Dominates Retail Advice
The conventional 5–10% gold allocation guidance has a specific origin: research conducted in the early 1980s, calibrated to a monetary regime that operated under the shadow of the recently abandoned Bretton Woods system and featured structurally different debt-to-GDP ratios, inflation trajectories, and central bank behaviour.
Updated research from multiple independent institutions now places the evidence-based optimal range significantly higher:
- The original 5–10% guidance reflects a period when sovereign debt levels were a fraction of their current scale and inflation was being actively suppressed, not merely targeted
- Updated methodologies from the World Gold Council, CPM Group, and Flexible Plan Investments consistently push the optimal range beyond the 1980s benchmark
- The gap between where most retail investors currently hold gold, often below 5%, and where the research suggests they should be, represents a measurable structural under-hedge
What a Gold Allocation Calculator Actually Does
From Static Guideline to Dynamic Personal Framework
A gold allocation calculator is a structured, multi-variable framework that determines what percentage of an investor's total portfolio should be held in physical gold and silver. Unlike a fixed percentage recommendation, it produces a figure calibrated to an individual's paper-asset exposure, financial vulnerability, and investment time horizon rather than applying a one-size-fits-all guideline.
The critical distinction is that the output is personal, not universal. A retiree with 80% of their wealth in fixed-income instruments and a five-year spending horizon faces a categorically different risk equation than a 35-year-old building primary wealth through employment income with a 25-year investment runway. Applying the same percentage to both produces a structurally incorrect answer for at least one of them, and likely both.
What Major Institutions Are Recommending in 2026
Institutional consensus has shifted materially. The following table captures where major research bodies currently stand:
| Institution / Research Body | Recommended Gold Allocation | Basis |
|---|---|---|
| World Gold Council | 5% minimum; 10% balanced diversifier | Sharpe ratio improvement; drawdown reduction |
| Flexible Plan Investments (Oct 2025) | ~18% | 45-year backtested risk-adjusted return optimisation |
| CPM Group | 25–30% | Current monetary and fiscal dynamics |
| Ray Dalio / Bridgewater | 5–15% | Gold outperforms when all other assets underperform |
| Morgan Stanley / IGWT 2026 | 20% | Revised 60/20/20 portfolio model replacing bonds |
(Sources: World Gold Council Portfolio Research; Flexible Plan Investments via Proactive Advisor Magazine, October 2025; CPM Group; In Gold We Trust Report 2026; Advisor Perspectives, November 2025)
Morgan Stanley's Chief Investment Office publicly endorsed a 20% gold allocation within a restructured 60/20/20 framework, replacing bonds as the traditional risk offset. The In Gold We Trust 2026 report published by Incrementum AG arrived at the same 20% anchor independently, characterising the 60/40 structure as no longer fit for purpose. These positions now represent a convergence of mainstream institutional thinking rather than fringe analysis.
How to Calculate Your Personal Gold Allocation: A Step-by-Step Method
Step 1: Quantify Your Total Paper-Asset Exposure
The starting point is a complete accounting of every asset whose value depends on a counterparty's ability to perform. This includes equities, bonds, ETFs, mutual funds, and bank deposits. Every item on that list carries embedded counterparty risk that physical gold does not.
Formula:
Paper Exposure = Equities + Bonds + ETFs + Mutual Funds + Cash Deposits
This figure becomes the denominator against which your hard-asset position is measured. Most investors, when they complete this exercise for the first time, discover their paper exposure is substantially higher than they had intuitively assumed. Tools such as an asset allocation calculator can help streamline this initial assessment.
Step 2: Score Your Financial Vulnerability Profile
Rate your overall financial situation on a 1–10 scale using the following criteria:
| Score Range | Investor Profile |
|---|---|
| 7–10 (High Vulnerability) | Near or in retirement; heavy fixed-income reliance; limited capacity to endure a multi-year drawdown |
| 4–6 (Moderate Vulnerability) | Mid-career; 10–20 year horizon; mixed portfolio; moderate flexibility |
| 1–3 (Low Vulnerability) | 20+ year runway; primary wealth-building via employment income; high equity tolerance |
Step 3: Map Your Score to a Starting Allocation Range
| Vulnerability Score | Indicative Starting Allocation |
|---|---|
| 1–3 (Low) | 7–12% of total investable assets |
| 4–6 (Moderate) | 12–18% of total investable assets |
| 7–10 (High) | 18–25% of total investable assets |
Important: These ranges represent starting positions, not ceilings. Investors whose current gold holdings fall materially below their calculated range are structurally under-hedged against the macroeconomic scenarios outlined below.
Step 4: Stress-Test Against Three Macro Scenarios
Sizing a gold position for a single expected outcome guarantees it will underperform or over-constrain in every other environment. The three scenarios below each require different allocation thinking.
The Three Economic Scenarios That Shape Allocation Sizing
Scenario A: Persistent Stagflation
Stagflation combines suppressed economic growth with above-target inflation, creating simultaneous headwinds for equities through margin compression and for bonds through negative real yields. In this environment, the opportunity cost of holding gold approaches zero. Real yields stay suppressed, and the inflation component continuously erodes the purchasing power of cash and fixed-income instruments while paper equity valuations face downward pressure.
The current U.S. environment, with PCE running at 4.1% against a Fed funds rate of 3.50–3.75%, already represents mild financial repression. If sustained without resolution, it structurally supports gold as a strategic investment without requiring any crisis event to trigger the thesis.
Scenario B: Deflationary Liquidity Shock
In a sharp liquidity contraction, investors sell across all asset classes simultaneously to cover margin calls or raise cash. Gold typically declines in the initial phase of such events. What follows, however, is historically consistent: central banks respond with monetary expansion, real yields collapse, and gold not only recovers but typically exceeds its pre-correction levels.
The allocation implication is critical and often missed: position sizing must account for the path, not just the destination. A temporary 15–20% price decline in gold should not force a sale that permanently undermines the long-term thesis. Investors who are undersized relative to their calculated framework often discover this the hard way during the liquidation phase.
Scenario C: Structural Currency Realignment
A formal or informal restructuring of the U.S. dollar's reserve currency role represents the scenario where the difference between a 10% and a 20% gold allocation is most consequential. The institutional behaviour already underway is instructive: central banks globally purchased 863 tonnes of gold in 2025, the fourth-highest annual total on record (World Gold Council). The People's Bank of China extended its gold purchasing streak to 20 consecutive months through June 2026, continuing to accumulate during a period of significant price correction.
When institutions accumulate systematically during price weakness rather than chasing strength, they are expressing a conviction about long-term monetary architecture. That is a long-duration structural position, not tactical trading. Individual investors who align their allocation logic with this institutional behaviour are positioned more durably than those responding to price momentum alone.
How Silver Changes the Allocation Equation
Gold vs. Silver: Two Instruments, One Monetary Thesis
Silver is not simply a cheaper version of gold. It is a structurally different instrument that shares gold's monetary properties while carrying a second engine that gold does not: industrial demand. Approximately 58% of annual silver demand originates from industrial applications including solar energy, semiconductors, and medical technology (Silver Institute, World Silver Survey 2026). This dual-engine structure makes silver more sensitive to economic growth expectations and more volatile across short time horizons.
When the Federal Reserve tightens policy, silver absorbs a compounded impact: higher opportunity cost from rising real yields, identical to gold, plus suppressed industrial demand expectations that are unique to silver. This mechanism explains why the gold-to-silver ratio has expanded to approximately 69:1 in mid-2026, above its 50-year historical average of roughly 65:1 (goldsilver.com/price-charts). In addition, gold-silver ratio analysis provides further context on what these historical divergences have historically signalled for forward returns.
What the Gold-to-Silver Ratio Signals for Allocation
An elevated ratio indicates silver is historically undervalued relative to gold at current prices. For investors with longer time horizons and higher volatility tolerance, this creates an asymmetric setup: if the ratio reverts toward its historical average, silver outperforms gold in percentage terms during that reversion.
Practical precious metals split by time horizon:
| Investment Horizon | Recommended Gold Weighting | Recommended Silver Weighting |
|---|---|---|
| Under 3 years (Short) | 80–90% of precious metals allocation | 10–20% |
| 3–10 years (Medium) | 60–70% | 30–40% |
| 10+ years (Long) | 50–60% | 40–50% |
The Silver Supply Deficit: A Structural Imbalance Worth Understanding
The Silver Institute confirmed a fifth consecutive annual supply deficit through 2025, with 2026 projected to extend the streak to six consecutive years (Silver Institute, World Silver Survey 2026). Ongoing silver supply deficits of this nature and price can diverge for extended periods due to above-ground inventory drawdowns and demand-side fluctuations. However, structural imbalances between production and consumption have a historical tendency to resolve through price adjustment over time. Investors with multi-year time horizons who can absorb short-term volatility are positioned to benefit from this dynamic if and when that resolution occurs.
The next major ASX story will hit our subscribers first
The Three Most Common Gold Allocation Mistakes
Mistake 1: Treating Paper Gold Exposure as Equivalent to Physical Ownership
Gold ETFs provide price exposure to gold. They do not provide physical possession, and they do not eliminate counterparty risk. Physical gold held in an allocated account registered in your name, or stored directly in your possession, carries zero counterparty risk. The distinction between paper and physical gold matters most in the precise scenario gold is designed to hedge against: systemic financial stress, where counterparty chains are exactly the structures most likely to be tested. Consequently, understanding physical gold vs ETFs is essential before committing to an implementation structure.
Mistake 2: Anchoring to the 5% Floor as Though It Were a Target
Running both sides of the allocation math is essential before defaulting to the minimum:
| Portfolio Size | Gold Allocation | Gold Drawdown (50%) | Portfolio Impact |
|---|---|---|---|
| $500,000 | 5% ($25,000) | -$12,500 | -2.5% of total portfolio |
| $500,000 | 15% ($75,000) | -$37,500 | -7.5% of total portfolio |
A 50% gold drawdown of this magnitude would be historically rare for physical metal. More importantly, the gold position is designed to offset simultaneous losses occurring elsewhere in the portfolio during a stress event. The net portfolio effect of a larger gold allocation during a genuine crisis is typically stabilising rather than damaging. Running both sides of that calculation before anchoring at the floor produces a more defensible allocation decision.
Mistake 3: Concentrating Purchases at Emotional Market Peaks
Large lump-sum purchases triggered by fear-driven headlines are one of the most common and avoidable mistakes in precious metals investing. Dollar-cost averaging, purchasing a fixed dollar amount at regular intervals regardless of price, removes both the timing variable and the emotional variable from the equation. A gold SIP calculator can help model the long-term outcomes of a systematic acquisition strategy. Executed consistently over 12–24 months and anchored to the allocation framework above, this approach is structurally more durable than a reactive purchase made at a moment of maximum sentiment.
Allocated vs. Unallocated Storage: A Distinction That Matters
Once an allocation target is established, the implementation step requires understanding two fundamentally different storage structures:
- Allocated storage: Specific physical gold bars or coins are registered in your name. You own identifiable, numbered metal. The custodian holds it on your behalf but cannot lend it, lease it, or use it as collateral. Your claim is to specific metal, not to a pool.
- Unallocated storage: You hold a claim against a general pool of metal maintained by a custodian. The specific metal is not identified as yours. In a custodian insolvency event, unallocated holders become unsecured creditors of that pool rather than owners of specific property.
For investors whose primary rationale for holding gold is protection against systemic financial stress, allocated storage is the structure that fully delivers on the investment thesis. The additional cost of allocated storage is the price of removing custodian dependency from the equation.
Where Gold Trades in Mid-2026 and Why the Entry Framework Still Applies
Gold traded near $4,143 per ounce in mid-July 2026, approximately 26% below its January 2026 intraday high of $5,589.38 (goldsilver.com/price-charts). Institutional price targets for the remainder of 2026 cluster at the higher end of the current range:
- JPMorgan: Q4 2026 target of $4,500 (JPMorgan Global Research, July 2026)
- Goldman Sachs: Year-end 2026 target of $4,900 (Goldman Sachs)
The gold allocation calculator framework described above is not a market-timing instrument. Its inputs are structural and measurable: $39.4 trillion in national debt, PCE inflation running at more than double the Fed's stated 2% target, 863 tonnes of central bank gold purchases in 2025, and real after-tax returns on fixed income that remain negligible once inflation is factored in. These conditions are present and quantifiable. They form the rational basis for the calculation regardless of whether gold is 26% below its peak or testing new highs.
Frequently Asked Questions: Gold Allocation Calculator
What is the recommended gold allocation for retirement portfolios?
Research from Flexible Plan Investments, based on a 45-year backtested study updated in October 2025, identifies approximately 18% as the allocation that optimises risk-adjusted returns over long measurement periods. Investors within a decade of retirement generally benefit from positioning toward the higher end of the 15–25% range, as gold's historically negative correlation to equities provides meaningful protection during the bear markets that are most damaging when they coincide with the early years of portfolio withdrawals.
Does adding silver improve or complicate portfolio outcomes?
Silver introduces a higher-volatility, higher-upside position that shares gold's monetary thesis while adding an industrial demand component. For long-term investors who can tolerate short-term price swings, the combination of a structurally elevated gold-to-silver ratio of approximately 69:1 against a 65:1 historical average, alongside six consecutive years of projected supply deficits, suggests silver offers asymmetric return potential relative to gold at current relative prices. For investors with shorter horizons or lower volatility tolerance, anchoring the precious metals allocation predominantly in gold is the more appropriate structure.
How frequently should a gold allocation be rebalanced?
Annual rebalancing to a target range rather than a fixed percentage is a practical standard for most investors. If gold appreciates significantly and the allocation exceeds the target range by more than 5 percentage points, trimming to target locks in gains while preserving the intended portfolio structure. If a price correction brings gold below the target range, that represents a systematic buying opportunity consistent with a dollar-cost averaging discipline.
Should I hold physical gold or a gold ETF?
For the purpose of hedging against systemic financial risk and preserving purchasing power, physical gold held in an allocated account in your name is the instrument that fully delivers on the investment rationale. Gold ETFs carry custodian and counterparty risk that is most likely to be tested in the exact market conditions gold is intended to protect against.
Disclaimer: This article is for informational and educational purposes only and does not constitute financial or investment advice. All investments, including precious metals, involve risk and may result in partial or total loss. Past performance is not a guarantee of future results. Always consult a qualified financial adviser before making investment decisions.
Want to Know When the Next Major Mineral Discovery Hits the ASX?
Discovery Alert's proprietary Discovery IQ model delivers real-time alerts the moment significant mineral discoveries are announced on the ASX, turning complex data across 30+ commodities into clear, actionable opportunities — explore the historic returns major discoveries have generated and begin your 14-day free trial at Discovery Alert to position yourself ahead of the broader market.