June 29, 2026
The Hidden Mechanics Behind a Historic Precious Metals Collapse
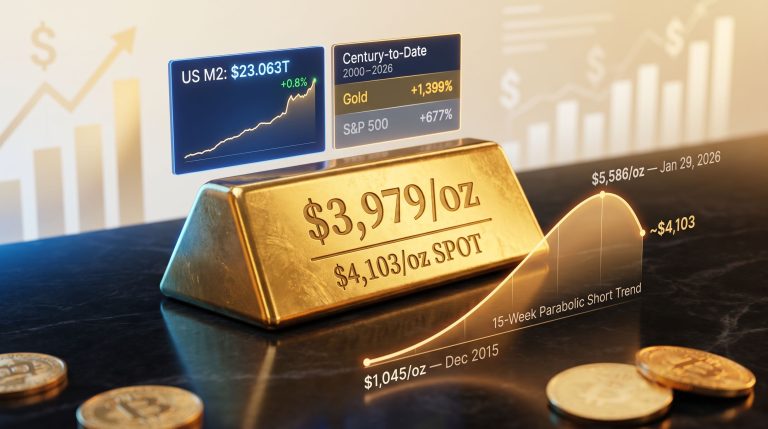
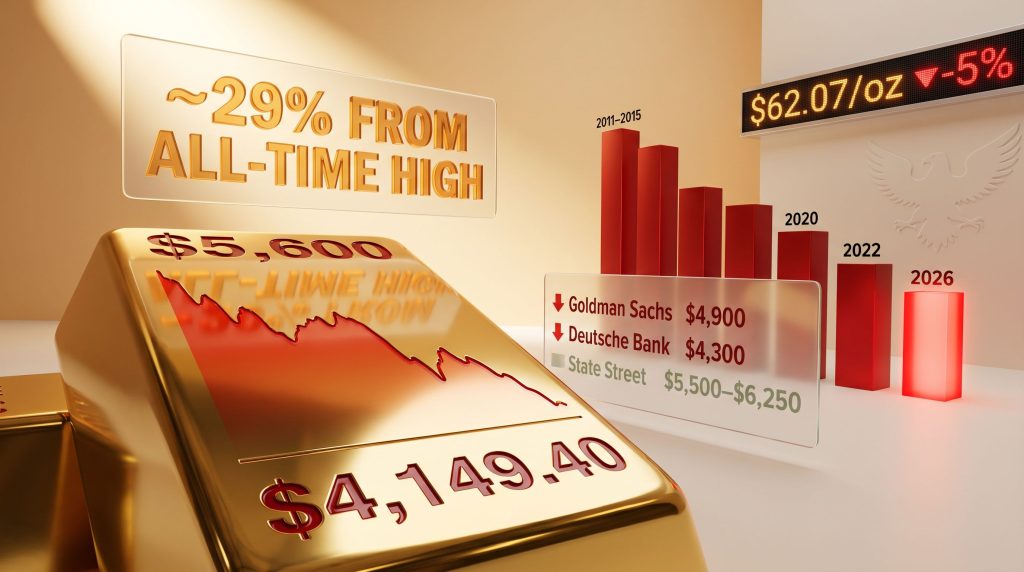
Few financial phenomena reveal more about investor psychology than the speed at which a consensus trade unravels. For most of 2023, 2024, and 2025, gold was the undisputed champion of institutional portfolios, government reserve strategies, and retail investor watchlists. The metal more than doubled in price across that three-year window, reaching an all-time high of approximately $5,600 per ounce in late January 2026. By mid-2026, that same asset had entered confirmed bear market territory, shedding roughly 29% of its peak value and settling near $4,149.40 per ounce.
Understanding why this happened requires looking beyond the headlines and into the structural mechanics of how gold is priced, who holds it, and what forces determine whether capital flows toward or away from bullion. The gold bear market on rate fears is not simply a story about one metal falling in price. It is a case study in how rapidly the foundations beneath a multi-year bull market can dissolve when monetary policy shifts direction.
When big ASX news breaks, our subscribers know first
The Opportunity Cost Equation: Why Gold and Interest Rates Are Natural Enemies
Gold's most fundamental characteristic from an investment standpoint is also its most significant vulnerability: it generates no income. Unlike government bonds, corporate debt, dividend-paying equities, or cash held in interest-bearing accounts, gold sits inert in a vault and produces nothing. Its investment case rests entirely on price appreciation and its role as a store of value. Understanding gold and bonds dynamics helps explain why these assets frequently move in opposite directions during monetary policy shifts.
This creates a direct mathematical relationship with interest rates. When rates are low or falling, the cost of forgoing yield to hold gold is minimal. When rates rise, however, every basis point increase represents an expanding opportunity cost for gold holders. The relevant metric here is not the nominal rate but the real interest rate, calculated by subtracting inflation from the nominal yield.
When real rates move deeply into positive territory, gold faces its most difficult operating environment. Capital that might otherwise sit in bullion migrates toward instruments that now offer meaningful inflation-adjusted returns. This is precisely the dynamic at work in 2026, where the convergence of rising nominal rates and moderating inflation has pushed real yields higher, directly pressuring gold prices.
Ewa Manthey, commodities strategist at ING, has stated that the primary driver behind gold's recent decline has been a significant repricing of interest-rate expectations, a view now broadly shared across major institutional research desks.
Kevin Warsh, Fed Credibility, and the Debasement Trade Unwind
The appointment of Kevin Warsh as Federal Reserve Chair introduced a policy personality markedly different from his recent predecessors. Warsh has historically advocated for a more disciplined, rules-based approach to monetary policy, placing a high premium on central bank credibility and pre-emptive inflation control. His communications at the first rate-setting meeting under his leadership sent an unambiguous signal to markets: the Fed would not tolerate above-target inflation.
The market response was swift. Rate expectations were repriced upward across multiple quarters, and an investment strategy known as the debasement trade began to unwind at speed.
The debasement trade is a positioning framework built on a specific thesis: that governments and central banks, by running persistent fiscal deficits and expanding money supply, are gradually eroding the real value of fiat currencies. Under this logic, assets with fixed or scarce supply, principally gold and Bitcoin, offer protection against currency debasement. The trade attracted enormous institutional and retail capital between 2022 and early 2026.
Goldman Sachs analysts observed that Warsh's credibility-focused messaging helped reassure markets about the independence and discipline of the Federal Reserve, effectively pulling the foundation from beneath the debasement trade. When the central bank signals convincingly that it will defend the purchasing power of the currency, the core rationale for holding debasement hedges weakens materially.
This dynamic explains something that puzzles many retail investors: why gold fell so sharply even as geopolitical tensions remained elevated. Gold's safe-haven role, rather than supporting prices through traditional demand, was effectively overridden by the U.S.-Iran conflict driving energy prices higher, feeding inflationary data, and hardening the Fed's resolve to maintain restrictive monetary policy.
Institutional Forecast Revisions: What the Banks Are Saying
The repricing across major bank research departments has been significant, with several institutions making material downward revisions to their gold price targets. According to analysis from AFR strategists, a deeper pullback remains a real possibility if rate expectations continue to be revised higher.
| Institution | Previous Target | Revised Target | Bear Case Scenario |
|---|---|---|---|
| Goldman Sachs | $5,400 (year-end) | $4,900 (year-end) | Further downside if hikes accelerate |
| Deutsche Bank | ~$5,175 (Q4) | $4,300 (Q3) | $3,800 if 3-4 rate hikes materialise |
| Bank of America | $6,000 | No longer base case | Requires Fed pivot to revisit |
| State Street | N/A | $5,500-$6,250 | Contingent on demand recovery |
Goldman Sachs reduced its year-end target by $500, landing at $4,900 per ounce. Deutsche Bank trimmed its fourth-quarter estimate by approximately 17%, with a bear case of $3,800 per ounce if the Federal Reserve delivers three to four rate hikes within the cycle. Bank of America, which had previously set an ambitious $6,000 target, has effectively shelved that forecast as incompatible with current monetary conditions. State Street remains the outlier among major institutions, projecting a potential recovery into the $5,500 to $6,250 range, though this scenario is conditional on meaningful demand-side stabilisation.
Silver Caught in the Crossfire
Gold's decline has not occurred in isolation. Silver, which trades with a dual identity as both a precious metal and an industrial commodity, has also retreated sharply. Silver declined more than 5% to approximately $62.07 per ounce, reflecting the broader precious metals selloff. Furthermore, gold-silver ratio insights suggest the relationship between these two metals has become increasingly volatile during the current correction. Silver's industrial demand component, which includes applications in solar panels, electronics, and electrical systems, provides some insulation from pure monetary headwinds, but not enough to offset the scale of the gold-led correction.
Technical Analysis: How Far Can This Bear Market Run?
From a technical perspective, the current gold bear market on rate fears has characteristics that suggest the selling pressure may not yet be exhausted. Weekly stochastic oscillators, which measure price momentum relative to recent trading ranges to identify overbought and oversold conditions, have not yet reached levels that technical analysts associate with a durable floor.
Key observations from the technical landscape include:
- The $3,974 per ounce level represents the most closely monitored support zone, where significant buying interest may emerge
- Momentum indicators continuing to trend downward suggest the path of least resistance remains lower in the near term
- The speed of the decline from the January peak has been faster than any comparable gold bear market in recent history, increasing the risk of overshoot in either direction
- Volume patterns during the selloff indicate institutional liquidation rather than retail panic selling, suggesting a more orderly but potentially sustained correction
The Structural Demand Picture: What Remains Intact
Despite the severity of the price correction, not all demand pillars have crumbled equally. Understanding which supports have broken and which remain intact is essential for assessing where gold prices may find a genuine floor.
Central Bank Accumulation: The Durable Demand Floor
Sovereign institutions have continued adding gold to national reserves throughout the 2026 downturn. Central bank gold reserves accelerated to their fastest quarterly pace in over a year during Q1 2026, and forward-looking survey data from monetary authorities indicates that further reserve accumulation is anticipated.
Deutsche Bank's research team has noted that central bank gold demand remains the single strongest pillar supporting gold, and that this institutional appetite is expected to persist for an extended period. This is not discretionary investing driven by price momentum but strategic reserve management driven by geopolitical diversification motives, particularly the desire among non-Western central banks to reduce exposure to U.S. dollar-denominated assets.
ETF Outflows and Chinese Demand: Two Pillars That Have Fractured
The two demand drivers that contributed most to gold's 2023-2025 bull market have both reversed direction:
- Exchange-traded fund outflows: During the bull market, Western institutional investors channelled substantial capital into gold ETFs, creating consistent buying pressure. That flow has now reversed, with net outflows removing a historically significant source of price support.
- Chinese import weakness: Chinese retail demand and physical import volumes, which traditionally provide a counter-seasonal support mechanism for gold prices, have softened materially. Weaker domestic economic sentiment and currency considerations have reduced Chinese consumer appetite for gold at current price levels.
Together, these two reversals have amplified the downward pressure created by the rate environment, accelerating the decline beyond what rate movements alone might have produced.
The next major ASX story will hit our subscribers first
Comparing 2026 to Historical Gold Bear Markets
Placing the current correction in historical context reveals both the severity and the potential recovery trajectory.
| Bear Market Period | Peak Price | Trough Price | Approximate Decline | Primary Driver |
|---|---|---|---|---|
| 2011-2015 | ~$1,920/oz | ~$1,050/oz | ~45% | Fed tapering, USD strength |
| 2020 (brief) | ~$2,075/oz | ~$1,670/oz | ~19% | COVID recovery, rate expectations |
| 2022 | ~$2,050/oz | ~$1,620/oz | ~21% | Aggressive Fed rate hike cycle |
| 2026 (current) | ~$5,600/oz | ~$4,149/oz | ~29% (ongoing) | Hawkish Fed pivot, debasement trade unwind |
The 2022 precedent carries particular instructive weight. Following the aggressive Federal Reserve rate-hiking cycle of that year, gold endured a sharp correction before recovering strongly once it became clear the hiking cycle had peaked. The 2026 situation shares structural similarities: once the market develops a clearer view of where the terminal rate lands, the pressure on gold should diminish.
The critical difference in 2026 is the starting price level and the scale of the debasement trade that accumulated during the intervening bull market. Unwinding three years of leveraged positioning takes time, and the compressed speed of the current correction increases the risk of further downside before stabilisation. As CMC Markets analysts have noted, gold faces a potentially steeper decline if key technical levels fail to hold.
Scenario Analysis: What Could Reverse the Gold Bear Market on Rate Fears?
Four plausible pathways exist through which the current bear market could transition back toward bullish conditions:
- Federal Reserve pivot or pause: If inflation moderates faster than anticipated and economic data weakens, the Fed may signal a halt to rate increases. Historically, confirmed peaks in rate cycles have been among the most reliable triggers for gold price recoveries, as real yields compress and the opportunity cost of holding bullion falls.
- Geopolitical shock to dollar-asset confidence: A geopolitical event that threatens the stability of U.S. dollar-denominated assets, rather than simply raising commodity prices, could revive gold's safe-haven premium. This scenario requires a threat to the financial architecture itself rather than conventional geopolitical tension.
- Accelerated central bank reserve diversification: If BRICS-aligned economies and other non-Western sovereigns accelerate their shift away from U.S. Treasuries and into physical gold, the structural buying could overwhelm the ETF liquidation headwind. This is a longer-term dynamic but represents a meaningful floor risk for short sellers.
- Stagflationary economic conditions: Should energy-driven inflation persist while growth decelerates, the stagflationary environment that characterised the 1970s — a period during which gold performed exceptionally well despite elevated nominal rates — could return. This remains a lower-probability scenario but is not without historical precedent.
Key Metrics Investors Are Watching
For those monitoring the gold bear market on rate fears through this correction, several data points carry outsized significance:
- Real yield trajectory: The spread between 10-year Treasury yields and inflation expectations remains the most predictive single variable for gold price direction
- Federal Open Market Committee communications: Any softening in the Fed's rate guidance will be rapidly reflected in gold pricing
- Central bank purchase data: Quarterly reserve accumulation figures from the World Gold Council provide the clearest read on structural demand
- ETF flow data: A reversal from net outflows to net inflows in major gold ETFs would signal returning institutional confidence
- $3,974/oz technical support level: A sustained break below this level would likely trigger further algorithmic selling and extend the bear market
Disclaimer: This article is for informational purposes only and does not constitute financial advice. Gold prices are volatile, forecasts from financial institutions are subject to revision, and past performance is not indicative of future results. Investors should conduct their own due diligence before making investment decisions.
Want to Track the Next Major Mineral Discovery Before the Broader Market Does?
Discovery Alert's proprietary Discovery IQ model delivers real-time alerts on significant ASX mineral discoveries, transforming complex geological data into actionable investment insights for traders and long-term investors alike — explore the historic returns major discoveries have generated and begin your 14-day free trial to position yourself ahead of the market.