June 29, 2026
The Monetary Mirror: How Gold's Fair Value Signals Where the Metal Really Belongs
Across centuries of monetary history, gold has repeatedly served as the measuring stick against which all currencies are weighed. Yet in modern markets, the more pressing question is not whether gold holds value, but rather how to determine what that value actually is at any given moment. The concept of a gold return to fair value is not merely an academic exercise. It is a practical framework that has, time and again, provided investors with some of the most reliable entry points available in any asset class.
Understanding this concept requires stepping back from daily price noise and examining the structural forces that anchor gold's intrinsic worth over time. Furthermore, a solid gold price forecast for the year ahead can provide valuable context when assessing where the metal stands relative to its fundamental benchmarks.
When big ASX news breaks, our subscribers know first
Why Gold's Fair Value Is Not a Single Number
The Multi-Model Problem: Competing Valuation Frameworks Explained
Gold's fair value is among the most contested metrics in commodity analysis. Unlike equities, where earnings multiples and discounted cash flow models provide relatively standardised anchors, gold's intrinsic worth is derived from several fundamentally different frameworks, each yielding a distinct price target depending on the assumptions embedded in the model.
| Valuation Model | Methodology | Implied Fair Value (Mid-2026) |
|---|---|---|
| M2 Money Supply Model | Gold indexed to US M2 growth, adjusted for tonnage | ~$3,979/oz |
| Inflation-Adjusted (CPI) | Real gold price vs. 1980 baseline deflated by CPI | ~$1,400/oz long-run average |
| Global Money Stock Model | Gold relative to global monetary aggregates | Suggests ~30% undervaluation |
| Per Capita Income / PPP Model | Gold price vs. purchasing power parity | Suggests 22–42% overvaluation |
No single model commands universal authority. Sophisticated analysts cross-reference multiple frameworks before reaching conclusions about whether gold is overvalued or undervalued at any given moment.
How the M2 Money Supply Model Works
The M2 model anchors gold's intrinsic price to the total US money supply, adjusted for changes in estimated above-ground gold tonnage. The logic is straightforward: as the monetary base expands, the purchasing power of each unit of currency diminishes, and gold, as a finite physical asset, should command a proportionally higher nominal price.
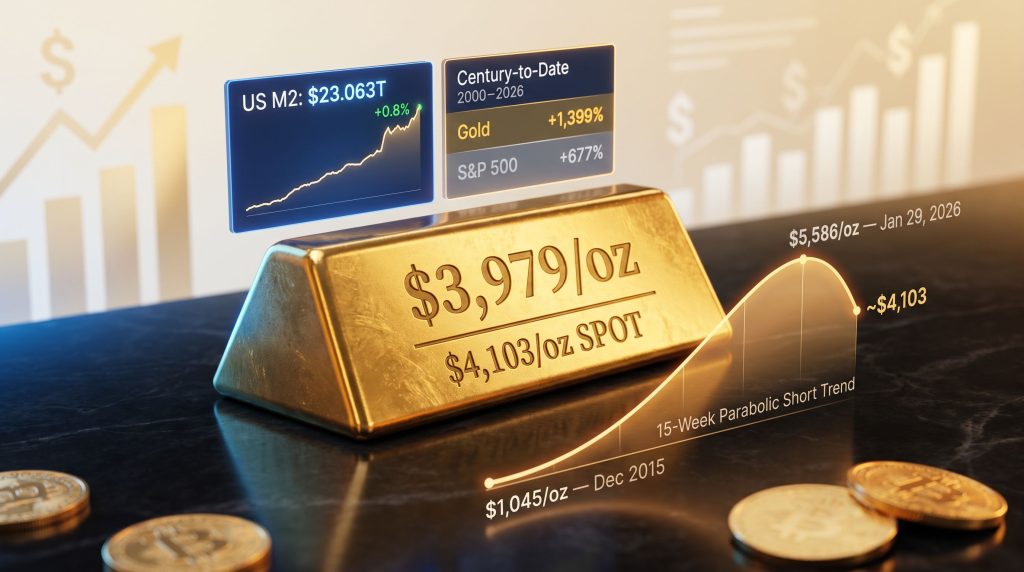
As of late June 2026, the Federal Reserve Bank of St. Louis reported that US M2 money supply had risen from $22.879 trillion to $23.063 trillion across a four-week period, a gain of approximately +0.8%. After adjusting for a concurrent +0.1% increase in estimated global above-ground gold tonnage, the M2-derived fair value for gold was recalibrated to approximately $3,979/oz.
What makes this model particularly compelling is its historical mean-reversion behaviour. Gold prices have consistently gravitated toward this level over time, regardless of interim volatility. For a deeper understanding of how this plays out alongside broader asset dynamics, the gold and bonds dynamics across economic cycles offer important context.
Why the CPI-Adjusted Model Tells a Very Different Story
Using the Consumer Price Index as a deflator from a 1980 baseline, gold's long-run real average sits near $1,400/oz. At prices above $4,000/oz in mid-2026, gold trades at more than three times this inflation-adjusted historical average.
This divergence does not automatically imply impending collapse. It instead reflects structural shifts in the monetary landscape that were largely absent in prior decades:
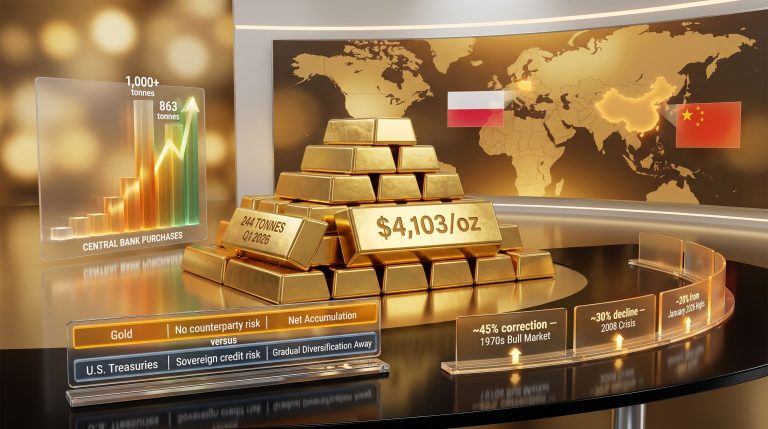
- Persistent central bank accumulation by sovereign institutions, particularly across Asia and the Middle East
- The abandonment of the Bretton Woods gold standard, which permanently altered gold's relationship with paper currencies
- A sustained era of fiscal expansion and debt monetisation that creates a structurally rising nominal price environment
- Geopolitical risk premiums that have become a more permanent feature of institutional portfolio construction
Where Gold Stood Relative to Fair Value in Late June 2026
Current Pricing vs. the M2 Benchmark
The week ending June 27, 2026 produced a revealing snapshot of gold's positioning across its key valuation benchmarks:
- Spot settlement price: approximately $4,103/oz
- M2-derived fair value: approximately $3,979/oz
- Premium above M2 fair value: approximately +3.1%
- BEGOS Market Value (multi-asset regression): approximately $4,363/oz
- Discount to BEGOS Market Value: approximately -6.0%
Gold simultaneously sat modestly above its monetary fair value while trading at a meaningful discount to its cross-asset regression value. This bifurcation places the metal in a transitional zone, neither definitively cheap nor expensive, depending entirely on which framework an investor prioritises.
The BEGOS framework, which stands for Bond, Euro, Gold, Oil, and S&P 500, uses multi-asset regression analysis to derive a market value for gold based on its historical price relationships with correlated asset classes. A -6.0% discount to BEGOS value suggests that, relative to these peers, gold was underpriced as of late June 2026.
The Significance of Gold Touching $3,979 Mid-Week
During the trading week of June 23 to 27, 2026, gold briefly touched the M2-derived fair value level of approximately $3,979/oz. What followed was instructive: buying interest emerged almost immediately at that level, consistent with a pattern that has repeated throughout the modern monetary era.
This price action validates the mean-reversion thesis. Despite a sustained multi-week downtrend, the moment gold aligned with its monetary fundamental anchor, demand materialised. Fair value, in this context, functions less like an abstract calculation and more like a structural demand floor.
How the US Money Supply Creates Gold's Long-Term Floor
The Structural Relationship Between M2 Growth and Gold Pricing
The correlation between US M2 expansion and gold's nominal price appreciation is one of the most robust long-term relationships in commodity markets. It reflects gold's foundational role as a store of value against currency debasement. In addition, central bank gold demand has emerged as a powerful structural force reinforcing this relationship.
Several data points illustrate the scale of this dynamic:
- From 1980 to the present, US M2 has expanded dramatically through multiple economic cycles
- The largest single M2 reduction on record occurred briefly over two weeks in 2023, falling from $20.765 trillion to $20.599 trillion, a contraction of less than 0.8% that resolved within weeks as the Fed Funds Rate briefly exceeded 5%
- Over the past 20 years, M2 has expanded an additional +249% beyond the prior two decades of growth
- Over the same period, the US national debt has grown by approximately +362%
These twin forces of monetary and fiscal expansion create a structurally rising floor for gold's fair value, one that almost never permanently retreats.
Why Gold's Fair Value Floor Is Effectively One-Directional
A lesser-known characteristic of the M2 model is that its directional bias is essentially asymmetric. M2 contractions are historically rare, brief, and small in magnitude. Even during aggressive Federal Reserve tightening cycles, reductions in money supply have been transient. The directional bias of M2 over any multi-year horizon is upward, and gold's fair value follows.
This creates a structural asymmetry that disciplined investors can exploit: purchasing gold at or below M2 fair value has historically resulted in positive returns over patient holding periods, regardless of near-term price volatility.
Buying gold at or near M2-derived fair value has represented one of the lowest-risk entry points for long-term capital preservation across the modern monetary era. The math is unambiguous: fair value rises over time, and gold eventually finds its way back to it.
A striking historical illustration: on December 3, 2015, gold traded at a low of $1,045/oz. The M2-derived fair value that same day was approximately $2,442/oz, meaning gold was trading at a -57% discount to fair value. Investors who recognised the signal and acted accordingly were rewarded handsomely in the years that followed. According to long-term gold performance data, these kinds of deep discounts to fundamental value have historically preceded some of gold's most significant bull runs.
The Historical Performance Case for Gold as a Long-Term Asset
Century-to-Date Returns: Gold vs. Equities
Perhaps the most compelling argument for gold as a long-term holding comes from a straightforward return comparison:
| Asset | Century-to-Date Return (2000–2026) |
|---|---|
| Gold | +1,399% |
| S&P 500 (including dividend reinvestment) | +677% |
Gold has delivered more than twice the cumulative return of the S&P 500 since the year 2000, including dividends. This performance spanned multiple economic cycles, two major financial crises, a global pandemic, and extended periods of equity market euphoria, all conditions under which gold was periodically dismissed as irrelevant.
The 2025 to 2026 Bull Market in Context
The current cycle has been exceptional by any historical measure:
- Gold delivered an annualised return of approximately 65% over the 12 months spanning 2025 to 2026
- The bull market cycle beginning around 2022 generated returns of approximately 200% from cycle lows
- The cycle high of approximately $5,586/oz was reached on January 29, 2026, at which point the M2 model indicated significant overvaluation, with fair value then sitting at approximately $3,856/oz
- The subsequent correction from $5,586 to the $4,103 range represents a normalisation process, not a structural trend reversal
- GDP-linked models project an average annual return of approximately 5.2% for gold over the 15-year horizon from 2025 to 2040
It is worth noting that the 31-week parabolic short trend recorded between November 2012 and May 2013 represented the longest downtrend of its kind for gold in the 21st century. During that period, gold was widely dismissed as an obsolete asset class, even as its M2 fair value continued rising uninterrupted. Investors who purchased equities during that same period chased retailers that subsequently went bankrupt, while gold's underlying monetary value grew steadily.
What Stress-Testing the M2 Model Reveals
The Federal Debt Monetisation Scenario
To appreciate the upper boundary of gold's fair value potential, it is worth modelling an extreme, though theoretically possible, monetary scenario.
Hypothetical scenario: full federal debt monetisation
- Current US federal debt: approximately $39 trillion
- Current M2 money supply: approximately $22 to $23 trillion
- If the Federal Reserve monetised the entire federal debt through a single accounting entry, M2 would expand approximately 2.7x, from roughly $22 trillion to approximately $61 trillion
- Applying the M2 fair value model proportionally would imply a gold fair value of approximately $10,606/oz
Important Disclaimer: This scenario is a theoretical stress-test designed to illustrate the mathematical sensitivity of gold's fair value to monetary expansion. It does not constitute a price forecast or investment recommendation.
The exercise is nonetheless instructive. It demonstrates that the M2 model is not merely a backward-looking valuation tool. It is a forward-looking sensitivity framework that reveals just how much latent monetary pressure is embedded in the relationship between government debt, money supply, and gold's intrinsic worth.
The next major ASX story will hit our subscribers first
Key Macro Risks That Could Accelerate or Delay a Gold Return to Fair Value
The Federal Reserve's Policy Dilemma
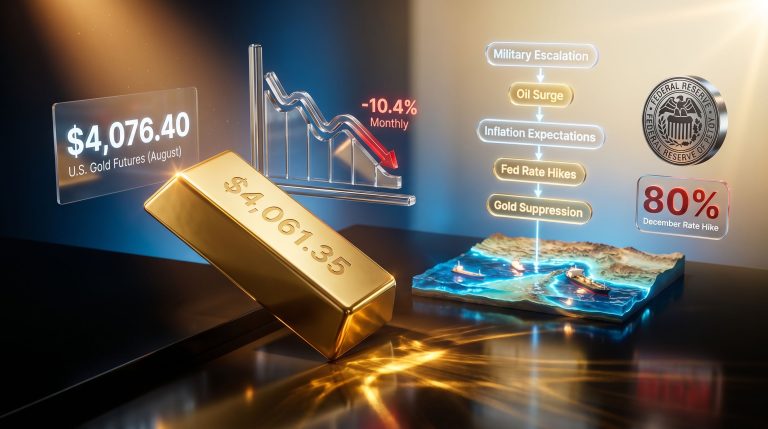
The Federal Open Market Committee faces a structurally difficult policy environment heading into its July 29, 2026 policy statement. The Federal Reserve's preferred inflation gauge, the Personal Consumption Expenditures index, showed May 2026 inflation running at two to nearly three times the Fed's stated 2% target.
This persistent overshoot creates a binary policy dilemma:
- Raise rates to combat inflation, risking economic contraction and stagflationary conditions
- Hold or cut rates, risking further inflation entrenchment and accelerated currency debasement
With 22 trading days between late June and the July 29 FOMC meeting, market participants face meaningful uncertainty. The outcome will materially influence gold's near-term trajectory relative to fair value.
Interest Rate Cycles and Gold: Challenging Conventional Wisdom
Conventional market thinking holds that rising interest rates are bearish for gold because of the increased opportunity cost of holding a non-yielding asset. Historical data, however, challenges this assumption in important ways.
During the Federal Reserve's rate-hiking cycle from 2004 through 2006, gold performed strongly. The critical variable was not the direction of rates in isolation, but the fact that gold was trading at an attractive discount to its M2 fair value at the start of that cycle. Furthermore, gold's gold safe-haven appeal tends to reassert itself precisely when conventional financial assets come under pressure, regardless of the prevailing rate environment.
GDP Revision and the Economic Barometer Signal
Q1 2026 GDP was revised upward by +0.5% to a final reading of +2.1% annualised, tying for the second-largest positive final revision to any quarterly GDP figure in approximately 29 years. For context, the historical average final GDP revision across the same period is just ±0.2%, making this revision statistically exceptional.
Personal Income and Personal Spending for May 2026 both came in above expectations. Despite these positive signals, broader macro indicators suggest the equity market remains vulnerable to a correction in the -10% range toward the 6,800 level on the S&P 500.
Technical Indicators and the Fair Value Thesis
Fifteen Weeks of Parabolic Short Trend
Gold's technical structure as of late June 2026 reflects a market in a defined correction phase. Key observations include:
- Gold had been in a weekly parabolic short trend for 15 consecutive weeks as of the June 27, 2026 settlement
- The June 27 weekly close of approximately $4,103/oz represented the lowest settlement of the entire 15-week downtrend
- The structural support zone was revised downward to a new range of $4,398 to $3,901
- The level required to flip the weekly trend from short to long sits approximately 752 points above current price, at approximately $4,855/oz
- Gold's expected weekly trading range is approximately 275 points, with a daily range of approximately 125 points
These figures suggest a trend reversal would require several months of sustained buying pressure under normal conditions.
The 21-Day Linear Regression Trend Indicator
The 21-day linear regression trendline consistency indicator, commonly referenced in technical analysis as a measure of directional momentum, remained in negative territory for both gold and silver across approximately three months of daily data as of late June 2026. Consequently, the gold-silver ratio analysis for this period reveals important signals about relative metal strength that investors should consider alongside directional momentum readings.
Combined with overhead resistance levels visible in 10-day market profile analysis, these technical factors suggest consolidation is the most probable near-term outcome rather than either a sharp recovery or an accelerated decline. For disciplined investors, overhead resistance levels identified through market profile analysis can serve as practical cash management guidance when positioning around fair value entry points.
Frequently Asked Questions: Gold Return to Fair Value
What Is Gold's Fair Value and How Is It Calculated?
Gold's fair value, as defined by the M2 monetary model, is calculated by indexing the gold price to the total US M2 money supply and adjusting for changes in estimated above-ground gold tonnage. As M2 expands, gold's fair value rises proportionally. As of late June 2026, this model placed fair value at approximately $3,979/oz. For additional perspective, the World Gold Council's valuation research outlines how institutional analysts approach this challenge across multiple frameworks.
Is Gold Currently Above or Below Fair Value?
As of late June 2026, gold at approximately $4,103/oz sat modestly above its M2-derived fair value of $3,979/oz, a premium of approximately +3.1%. However, it traded at a meaningful discount of approximately -6.0% to its BEGOS cross-asset regression value of $4,363/oz.
Does Gold Always Return to Fair Value?
Historically, gold has demonstrated a strong tendency to revert toward its M2-derived fair value over time, though the process can take months to years. The December 2015 low of $1,045/oz (vs. fair value of $2,442/oz) and the January 2026 high of $5,586/oz (vs. fair value of $3,856/oz) both illustrate how extended deviations ultimately resolve through mean reversion.
What Happens to Gold's Fair Value If Inflation Accelerates?
Accelerating inflation typically drives M2 expansion, which in turn raises gold's M2-derived fair value. Additionally, rising inflation expectations tend to increase gold's attractiveness as a real asset across institutional portfolios. Under a scenario where US inflation expectations rise materially, gold's fair value across multiple models would shift higher.
Is Buying Gold at Fair Value a Good Long-Term Strategy?
Based on historical evidence, purchasing gold at or below its M2-derived fair value has consistently resulted in positive long-term returns. The structural upward bias of M2, driven by fiscal deficits, debt monetisation pressures, and central bank policy, creates a rising fair value floor that rewards patient, value-disciplined investors.
How Does the Current Correction Compare to Historical Downtrends?
The 15-week parabolic short trend recorded through late June 2026 is significant but not unprecedented. The longest such downtrend in gold during the 21st century ran for 31 consecutive weeks from November 2012 through May 2013, a period during which gold's M2 fair value continued rising even as the price fell. Investors who used that correction as an accumulation opportunity were rewarded in the subsequent bull market.
Outlook for Gold Through the Second Half of 2026
Near-Term Consolidation vs. Long-Term Appreciation
Near-term factors (1 to 3 months):
- Fair value support near $3,979/oz has already demonstrated buying interest
- The July 29 FOMC policy decision is the primary near-term catalyst
- Technical trend remains bearish; reversal requires sustained recovery to approximately $4,855/oz
- Overhead resistance in market profile analysis limits near-term upside
Medium-term factors (3 to 12 months):
- Persistent inflation at two to three times the Fed's target provides structural support
- Any dovish pivot or rate pause would likely accelerate recovery toward BEGOS Market Value near $4,363/oz
- Continued M2 expansion will progressively raise the fair value floor
- GDP-linked models project approximately 5.2% annualised returns for gold through 2040
The core investment case for gold has not changed. The metal's gold return to fair value during the week of June 23 to 27, 2026, was not simply a technical event. It was a reminder that beneath the noise of short-term price action, a mathematically grounded valuation framework continues to operate, rising steadily, rewarding those patient enough to act on it.
This article is intended for informational and educational purposes only. It does not constitute financial or investment advice. All forecasts, projections, and scenarios discussed are based on publicly available models and historical data. Past performance is not indicative of future results. Investors should conduct their own research or consult a qualified financial adviser before making any investment decisions.
Want to Know When the Next Major Gold Discovery Hits the ASX?
While understanding gold's fair value provides a powerful framework for long-term positioning, the most significant returns in the sector have historically come from being first to act on major mineral discoveries. Discovery Alert's proprietary Discovery IQ model scans ASX announcements in real time, instantly identifying high-potential discovery opportunities across gold and more than 30 other commodities — visit the Discovery Alert discoveries page to explore historic examples of exceptional returns, and begin your 14-day free trial to position yourself ahead of the broader market.