
June 15, 2026
Gold Corrections and the Anatomy of Secular Bull Markets
Every major gold bull market in modern history has been punctuated by corrections violent enough to convince participants the uptrend is finished. The 2006 pullback shook out latecomers before gold continued its march toward $1,000. The 2008 correction coincided with the global financial crisis and still resolved into one of the most powerful precious metals rallies ever recorded. Understanding this recurring pattern is not merely academic; it is the foundational lens through which the question of has gold finally reached a bottom must be examined in mid-2026.
The current drawdown has crossed into territory that technically qualifies as a bear market by conventional definition, yet the structural conditions underpinning gold's long-run ascent remain fundamentally unaltered. Separating cyclical noise from structural signal is the central challenge for investors navigating this environment. Furthermore, understanding secular gold cycles provides essential context for interpreting where we currently stand.
When big ASX news breaks, our subscribers know first
Why Corrections Are Built Into Gold's Long-Run Architecture
Gold's secular bull markets do not travel in straight lines. Intermediate corrections ranging from 10% to 20% or more are a recurring characteristic of these multi-year uptrends, and they serve an important mechanical function: they flush speculative excess, reset sentiment to bearish extremes, and create the base from which the next major leg higher can launch.
The distinction between a correction, a base-building phase, and an outright bear market carries significant practical implications:
- A correction is a temporary price decline within an ongoing uptrend, typically resolving within weeks to a few months without a change in the underlying fundamental drivers.
- A bear market involves a sustained decline of 20% or more accompanied by deteriorating fundamentals, structural institutional selling, and a shift in the macro backdrop.
- A base-building phase occurs when selling pressure exhausts itself, supply and demand reach equilibrium, and patient buyers begin accumulating ahead of the next advance.
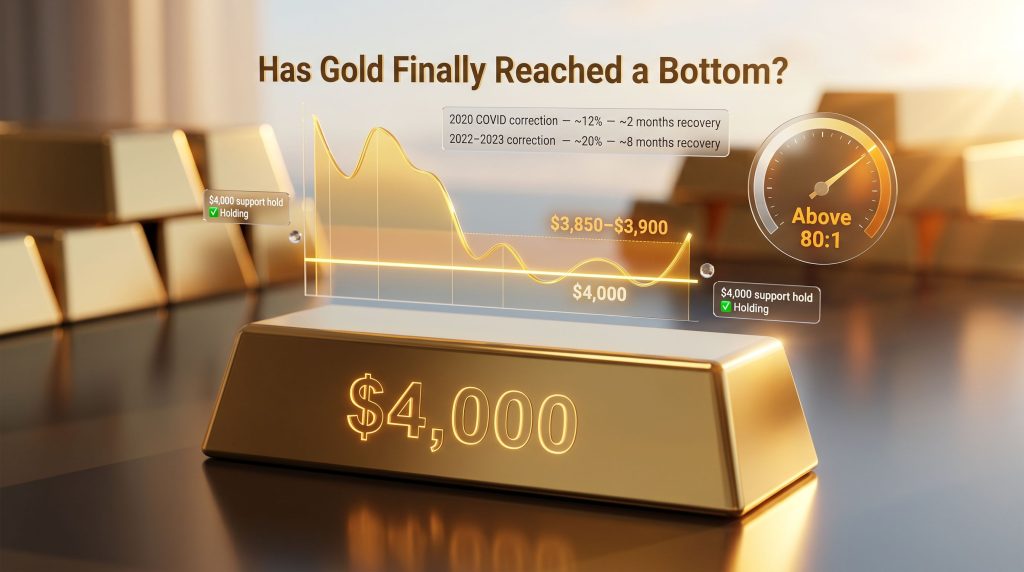
The current pullback technically entered bear market territory by crossing the 20% decline threshold from peak levels. Yet the $4,000 per ounce support zone has held, and none of the fundamental drivers that propelled gold to record highs have materially deteriorated. That combination is what most technical analysts classify as a severe intermediate correction rather than a structural breakdown.
What the $4,000 Level Actually Represents
The $4,000 price level carries weight beyond its psychological appeal as a round number. It corresponds to a significant prior consolidation zone formed during the preceding rally phase, meaning it represents an area where a substantial volume of transactions occurred and where buyers previously demonstrated conviction.
A sustained closing break below this level would shift the technical picture materially. Its continued defence, on the other hand, supports the thesis that a base is forming. Technicians tracking the market are watching several concurrent signals:
| Signal | Current Status | Bullish Threshold |
|---|---|---|
| $4,000 support hold | Holding | Sustained closes above |
| Moving average recapture | Pending | Price above 50-day MA |
| Volume on bounces | Mixed | Higher volume on up days |
| Momentum divergence | Developing | RSI divergence on lows |
| $3,850–$3,900 retest risk | Possible | Final flush before recovery |
The possibility of a final shakeout toward the $3,850 to $3,900 range before a durable low forms is something a meaningful cohort of market technicians considers a realistic scenario. This type of move, sometimes called a capitulation wick or bear trap, serves the purpose of removing the last remaining weak-handed long positions before institutional accumulation begins in earnest. From the $4,000 zone, this would represent an additional 3% to 4% decline, which remains within the structural bounds of a corrective sequence.
The Four-Pillar Framework for Confirming a Precious Metals Low
Calling a bottom in gold requires more than a one-day price bounce. Experienced technical analysts apply a multi-layered confirmation process before declaring a low as durable. The four core pillars of this framework are:
1. Price Structure Confirmation
- Formation of higher lows on the daily chart
- Recapture of the 50-day moving average on a closing basis
- A break above the most recent swing high to establish a new short-term uptrend
2. Momentum Divergence
- The Relative Strength Index forming higher lows while price forms equal or lower lows
- The MACD histogram turning positive after a prolonged negative reading
- The Stochastic oscillator crossing above the 20-level from deeply oversold conditions
3. Volume and Participation Dynamics
- Declining volume on down days, signalling sellers are losing conviction
- Expanding volume on recovery attempts, indicating buyers are stepping in with force
- Open interest in gold futures showing evidence of short covering rather than new selling
4. Sentiment and Positioning
- The Commitment of Traders report revealing net speculative long positions at multi-month lows
- Gold ETF flows transitioning from consistent net outflows to net inflows
- Retail sentiment gauges reaching extreme bearish readings, which historically function as contrarian buy signals
Early-stage signals are present across several of these pillars in the current environment, but analysts broadly agree that confirmation requires sustained improvement, particularly a decisive move back above key moving averages, before the bottom can be called with real conviction.
The Macro Pressures Behind the Mid-2026 Gold Pullback
Understanding why gold corrected is as important as understanding whether it has bottomed. Three structural pressures drove the drawdown:
Liquidity and Positioning Overextension
After an extended rally to record highs, speculative positioning in gold futures became historically stretched. Momentum-driven funds that had accumulated large long positions began taking profits, and this profit-taking became self-reinforcing as algorithmic strategies amplified the selling. This is the signature of a technical, liquidity-driven correction rather than a collapse in the investment thesis.
Real Interest Rate Sensitivity
Gold maintains a well-documented inverse relationship with real yields. When real interest rates rise, or when expectations for future rate paths shift higher, the opportunity cost of holding a non-yielding asset like gold increases. The current correction aligns temporally with a period of recalibrated rate expectations in global bond markets. Historically, once real rates stabilise or resume a declining trajectory, gold tends to recover its footing with considerable speed.
Dollar Dynamics and the De-Dollarisation Undercurrent
Short-term dollar strength applies mechanical downward pressure to USD-denominated gold prices. However, the more consequential longer-run dynamic is the ongoing structural shift away from dollar-centric reserve management by emerging market central banks. Central bank gold demand has remained robust throughout this corrective period, providing a demand floor beneath spot prices that did not exist during previous corrective episodes.
Are Gold's Fundamental Drivers Still Intact?
One of the most important analytical questions to ask during any correction is whether the forces that drove the preceding uptrend have changed. The evidence in mid-2026 suggests they have not:
| Fundamental Driver | Pre-Correction Status | Current Status |
|---|---|---|
| Central bank gold buying | Strong | Unchanged |
| De-dollarisation trend | Accelerating | Ongoing |
| Geopolitical risk premium | Elevated | Persistent |
| Real yield trajectory | Declining medium-term | Temporarily firmed |
| Inflation hedge demand | Active | Stable |
| ETF institutional flows | Positive | Mixed short-term |
What has changed is near-term positioning and sentiment, both of which are cyclical in nature. Structural drivers build over years and decades; sentiment shifts over weeks and months. The correction has reset sentiment from extreme optimism back toward pessimism, which is precisely the condition that tends to precede the next major advance. In addition, the gold safe-haven appeal underpinning long-term demand has remained structurally unchanged throughout the drawdown.
The next major ASX story will hit our subscribers first
Silver as a Leading Indicator: What the White Metal Is Signalling
Silver's role in confirming gold's directional turns is frequently underappreciated by investors focused solely on the yellow metal. Due to its smaller market capitalisation and higher beta characteristics, silver historically leads gold at major turning points. A confirmed silver bottom accompanied by a narrowing gold-to-silver ratio is one of the strongest leading indicators available to precious metals analysts.
Thorough gold-silver ratio analysis carries particular significance in this context. When this ratio trades above the 80:1 level, historical precedent consistently associates it with precious metals undervaluation and has preceded major rallies in both metals. A compression of this ratio, meaning silver outperforming gold on a relative basis, is one of the most reliable signals that a new bull leg in the broader complex is getting underway.
Analysts tracking both metals are specifically watching for silver to demonstrate relative outperformance as a prerequisite for calling a durable floor in gold. A gold recovery that silver fails to confirm raises questions about whether the bounce is sustainable or simply a technical retracement within an ongoing correction.
Three Scenarios for Gold's Path Forward
Rather than operating from a single forecast, a scenario-based framework better reflects the genuine uncertainty that exists at potential turning points.
Scenario 1: The Bottom Is Already In
Gold holds the $4,000 zone, constructs a base over two to four weeks, and then recaptures key moving averages. A catalyst such as renewed dollar weakness, softer economic data, or an escalation in geopolitical risk could accelerate this timeline. This scenario carries moderate probability and requires confirmation signals to align before acting with full conviction.
Scenario 2: One Final Flush Before the Real Bottom
Gold breaks below $4,000 on a closing basis and tests the $3,850 to $3,900 zone in a capitulation move. This would clear remaining weak longs, reset sentiment to extreme bearishness, and set the stage for a recovery that could be faster and more explosive than a gradual base-build. This scenario is also consistent with historical corrective patterns in gold bull markets and carries moderate probability.
Scenario 3: Structural Breakdown and Extended Bear Phase
A sustained break below $3,850 accompanied by deteriorating fundamentals — including rising real yields, sustained dollar strength, and reduced central bank purchasing — would represent a material shift in the macro environment. This scenario carries low probability given current evidence but serves as the important risk case that disciplined investors must acknowledge and monitor. Reviewing the broader gold bull market catalysts helps clarify which conditions would need to reverse for this scenario to materialise.
Historical Corrections Provide Important Context
Placing the current drawdown within historical context helps calibrate expectations around both depth and duration. According to market analysts tracking gold's price history, the pattern of severe corrections within ongoing bull markets is well established:
| Period | Peak-to-Trough Decline | Duration | Recovery Time |
|---|---|---|---|
| 2006 correction | ~22% | ~3 months | ~4 months |
| 2008 correction | ~34% | ~8 months | ~12 months |
| 2011–2015 bear market | ~45% | ~4 years | ~9 years |
| 2020 COVID correction | ~12% | ~2 months | ~2 months |
| 2022–2023 correction | ~20% | ~10 months | ~8 months |
The current correction's depth and duration place it within the historical range of normal intermediate corrections rather than the type of structural bear market seen between 2011 and 2015. That 2011 to 2015 episode remains the critical cautionary data point: a reminder that corrections can extend far beyond initial expectations when the macro backdrop fundamentally shifts. The available evidence in 2026 does not yet support that conclusion, but it warrants ongoing monitoring.
Notably, the 2020 COVID correction demonstrates that even sharp, rapid collapses can resolve with extraordinary speed when the underlying macro drivers remain in place. Duration and depth alone do not determine a correction's outcome; the integrity of the fundamental thesis is the more decisive variable.
Five Signals That Would Validate a Durable Gold Bottom
For investors seeking a disciplined, evidence-based approach to re-entering or adding to gold exposure, the following five confirmations represent the most meaningful thresholds to monitor:
- Sustained close above the 50-day moving average, which remains the single most-watched technical threshold among professional precious metals analysts.
- Silver outperforming gold on a relative basis, with the gold-to-silver ratio compressing from elevated levels.
- Gold ETF inflows turning consistently positive, signalling institutional money is re-entering the complex rather than continuing to reduce exposure.
- The Commitment of Traders report showing reduced speculative short exposure, confirming that professional traders are covering rather than adding to bearish positions.
- The Dollar Index showing renewed weakness, removing the primary mechanical headwind to USD-denominated gold prices.
Investors who wait for all five signals to align risk missing the early and often most profitable portion of the recovery. Those who act before any confirmation materialises risk entering a still-declining market. A staged entry approach — building a partial position at current levels and adding incrementally as confirmation signals emerge — offers a risk-managed framework for navigating genuine uncertainty.
Frequently Asked Questions: Gold Bottom Signals and Market Timing
Has gold officially entered a bear market in mid-2026?
By the conventional 20% decline threshold, gold technically crossed into bear market territory. However, the $4,000 support level has held, and the structural macro drivers behind the gold bull market remain intact. Most technical analysts characterise this as a severe intermediate correction rather than a fundamental trend reversal.
What price level would confirm gold has bottomed?
A sustained close above the 50-day moving average, combined with gold holding above $4,000 and silver demonstrating relative outperformance, would represent meaningful technical confirmation. A single session's bounce is insufficient; analysts require multiple sessions of improving price action and breadth before declaring a confirmed low.
Could gold fall further from current levels before bottoming?
A final shakeout toward the $3,850 to $3,900 range remains a possibility that several technical analysts consider consistent with historical corrective patterns. As recent coverage of gold's price movements highlights, a move to that area from the $4,000 zone would represent approximately 3% to 4% of additional downside and would not, on its own, invalidate the broader bull market thesis.
What is the gold-to-silver ratio signalling right now?
An elevated gold-to-silver ratio above the 80:1 level has historically been associated with undervaluation in the precious metals complex and has preceded major advances. Investors tracking this ratio are watching for silver to begin outperforming gold as an early confirming signal that the next bull leg is beginning.
How long do intermediate corrections in gold typically last?
Based on historical secular bull market data, intermediate corrections in gold typically last between two and ten months, with the majority resolving within six months. The current correction's duration is consistent with this historical range, which further supports an intermediate correction classification rather than a structural bear market.
The Bottom Line: Possible, But Not Yet Confirmed
The weight of available technical, macro, and sentiment evidence points toward has gold finally reached a bottom being plausible, with the $4,000 level functioning as the critical dividing line between a base-building scenario and a deeper decline. Early stabilisation signals are present across multiple analytical frameworks, yet confirmation remains incomplete.
The fundamental case for gold — anchored by persistent central bank demand, structural de-dollarisation trends, and enduring geopolitical risk premiums — has not been impaired by the correction. What the correction has done is reset positioning and sentiment from extended optimism back toward the scepticism that historically precedes major advances.
The most analytically honest conclusion available: whether has gold finally reached a bottom is possible, and the low may already be in, but the market has not yet delivered the technical evidence required to call it with confidence.
Investors who treat the current environment as a high-probability setup requiring confirmation — rather than a confirmed bottom demanding immediate action — are best positioned to navigate this uncertainty. The discipline to distinguish between anticipating an outcome and having evidence of it is what separates investors who navigate turning points successfully from those who confuse conviction with certainty.
This article is intended for informational and educational purposes only. It does not constitute financial advice. Past performance of gold markets and historical correction patterns do not guarantee future results. Investors should conduct their own research and consider seeking professional financial advice before making investment decisions.
Want to Know When the Next Major ASX Gold Discovery Hits the Market?
Discovery Alert's proprietary Discovery IQ model delivers real-time alerts the moment significant ASX mineral discoveries are announced, transforming complex data across 30-plus commodities into clear, actionable insights — so investors are positioned ahead of the broader market. Explore Discovery Alert's discoveries page to understand how historic mineral discoveries have generated substantial returns, and begin a 14-day free trial today to secure a genuine market-leading edge.