August 3, 2026
When Two Buyers Operate on Entirely Different Timelines
Most commodity markets move in a single direction at any given time. Buyers accumulate when prices are low and retreat when prices climb. Gold, however, has never followed that logic cleanly, and in 2026, the divergence has become sharper than at any point in more than a decade. The metal is simultaneously being sold by one category of investor and aggressively accumulated by another, and the two groups are operating on entirely different time horizons with entirely different motivations.
Understanding this split is more instructive than watching the spot price tick up or down on any given session. The real story of gold in 2026 is a structural one, and it begins with recognising that central bank gold buying and Western ETF selling are not simply opposite sides of the same trade. They represent fundamentally different theories of what gold is and who it serves.
When big ASX news breaks, our subscribers know first
The Demand Schism Defining Gold in 2026
Official-Sector Buyers vs. Western Retail Investors
Gold demand reached 1,269 tonnes in Q2 2026, a figure that held firm even as the LBMA gold price averaged $4,506.29 per ounce, representing a 37% increase year-over-year. The persistence of strong demand at record-level prices challenges the conventional economic assumption that higher prices suppress consumption. In gold's case, elevated prices appear to have done nothing to deter the buyers who matter most to the long-term supply-demand equation.
The reason for this anomaly lies in the composition of demand. Central banks are not price-sensitive buyers in the traditional sense. Their purchasing programs are structured around multi-year reserve objectives rather than short-term price signals, which means they continue accumulating through market weakness, price surges, and periods of macro uncertainty alike. Western ETF investors, by contrast, are acutely sensitive to the opportunity cost of holding non-yielding assets, and rising real yields have pushed many of them toward the exit.
The result is a two-speed market where official-sector momentum and retail-sector caution are running simultaneously, and the question of which force ultimately prevails will determine gold's medium-term trajectory. Understanding the gold market outlook for the remainder of 2026 requires tracking both forces concurrently.
What Is Driving Central Bank Gold Accumulation?
The Reserve Diversification Imperative
The motivations behind sovereign gold purchases extend well beyond inflation hedging. Over the past several years, a growing number of central banks, particularly across emerging markets, have accelerated efforts to reduce their exposure to US dollar-denominated assets. Gold, which carries no counterparty risk and cannot be frozen or sanctioned, has become the preferred diversification instrument for reserve managers navigating an increasingly fragmented geopolitical landscape.
This dynamic, often described as the de-dollarisation trend, does not require outright dollar rejection to generate sustained gold demand. Even incremental shifts in reserve allocation, when multiplied across dozens of central banks simultaneously, produce enormous aggregate buying volumes. Furthermore, central bank gold demand has been a consistent driver of price support across multiple market cycles.
Which Central Banks Led Q2 2026 Purchases?
| Central Bank | Q2 2026 Purchases | Cumulative Reserves | Notable Context |
|---|---|---|---|
| Poland | 51 tonnes | 632 tonnes | H1 total: 82 tonnes; targeting 700-tonne reserve level |
| People's Bank of China | 33 tonnes | 2,346 tonnes | Largest single quarter since Q4 2023 |
| Kazakhstan | Active buyer | Ongoing | Part of broader EM reserve diversification program |
| India | Active buyer | Ongoing | Multi-year accumulation strategy in place |
Poland's trajectory deserves particular attention. With 82 tonnes purchased in the first half of 2026 alone and a publicly stated ambition to reach a 700-tonne reserve level, Warsaw has become one of the most aggressive sovereign gold accumulators in Europe. The People's Bank of China's 33-tonne Q2 purchase was its largest quarterly addition since late 2023, lifting reported reserves to 2,346 tonnes and reinforcing Beijing's long-standing commitment to reducing dollar concentration in its reserve portfolio.
The 289-Tonne Quarter: What the Scale of Official Buying Signals
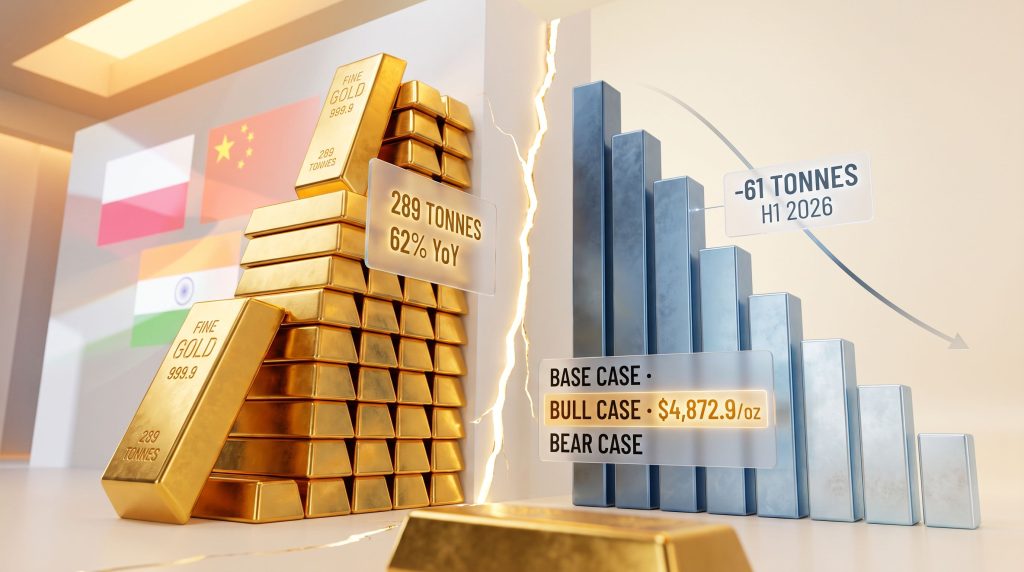
Global central bank net gold purchases totalled 289 tonnes in Q2 2026, a figure representing a 62% increase compared to the same quarter in 2025. When combined with 244 tonnes of net buying in Q1 2026, the official sector has absorbed roughly 533 tonnes in the first half of the year alone. Analysts at Sprott have noted that this scale of official accumulation reflects a fundamental repositioning of reserve strategy across sovereign institutions.
"Critical Context: This buying occurred at an average LBMA price of $4,506.29/oz, confirming that official-sector demand is structurally price-inelastic. These are not opportunistic buyers waiting for dips. They are executing long-term programs regardless of prevailing market conditions."
A World Gold Council survey of reserve managers reinforced the forward-looking dimension of this trend. 89% of surveyed central banks indicated they expect global gold reserves to grow over the next 12 months. More strikingly, 45% reported plans to actively increase their own gold holdings within the same window, a record-high response in the survey's history. Tracking central bank gold reserves across major economies confirms that this is a sustained structural shift rather than a short-term anomaly.
What Is Causing Western Gold ETF Outflows?
The Real Yield Mechanism
The logic connecting rising real yields to gold ETF selling is straightforward but frequently misunderstood in terms of its magnitude. Gold generates no income. It pays no coupon and offers no dividend. When the real return available from holding inflation-protected government bonds is close to zero or negative, gold's lack of yield is a minor inconvenience. However, as real yields climb, the opportunity cost of holding gold rises proportionally, making yield-bearing alternatives increasingly attractive to rate-sensitive investors.
Step-by-step: How rising TIPS yields translate into ETF outflows
- The Federal Reserve signals a tighter-for-longer monetary policy stance
- US 10-year TIPS yields rise, increasing the real return available from inflation-protected bonds
- The opportunity cost of holding non-yielding gold increases proportionally
- Rate-sensitive Western investors reduce their gold ETF allocations in favour of fixed-income instruments
- North American ETF outflows accelerate, creating short-term selling pressure on gold prices
- If central bank purchasing volumes exceed the ETF liquidation, spot gold holds its structural floor
The H1 2026 ETF Data: Context and Severity
| Period | North American ETF Flow | Key Context |
|---|---|---|
| H1 2026 | -61 tonnes | Weakest first half since 2013 |
| Q2 2026 | -45 tonnes | Occurred despite LBMA gold averaging $4,506/oz |
| March 2026 | Approx. $12 billion global outflow | Record single-month redemption; ended a 9-month inflow streak |
Three Federal Reserve officials stated publicly that inflation could remain above the 2% target without necessarily triggering additional rate hikes, a position that introduced ambiguity into market expectations and kept rate-sensitive capital cautious. With markets pricing an October Fed rate hike as a live possibility, the incentive to maintain gold ETF allocations has been limited for Western investors prioritising yield.
Asian ETF Inflows: A Partial Counterweight
One dimension of the ETF picture that frequently goes underreported is the geographic divergence within the ETF market itself. While North American funds experienced their worst first half since 2013, Asian-listed gold ETFs have been registering consistent inflows, driven by domestic investors in China and India who view gold through a cultural and savings lens that differs substantially from the yield-driven calculus of Western fund managers.
This east-west split within the ETF market mirrors, in miniature, the broader demand divergence between central banks and Western retail investors. The geographic broadening of gold's demand base is itself a structural development worth monitoring. In addition, gold as a safe haven remains a compelling proposition across Asian markets irrespective of prevailing yield conditions.
Why Gold Is Holding Above $4,000 Despite Significant Selling
The Absorption Mechanism
The persistence of gold above $4,000 per ounce despite meaningful ETF liquidation is not accidental. It reflects a straightforward demand absorption dynamic: central bank purchasing volumes have been large enough to absorb the selling pressure generated by North American fund outflows without allowing the market to breach its structural floor.
When the selling from Western ETFs produces downward price pressure, official-sector buyers executing pre-committed multi-year programs step in and absorb available supply. Because central bank buying programs do not pause in response to short-term price dips, they effectively function as a demand floor beneath the spot price.
The dollar index also contributed a layer of complexity. With the index holding near 99.79 and having declined more than 1.5% over the prior week following coordinated yen-buying intervention between Japan and the United States, currency dynamics added a mild tailwind to dollar-denominated gold prices even as geopolitical risk premiums partially unwound.
Standard Chartered's analysis pointed to seasonal buying patterns as an additional support mechanism expected to provide price reinforcement through the second half of 2026, while the World Gold Council characterised investment demand as likely to remain constructive across the same period. VanEck's research has similarly highlighted that official-sector buyers are structurally unlikely to retreat even if price levels remain elevated.
The 2.5% TIPS Yield Threshold: Gold's Critical Macro Tripwire
Why This Level Matters
Among the various macro indicators that influence gold pricing, the US 10-year TIPS yield occupies a unique position because it directly measures the real return available from risk-free government paper. When this yield approaches 2.5%, historical patterns suggest that the opportunity cost of holding gold becomes prohibitive for a meaningful segment of Western institutional investors.
The threshold is not a hard rule. It represents the level at which fixed-income alternatives become sufficiently attractive to trigger systematic portfolio reallocation away from gold. As the TIPS yield approaches this level, North American ETF outflows tend to accelerate and inflows tend to reverse. Consequently, the interplay of gold and bond dynamics is central to understanding where ETF flows are likely to head in the coming quarters.
ING's analysis noted that the Fed is unlikely to delay another rate decision unless economic data deteriorates meaningfully, a view that suggests the TIPS yield could remain elevated in the near term unless labour market conditions weaken substantially.
The next major ASX story will hit our subscribers first
Three Demand Scenarios for Gold Through Q3 and Q4 2026
| Scenario | Key Trigger | Central Bank Buying | ETF Flow Direction | Gold Price Outlook |
|---|---|---|---|---|
| Base Case | TIPS yield stable below 2.5% | ~289t per quarter | Modest continued outflows | Consolidation near $4,000+ |
| Bull Case | ETF sentiment reversal and CB acceleration | 300t+ per quarter | Inflows return | Retest of $4,872.9/oz |
| Bear Case | October Fed hike pushes TIPS above 2.5% | Continued but insufficient | Accelerated outflows | Pullback toward $3,700-$3,900 |
Scenario 1: Base Case Consolidation
Central banks maintain approximately their Q2 pace of 289 tonnes per quarter. TIPS yields remain below the critical 2.5% threshold. North American ETF outflows stabilise but do not reverse. Gold consolidates at current levels through Q3, supported by official-sector demand.
Scenario 2: Bull Case Breakout
Additional reserve-diversifying nations follow the lead of Poland and China, pushing quarterly central bank buying beyond 300 tonnes. Simultaneously, fading Fed rate hike expectations draw Western ETF investors back into gold allocations. In this scenario, spot gold could realistically retest the Q1 2026 record average of $4,872.9 per ounce within two to three quarters.
Scenario 3: Bear Case Correction
An October Fed rate hike pushes TIPS yields decisively above 2.5%, triggering extended North American ETF redemptions that exceed the H1 total of 61 tonnes. Central bank buying continues but proves insufficient to absorb the accelerated liquidation. Gold retreats toward the $3,700 to $3,900 range before finding institutional support.
The Four Indicators Every Gold Market Participant Should Be Watching
The near-term resolution of these scenarios depends heavily on a small set of data releases and yield movements. In descending order of significance:
- US 10-year TIPS yield — The primary real-yield signal for ETF demand sensitivity and the clearest leading indicator for Western fund flows
- Nonfarm payrolls — Strong labour data raises the probability of an October Fed rate hike, increasing pressure on gold ETF holdings
- ADP employment report — Functions as a leading indicator for the official payrolls figure and can shift rate expectations in advance
- Weekly jobless claims — Rising claims reduce the likelihood of a Fed hike, which could support a recovery in ETF inflows
Gold's Evolving Role: Geopolitical Hedge vs. Financial Asset
Two Philosophies of Ownership
The central bank and Western ETF divergence is not simply a short-term positioning gap. It reflects two fundamentally different philosophies about what gold represents in a modern portfolio.
For central banks, gold is a geopolitical instrument: sovereign, counterparty-free, internationally fungible, and immune to the political risks attached to holding another nation's currency as a reserve asset. These buyers think in decades, not quarters. Their decision to accumulate is driven by reserve composition strategy, not by whether the gold price is up or down in any given month.
For Western ETF investors, gold is primarily a financial asset, one that competes with bonds, equities, and other yielding instruments for portfolio allocation. When those alternatives become more attractive, gold loses its relative appeal. When they become less attractive, gold regains it.
"Long-Term Insight: The most consequential scenario for gold pricing is not central bank buying alone or ETF recovery alone. It is the simultaneous occurrence of both. If Western ETF demand recovers while official-sector buying continues at current levels, gold would face a concurrent demand surge from two of its largest buyer categories, a configuration that has historically produced significant and sustained price appreciation."
The Structural vs. Cyclical Question
Perhaps the most important analytical distinction for investors tracking central bank gold buying and Western ETF selling is whether the official-sector demand shift is structural or cyclical. The evidence increasingly points toward the former. Multi-year reserve targets, publicly stated accumulation programs, and a record proportion of central banks signalling future purchases all suggest that official-sector gold demand has fundamentally repositioned itself at a higher baseline, regardless of where the Fed funds rate sits or where real yields land in any given quarter.
Western ETF flows, by contrast, remain cyclical. They respond to rate expectations, dollar dynamics, and investor sentiment. When those conditions shift, as they eventually will, the structural floor already established by central bank buying could convert into a springboard for the next significant leg higher.
This article is intended for informational purposes only and does not constitute financial or investment advice. All forecasts, scenario projections, and price targets discussed represent analytical frameworks based on publicly available data and should not be relied upon as predictions of future market performance. Investors should conduct their own due diligence before making any investment decisions. Data sourced from the World Gold Council Gold Demand Trends reports, ING Research, and Standard Chartered market analysis.
Want to Stay Ahead of the Next Major Mineral Discovery?
Discovery Alert's proprietary Discovery IQ model scans ASX announcements in real time, delivering instant alerts on significant mineral discoveries across more than 30 commodities — turning complex data into clear, actionable opportunities for investors at every level. Explore historic discoveries and their returns, or start your 14-day free trial at Discovery Alert to position yourself ahead of the broader market.