August 3, 2026
The Invisible Architecture Behind Gold's Long-Term Rise
Investor attention tends to fixate on gold's most recent price move. A sharp rally generates euphoria; a correction triggers panic. Yet the most consequential question for long-term capital allocation has nothing to do with what gold did last quarter. It concerns whether the conditions underpinning a gold secular bull market remain intact, and whether the most powerful phase of that advance has even begun.
Understanding this requires stepping back from short-term noise and examining the deeper monetary architecture that has historically driven gold's greatest bull markets. When viewed through this lens, the current environment bears a striking resemblance to conditions that preceded the most explosive phases of prior secular gold advances, not because of any single catalyst, but because of the convergence of multiple reinforcing structural forces.
When big ASX news breaks, our subscribers know first
Secular vs. Cyclical: Why the Distinction Matters More Than Most Investors Realise
Most gold price discussions conflate two fundamentally different types of market behaviour. A cyclical bull market in gold is driven by temporary catalysts: a Federal Reserve rate pivot, a geopolitical flashpoint, or a short-term inflation spike. These moves can be dramatic, but they tend to exhaust themselves within one to three years as the catalysts fade.
A gold secular bull market is an entirely different animal. It operates across timeframes measured in decades, not months, and is anchored by structural shifts in monetary systems, fiscal regimes, and global capital flows. Crucially, secular bull markets can absorb corrections of 20% to 40% without invalidating the underlying trend. The correction is not the story; the structural architecture beneath it is.
Historical secular gold bull markets provide useful benchmarks:
| Era | Approximate Duration | Approximate Price Gain | Primary Structural Driver |
|---|---|---|---|
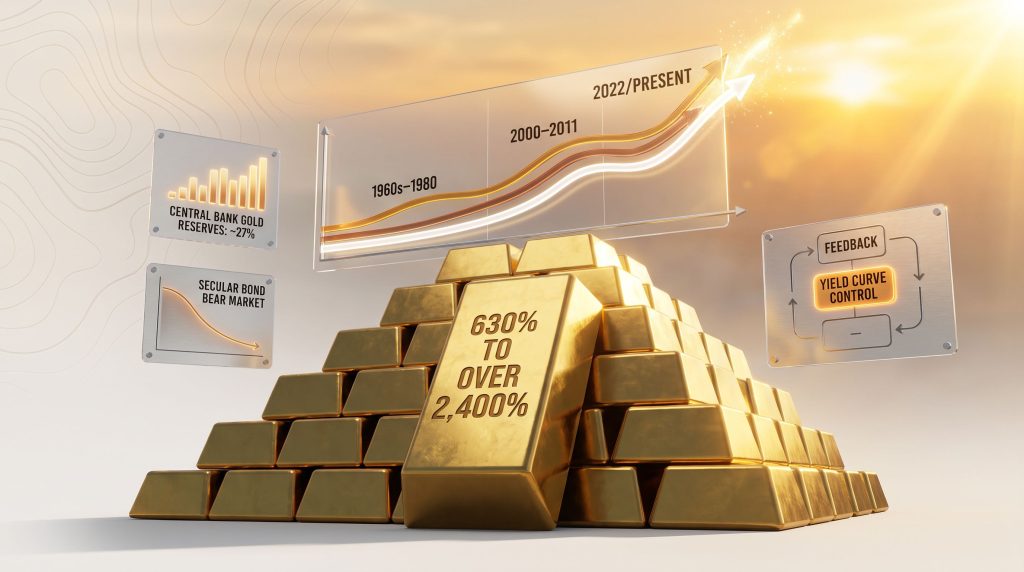
| Late 1960s to 1980 | ~20 years | ~2,400% (from $35 to ~$850) | Bretton Woods collapse, stagflation |
| 2000 to 2011 | ~11 years | ~630% | Dot-com bust, GFC, sustained USD weakness |
| 2022/2024 to Present | Early stage | TBD | Sovereign debt stress, bond bear market, de-dollarisation |
Furthermore, understanding gold and stock market cycles is essential context here. Both prior secular advances were preceded by major secular peaks in equities. Both were sustained not by a single catalyst but by the compounding interaction of multiple structural forces. The current environment, assessed against these historical templates, suggests the gold secular bull market may be at an early-to-middle stage, with its most powerful phase yet to be triggered.
The Equity Secular Peak: The Most Historically Reliable Precursor
Of all the structural forces shaping gold's long-term trajectory, the most historically consistent precursor to explosive gold advances has been the formation of a secular peak in equity markets. The pattern across multiple cycles is difficult to dismiss:
- The stock market peaked in 1929; gold stocks did not peak until approximately eight years later
- Equities peaked again in 1968; precious metals and hard assets did not peak until more than eleven years later
- Stocks reached a secular peak in 2000; precious metals and hard assets followed with a peak approximately eleven years later, around 2011
The implication is counterintuitive to many investors. Gold's most explosive secular advances have not necessarily coincided with equity crashes in real time. Rather, they have followed the confirmation of a secular equity peak, as capital gradually and then acceleratingly rotates from overvalued financial assets into tangible stores of value.
The largest pool of globally investable capital sits in equities. When a secular equity bear market is confirmed, even a modest reallocation toward gold and hard assets represents a demand shock of historic proportions.
According to analysis published at Gold-Eagle.com by Jordan Roy-Byrne, CMT, equities have not yet clearly reached their secular peak, which means the most powerful phase of capital rotation into gold may still lie ahead. If historical cycle durations hold as a rough guide, that rotation could unfold over a period measured in years, not months.
Why Secular Equity Peaks Are So Difficult to Identify in Real Time
One of the lesser-appreciated complexities of secular market analysis is that secular peaks in equities are almost never obvious at the moment they occur. They are typically confirmed only in retrospect, after a sustained period of underperformance relative to other asset classes.
This is why some analysts argue the gold secular bull market cannot be fully validated until equities demonstrably and consistently underperform a conventional 60/40 portfolio over a multi-year period. This ambiguity is not a weakness in the structural thesis. It is precisely what explains why large-scale capital rotation into gold tends to be a gradual and then sudden process, rather than an orderly one.
The Bond Bear Market: The Transmission Mechanism Most Investors Underestimate
The second major structural pillar is the secular bear market in bonds, which most analysts identify as having begun in the period immediately following the COVID-19 pandemic, bringing to an end a four-decade bull market in fixed income that had run from the early 1980s. In addition, gold and bond market dynamics during this transition period have become increasingly important for long-term investors to understand.
The transmission mechanism by which a bond bear market eventually becomes bullish for gold operates in two distinct phases, a nuance that is frequently misunderstood:
- Phase 1: Rising yields initially redirect capital toward equities, as higher discount rates are offset by earnings optimism and the perception that rising rates reflect economic strength. During this phase, gold and equities can temporarily rise together.
- Phase 2: Sustained yield elevation begins to erode equity valuations, compress corporate margins, and increase the cost of government debt servicing. This is the inflection point at which the bond bear market transitions from an equity tailwind into an equity headwind, triggering the capital rotation into gold that defines the most explosive phase of a secular gold advance.
A historically instructive parallel exists in the mid-to-late 1960s. A secular bear market in bonds emerged during that period, initially supporting equity markets before eventually contributing to their structural undoing. The precious metals and hard asset complex did not enter its most powerful advance until the bond bear market had fully undermined the equity narrative, a process that took years to complete.
The bond bear market that began post-COVID is not simply a challenge for fixed-income investors. It is the geological fault line beneath the entire global capital allocation landscape, one whose full consequences for equity markets have not yet been felt.
U.S. Sovereign Debt: A Confluence of Extremes Without Historical Precedent
The third structural pillar involves the deterioration of U.S. public finances, and it is here that the current environment is arguably most distinct from prior historical episodes. The challenge is not simply that debt levels are high. It is that multiple fiscal stress indicators are simultaneously at extreme levels, in a context where the bond market is already in a secular bear market.
| Fiscal Metric | Current Status | Historical Comparison |
|---|---|---|
| Debt-to-GDP ratio | At historic extremes | Late 1940s: high, but interest payments were low |
| Interest payments as % of GDP | At extreme levels | Late 1980s: high payments, but Debt/GDP was low |
| Average interest rate on federal debt | Approximately 3.4% | 1940s: near-zero via yield curve control |
| Bond market environment | Secular bear market | 1940s: yields controlled via Fed suppression |
Prior historical episodes each featured one or two of these metrics at extreme levels, but not all simultaneously. The 1940s saw high Debt-to-GDP but low interest payments, resolved through the Federal Reserve's implementation of yield curve control (YCC) in 1942, which held rates artificially low while inflation and nominal GDP growth gradually reduced the debt burden. The cost was significant inflation throughout the decade.
The late 1980s featured extremely high interest payments but relatively manageable Debt-to-GDP, resolved through a combination of falling rates, fiscal tightening, and a technology-driven productivity boom. However, today, both metrics are simultaneously at extremes, and the bond market is already in a secular bear market. This combination is, in a meaningful sense, without direct historical precedent.
The most probable policy resolution pathway, according to multiple independent analysts, is a return to yield curve control, where nominal yields are explicitly capped below inflation, engineering deeply negative real interest rates. Furthermore, gold in the monetary system has historically served as a primary refuge during precisely these kinds of policy-driven financial repression environments.
Why Yield Curve Control Is the Critical Variable for Gold Investors
Yield curve control is a monetary policy mechanism in which a central bank commits to purchasing unlimited quantities of government bonds to prevent yields from rising above a specified target. The U.S. Federal Reserve last employed this tool between 1942 and 1951 to manage the debt burden accumulated during World War II.
The consequences for gold are direct and historically well-established. When nominal yields are suppressed below the prevailing inflation rate, real yields turn deeply negative. Negative real yields eliminate the opportunity cost of holding gold, which generates no income. In every major historical episode of sustained negative real rates, gold has been one of the primary beneficiaries of the resulting capital reallocation.
Negative real interest rates do not merely support gold. They fundamentally alter the investment calculus by making the act of holding cash or bonds a guaranteed loss of purchasing power in real terms, transforming gold from a speculative alternative into a rational default.
Central Bank Demand: The Structural Floor That Most Retail Investors Ignore
The fourth structural pillar is the sustained acceleration of central bank gold demand, and it represents one of the most underappreciated demand dynamics in the gold market.
Between 1960 and 1990, gold represented between 40% and 65% of total global central bank reserves. At the peak of the 1980 gold bull market, that allocation stood at approximately 65%. Today, based on the most recent available data, that figure has fallen to approximately 27%.
The structural gap between the current 27% allocation and the historical 40% to 65% range represents an enormous potential demand runway if central banks continue their current trajectory of reserve diversification. Analysts tracking central bank gold reserves note that this diversification trend shows no signs of reversing in the near term.
Central bank motivations for increasing gold holdings are structural rather than speculative:
- Rising U.S. sovereign debt levels reduce the attractiveness of U.S. Treasury holdings as a reserve asset
- The demonstrated willingness of Western governments to weaponise dollar-denominated assets through sanctions has accelerated reserve diversification among non-allied nations
- The gradual emergence of a multi-polar global reserve system reduces the structural dominance of any single fiat currency, increasing the relative appeal of a neutral, non-sovereign store of value
- Central bank purchases have historically demonstrated price-insensitive buying behaviour, providing a consistent demand floor during corrections that would otherwise destabilise speculative markets
Analysis from Jordan Roy-Byrne, CMT at The Daily Gold, published on Gold-Eagle.com, notes that central bank buying played a demonstrable role in supporting gold at the 2018 and 2022 price bottoms, and that continued accumulation may be contributing to a demand floor during the current corrective phase.
The next major ASX story will hit our subscribers first
The Feedback Loop: How the Four Pillars Reinforce Each Other
What makes the current structural setup particularly compelling from an analytical perspective is not the existence of any single bullish factor, but the degree to which these four forces interact and amplify one another:
- The secular bond bear market directly increases the cost of government debt refinancing, worsening the sovereign fiscal position
- A deteriorating fiscal position accelerates central bank diversification away from U.S. Treasuries and toward gold
- The combination of extreme debt levels and a bond bear market makes yield curve control the most politically and economically viable resolution pathway
- Yield curve control creates deeply negative real rates, which historically represent the most powerful sustained environment for gold appreciation
- Eventually, the bond bear market spills over into equities, triggering the large-scale capital rotation that defines the most explosive phase of a secular gold advance
This is not a linear story with a single catalyst. It is a self-reinforcing macro architecture in which each element compounds the others over time. For those seeking further context, this analysis of secular bull market drivers offers a detailed examination of how these forces have historically interacted across prior cycles.
Potential Accelerants and Risks to the Structural Thesis
No structural thesis is without risk, and intellectual honesty requires acknowledging the scenarios that could delay or disrupt the gold secular bull market narrative.
Potential accelerants include:
- A confirmed secular peak and sustained underperformance in major equity indices
- Formal adoption of yield curve control by the Federal Reserve
- A sovereign debt crisis in a major economy requiring explicit debt monetisation
- Acceleration of central bank reserve diversification beyond current trajectories
- Further geopolitical fragmentation driving emergency restructuring of dollar-based reserve systems
Potential delays or risks include:
- A sustained equity bull market that continues to absorb global capital flows, delaying rotation into hard assets
- A deflationary shock that temporarily strengthens the dollar and compresses inflation expectations
- A technology-driven productivity breakthrough that resolves fiscal imbalances through growth rather than inflation, echoing the 1990s dynamic
- Policy miscalculation by central banks that inadvertently stabilises the bond market without triggering the inflation-resolution pathway
Where the Current Cycle Stands: Early Innings, Not Late Game
Compared with the approximately 20-year duration of the 1968 to 1980 cycle and the roughly 11-year duration of the 2000 to 2011 cycle, the current cycle is widely assessed as being in its early-to-middle phase at most. Consequently, gold's bull market may still be young, a view supported by the relative absence of the broad capital rotation that historically marks the mature phase of these advances.
The most powerful catalyst, a confirmed secular equity bear market triggering broad capital rotation into gold and hard assets, has not yet materialised. The structural conditions that historically produce that catalyst are, however, progressively advancing. The bond bear market is established. The sovereign debt problem is worsening. Central bank diversification is accelerating.
Sharp corrections within this framework, including the recent pullback following gold's strongest two-year performance in decades, are entirely consistent with historical secular bull market patterns. In both the 1970s and the 2000s cycles, significant intra-trend corrections occurred without reversing the underlying structural advance.
Disclaimer: This article is intended for informational and educational purposes only. It does not constitute financial advice or a recommendation to buy or sell any security or asset. Gold price forecasts, historical analogies, and structural analyses involve inherent uncertainty. Past market cycles are not a reliable guarantee of future performance. Investors should conduct independent research and consult a qualified financial adviser before making investment decisions.
Want to Identify ASX Mineral Discoveries Before the Broader Market Does?
Discovery Alert's proprietary Discovery IQ model delivers real-time alerts on significant ASX mineral discoveries, turning complex mineral data into actionable insights for both short-term traders and long-term investors — explore the historic returns major discoveries have generated to understand what's possible, then begin your 14-day free trial at Discovery Alert to position yourself ahead of the market.