July 31, 2026
The Hidden Architecture Beneath Gold's Price Moves
Most investors think they understand gold. They watch the Federal Reserve, track inflation prints, and monitor ETF flows. But the current market environment in mid-2026 exposes a far more complex set of forces operating simultaneously beneath the surface, and many of the most consequential dynamics are ones that rarely appear in mainstream financial commentary.
When higher treasury yields drive gold lower as central bank buying accelerates, the apparent contradiction demands a deeper framework than simple cause and effect. Understanding why gold fell even as sovereign demand hit multi-year highs requires pulling apart the mechanics of how different buyer categories interact, how official statistics systematically obscure true demand, and why the long-end of the yield curve has become a more important variable than the Fed funds rate itself. Furthermore, the gold and bond dynamics at play here reflect a structural shift that extends well beyond short-term rate expectations.
When big ASX news breaks, our subscribers know first
Why the 30-Year Treasury Yield Matters More Than the Fed Right Now
The distinction between short-end and long-end yield movements is not semantic. It carries entirely different implications for gold pricing, monetary policy signalling, and investor positioning.
Short-term rate hike expectations move with Fed communication. Long-end yields, by contrast, are shaped by a combination of term premium, inflation expectations, fiscal sustainability concerns, and global capital flows. When the 30-year U.S. Treasury yield climbed to its highest level in nearly two decades, the pressure on gold was driven by the latter mechanism, not the former.
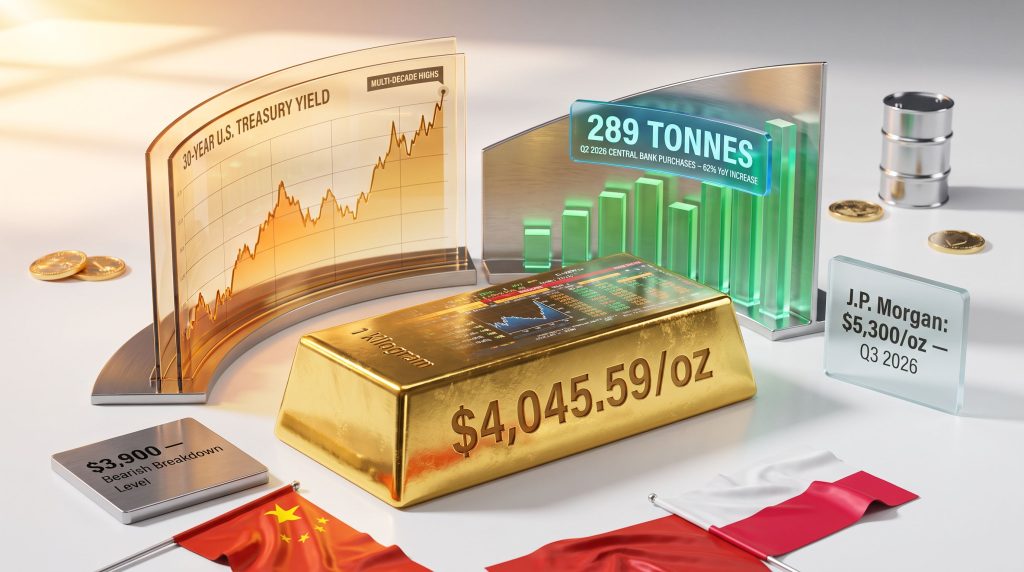
This matters because the policy narrative was actually softening at the same time. September Fed rate hike odds dropped to 67% from 81% following a 9-3 vote to hold rates, with Chair Kevin Warsh declining to signal an imminent resumption of tightening. Yet spot gold still fell approximately 0.5% to $4,045.59/oz, having gained as much as 2% in the prior session.
The divergence between a dovish-leaning Fed decision and continued gold weakness tells investors something important: the dominant pressure is structural, not cyclical. It originates in the long end of the yield curve, not in near-term policy repricing.
That structural pressure reflects the opportunity cost mechanism at its most basic. Gold generates no yield. When investors can lock in meaningful long-duration returns from U.S. government bonds, capital migrates accordingly. The higher that yield premium climbs, the more persistent the headwind becomes. However, gold's safe-haven role continues to provide a meaningful counterweight during periods of geopolitical uncertainty.
Comparing the Two Yield Scenarios: What Each Means for Gold
| Driver | What It Signals | Implication for Gold |
|---|---|---|
| Rising short-term rate hike odds | Near-term tightening risk | Bearish via risk appetite compression |
| Rising 30-year structural yields | Fiscal concern or inflation premium | Bearish via opportunity cost |
| Falling hike odds + rising long yields | Policy ambiguity + structural pressure | Mixed, demand fundamentals matter more |
| Rising yields + geopolitical shock | Inflation risk + safe-haven demand | Potentially neutral or bullish |
Energy Markets, Inflation Risk, and the Fed's Uncomfortable Position
The geopolitical dimension layered into this environment adds a second order of complexity. Brent crude reaching $100 per barrel following U.S. military strikes on Iranian targets, Houthi attacks on Saudi oil tankers in the Red Sea, and subsequent strikes extending to an Egyptian port injected a significant energy supply risk premium into markets.
The inflationary implications of sustained triple-digit oil were not lost on bond markets or the Fed. Prior to the hold decision, September rate hike odds had surged to 81.4% from 52.4% in a matter of days, a repricing velocity that illustrates just how sensitive monetary policy expectations remain to energy price shocks.
The Fed's decision to hold and avoid forward guidance preserved optionality but introduced ambiguity. Three dissenting votes within the committee signal that internal consensus is fragile. For gold, this ambiguity is a modest near-term buffer. Markets cannot price in an aggressive tightening cycle when the central bank itself is divided on direction.
The Demand Side: Why Official Statistics Are Misleading Investors
The Reported vs. Actual Purchasing Gap
One of the least discussed dimensions of the global gold market is the systematic gap between what central banks disclose and what they actually buy. This gap is not incidental. It is structural, and it means that investors relying on IMF headline data are consistently underestimating the strength of sovereign demand.
J.P. Morgan estimated that Q1 2026 reported net central bank purchases amounted to just 16 tonnes. However, analysis incorporating OTC market flows and refinery channel data pointed to actual buying of approximately 244 tonnes, rising from 208 tonnes recorded in Q4 2025. That is a reporting gap of more than 15 times the disclosed figure.
China illustrates this most clearly. Net gold imports into China reached 317 tonnes in Q1 2026 alone, nearly triple the prior quarter's level, yet the bulk of this volume did not surface in official reserve reporting. The mechanisms behind this discrepancy include purchases routed through state-owned entities, sovereign wealth vehicles, and intermediary structures that operate outside the narrow definition of central bank reserve assets.
Investors who anchor their gold demand analysis to IMF-reported figures are, in effect, looking at roughly one-fifteenth of the actual institutional buying activity in a given quarter. The true demand floor beneath gold prices is substantially higher than headlines suggest.
The Scale of Q2 2026 Central Bank Accumulation
The World Gold Council's Q2 2026 data confirmed the trend in headline terms as well. Consequently, central bank demand trends are reshaping the structural foundation of gold pricing in ways that short-term yield analysis alone cannot capture:
- Central banks added 289 tonnes of net gold purchases in Q2 2026
- That figure represents a 62% increase year-over-year
- 45% of global reserve managers surveyed indicated plans to increase gold holdings within the next 12 months
- Poland and China were among the most active disclosed buyers during April 2026, with China continuing its multi-quarter accumulation trend
- Full-year 2025 central bank purchases totalled approximately 863 tonnes, historically elevated even relative to the prior three years
Why Sovereign Buyers Create a Different Kind of Demand Floor
Central banks and sovereign reserve managers do not behave like retail or institutional fund investors. They are not optimising for quarterly returns, responding to technical breakouts, or cutting positions based on yield differentials. Their buying is driven by reserve diversification mandates, geopolitical risk frameworks, and long-horizon balance sheet management.
This price-insensitivity is precisely what makes central bank gold buying so structurally significant. A central bank accumulating gold at $4,000/oz is not deterred by a move to $3,900/oz in the same way a leveraged speculator would be. This creates a persistent demand anchor that operates independently of the yield-driven selling pressure currently dominating short-term price action.
India and China: The Two Asian Demand Stories Investors Are Reading Wrong
India's Tariff-Induced Statistical Distortion
India's gold demand figures for Q2 2026 showed a 6% decline to 131.4 tonnes, and this number has been widely cited as evidence of softening Asian appetite. That interpretation misreads what actually happened.
The combined effect of a 15% import duty and a 3% Goods and Services Tax created an effective price premium of 18% on officially imported gold. This wedge was wide enough to make unofficial trading channels economically attractive at scale. Gold seizures at Indian borders nearly doubled to 160.91 kg from 86.16 kg, and estimates suggest more than 100 tonnes of demand migrated into unofficial trade flows during the quarter.
India's underlying appetite for gold has not diminished. The policy structure simply redirected where that demand shows up in the data. Investors treating the headline decline as genuine demand destruction are drawing the wrong conclusion.
China's Insurance Sector: A Structural Demand Catalyst Hiding in Plain Sight
While much attention focuses on China's central bank and sovereign buying, a regulatory change in the country's insurance sector may represent one of the most significant structural demand catalysts currently underpriced by markets.
Chinese insurers received approval to allocate up to 1% of their assets under management to physical gold. Given the scale of China's insurance industry, this single policy change translates to approximately 200 tonnes of potential incremental demand. Unlike ETF flows or speculative positioning, insurance sector allocations tend to be long-duration, methodical, and relatively insensitive to short-term price volatility.
Combined with ongoing central bank accumulation and strong retail demand, China's demand profile adds a meaningful structural bid to the global gold market that did not exist in the same form twelve months ago. In addition, why central banks are turning to gold reflects a broader de-dollarisation trend that extends well beyond any single country's policy decisions.
ETF Outflows in Context: The Metric Markets Overweight
Western institutional analysis of gold markets frequently places disproportionate emphasis on ETF flow data. This creates a persistent analytical blind spot. ETF outflows reached 45 tonnes in Q2 2026, which sounds significant in isolation. Against 289 tonnes of central bank buying in the same period, the signal shrinks considerably.
The World Gold Council has identified OTC markets and Asian physical demand as the primary structural drivers of gold pricing over the medium term. This represents a meaningful shift from the 2015–2019 period when Western institutional flows and Fed rate expectations were the dominant variables. Investors who have not updated their analytical framework for this shift in demand geography are likely to misread price movements in both directions.
The next major ASX story will hit our subscribers first
Price Scenarios: Where Gold Goes From Here
Key Levels and Institutional Forecasts
| Scenario | Price Target | Key Condition |
|---|---|---|
| Near-term downside | $3,900/oz | Brent sustains above $100/bbl; long yields extend higher |
| Current range | ~$4,045/oz | Yield pressure offset by central bank demand |
| Bullish technical confirmation | $4,730/oz | Break above resistance signals demand dominance |
| J.P. Morgan base case | $5,300/oz by Q3 2026 | Continued official-sector accumulation |
| J.P. Morgan bull case | $6,000/oz by Q4 2026 | Accelerating reserve diversification and geopolitical premium |
TD Securities has flagged $3,900/oz as a near-term downside risk specifically tied to the scenario where energy prices remain elevated and sustain inflationary pressure that forces a Fed policy pivot back toward tightening. The broader gold price outlook hinges on whether structural demand can absorb the yield-driven headwind over the coming quarters.
J.P. Morgan's significantly more constructive view is built on the structural demand thesis. At $5,300/oz by Q3 and $6,000/oz by Q4 2026, the bank is effectively arguing that the yield headwind is temporary while the reserve diversification cycle is multi-year. Furthermore, how the debt cycle favours gold provides a compelling macroeconomic backdrop for understanding why institutional conviction in gold remains elevated even as short-term yields press higher.
The forecasting divergence is not noise. It captures the central analytical question: is the current yield pressure a permanent constraint on gold, or a cyclical headwind that sovereign demand will ultimately absorb?
The Two Catalysts That Will Resolve Near-Term Uncertainty
- U.S. PCE Inflation Report – if the print surprises to the upside, the Fed's hold becomes harder to sustain, rate hike odds move back above 80%, and the path toward $3,900/oz becomes more credible
- WGC Quarterly Reserve Data – if central bank buying maintained or exceeded its Q2 pace, the structural demand floor thesis gains significant confirmation, supporting the medium-term case for $4,500/oz and beyond
When Yields and Gold Rise Together: Historical Exceptions Worth Understanding
The inverse relationship between real Treasury yields and gold is one of the most reliable in commodity markets, but it is not unconditional. Several environments have historically produced simultaneous increases in both:
- Fiscal credibility crises: When rising yields reflect deteriorating sovereign creditworthiness rather than economic strength, gold benefits as a non-sovereign alternative store of value
- Geopolitical disruption: Conflict risk and systemic uncertainty can generate a safe-haven premium large enough to override yield-driven selling
- Accelerating inflation expectations: If nominal yields are rising because inflation is moving faster than rates, real yields remain low or negative, the historically optimal environment for gold
- Reserve diversification cycles: Sustained sovereign de-dollarisation creates persistent gold demand regardless of prevailing yield levels
The current environment contains elements of all four. That complexity is precisely why forecasts from major institutions diverge so significantly, and why investors should be cautious about applying simple rules to an unusually multifaceted market structure.
Positioning Framework for Investors in the Current Environment
The short-term and long-term signals in gold markets are pointing in different directions simultaneously. Investors need a framework that accounts for both. Notably, higher treasury yields drive gold lower as central bank buying accelerates precisely when this divergence in signals is most acute.
Short-term headwinds to monitor:
- 30-year Treasury yields near two-decade highs
- Brent crude above $100/bbl sustaining inflation risk
- Federal Reserve internal disagreement creating policy uncertainty
- ETF outflows continuing from Western institutional holders
Long-term structural supports:
- Central bank buying at historically elevated volumes with systematic underreporting
- China's insurance sector opening a new long-duration demand channel
- Emerging market reserve diversification away from dollar-denominated assets
- India's underlying demand intact despite tariff-induced channel distortion
For investors with a medium-to-long horizon, the yield-driven pullback toward the $4,000 to $4,100/oz range may represent a structurally supported accumulation window, provided PCE data does not force an aggressive Fed policy reversal. In this environment, higher treasury yields drive gold lower as central bank buying accelerates as a recurring dynamic — one that is likely to define the gold market well into 2027 and beyond.
Disclaimer: This article is for informational purposes only and does not constitute financial or investment advice. All price forecasts referenced reflect the published views of named third-party institutions and are subject to change. Past performance and institutional price targets are not guarantees of future results. Investors should conduct their own due diligence and consult a qualified financial adviser before making investment decisions.
Want to Know When the Next Major Gold Discovery Hits the ASX?
Discovery Alert's proprietary Discovery IQ model scans ASX announcements in real time, instantly identifying significant mineral discoveries and translating complex data into actionable insights — so subscribers can position ahead of the broader market. Explore how historic discoveries have generated substantial returns on Discovery Alert's dedicated discoveries page, and begin your 14-day free trial today to secure a market-leading edge.