July 25, 2026
The Structural Forces Behind Gold's Crisis Response Patterns
Commodity market relationships during energy supply disruptions reveal complex institutional dynamics that challenge conventional investment wisdom. While precious metals traditionally serve as inflation hedges, their behavior during acute oil shocks demonstrates how modern portfolio structures and derivative markets can temporarily override fundamental safe-haven demand. This gold price drop during oil shock phenomenon becomes crucial as geopolitical tensions continue reshaping global energy flows and monetary policy responses.
Modern gold markets operate through multiple interconnected layers that can produce dramatically different price signals during crisis periods. The futures-driven price discovery mechanism, dominated by leveraged institutional positions, often diverges from physical market fundamentals when liquidity pressures intensify across financial systems.
When big ASX news breaks, our subscribers know first
The Paradox of Precious Metals During Energy Crises
Gold's reaction to oil supply shocks demonstrates the growing disconnect between paper market mechanics and underlying commodity fundamentals. Recent market events illustrate how institutional trading patterns can drive precious metals lower even as geopolitical risks intensify, creating temporary mispricings that challenge traditional portfolio hedging strategies. Furthermore, this gold price drop during oil shock pattern requires sophisticated analysis to understand properly.
Breaking Down the Correlation Myth
The assumption that gold and oil move in lockstep during supply disruptions has proven increasingly unreliable in modern market structures. Research from the World Gold Council indicates that gold-crude oil correlations fluctuate significantly across different time periods, with longer-term relationships often showing low positive or even negative correlations despite both assets serving as inflation hedges.
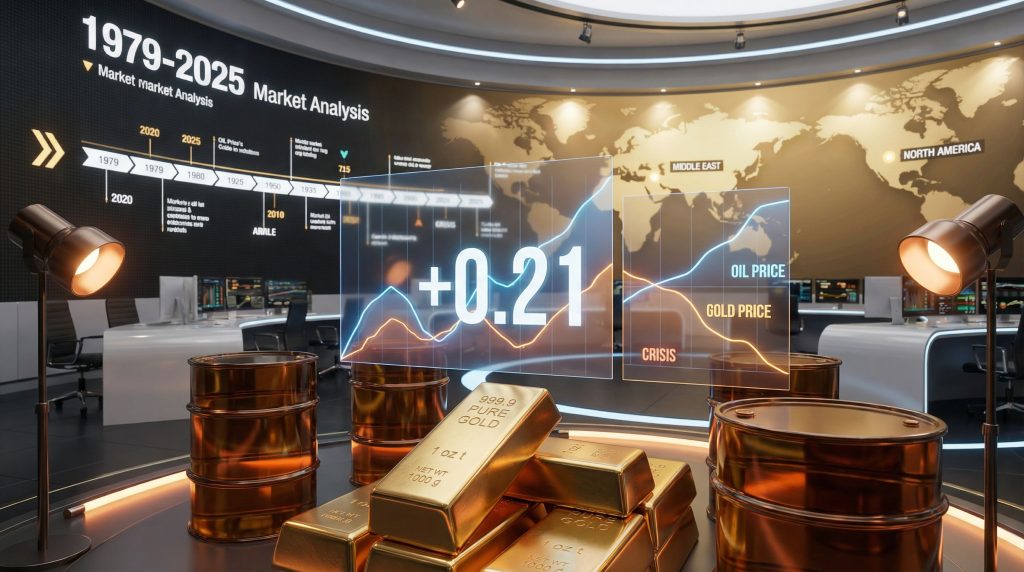
During acute crisis events, correlations can diverge dramatically from historical averages as different market mechanics take precedence. The March 2026 oil supply shock exemplifies this dynamic perfectly – Iran's threats to close the Strait of Hormuz, which would effectively cut off approximately 21% of global oil supply according to U.S. Energy Information Administration data, sent crude prices surging while gold initially declined.
Key factors disrupting traditional correlations include:
• Futures market dominance in price discovery mechanisms
• Institutional leverage ratios creating forced liquidation scenarios
• Currency market responses affecting dollar-denominated commodities
• Risk management protocols requiring portfolio rebalancing during volatility spikes
Paper Markets vs. Physical Reality
The fundamental distinction between futures-based price discovery and physical market conditions becomes most apparent during crisis periods. While paper gold markets faced selling pressure during the March 2026 geopolitical tensions, physical gold premiums remained elevated, reflecting genuine safe-haven demand from investors seeking tangible assets.
This divergence stems from the structural differences between leveraged financial instruments and direct ownership. Physical gold holders cannot receive margin calls or face forced liquidation scenarios that pressure leveraged positions in futures markets. The disconnect creates temporary arbitrage opportunities while demonstrating why investment objectives determine appropriate exposure methods.
Paper vs. Physical Market Characteristics:
| Market Type | Leverage Available | Margin Requirements | Counterparty Risk | Forced Liquidation |
|---|---|---|---|---|
| Physical Gold | None | None | None | Not Possible |
| COMEX Futures | High (10:1+) | Yes | Exchange/Broker | Automatic |
| Gold ETFs | Moderate | None | Fund Structure | Possible |
| Options | Very High | Premium Only | Exchange/Broker | Automatic |
Why Institutional Traders Sell Gold During Geopolitical Stress
Understanding institutional behaviour during oil shocks reveals the mechanical forces that can drive gold prices lower despite intensifying crisis conditions. Professional portfolio managers operate under risk management mandates that prioritise capital preservation and liquidity maintenance over fundamental asset positioning during acute stress periods.
The Liquidity Squeeze Phenomenon
When oil prices spike suddenly, leveraged institutional portfolios face immediate margin requirements and portfolio rebalancing demands. Gold's exceptional liquidity makes it an attractive asset for rapid liquidation, regardless of managers' fundamental outlook on precious metals. This selling pressure reflects operational necessity rather than changed investment thesis.
The March 2026 events demonstrated this mechanism clearly. Gold initially spiked from $5,296 to $5,423 on geopolitical tensions before reversing course as institutional selling pressure intensified. The subsequent decline of more than 6% from intraday highs occurred as dollar strength squeezed leveraged positions across commodity markets.
Institutional selling drivers during crisis periods:
• Margin call requirements – Energy position losses triggering cash demands
• Risk management protocols – Systematic position reduction during volatility spikes
• Liquidity generation – Gold's 24-hour trading enabling rapid cash conversion
• Portfolio rebalancing – Allocation models requiring position adjustments
• Dollar strength impacts – Currency movements affecting commodity valuations
Timeline of Market Reactions
Oil supply disruptions typically follow predictable institutional response patterns that create temporary gold price weakness before fundamental repricing occurs. The sequence reflects the different time horizons over which various market participants operate and adjust positioning.
Crisis Response Phases:
| Phase | Duration | Oil Behaviour | Gold Response | Primary Drivers |
|---|---|---|---|---|
| Initial Shock | 24-48 hours | Sharp spike (+15-25%) | Often declines (-2-5%) | Margin calls, forced selling |
| Assessment | 3-7 days | Volatility plateau | Sideways movement | Market evaluation of duration |
| Fundamental Repricing | 2-4 weeks | Sustained elevation | Gradual recovery | Inflation expectations adjust |
Portfolio Leverage and Risk Management
Modern institutional portfolios operate with sophisticated leverage structures that amplify both returns and risks during volatile periods. COMEX gold futures contracts represent 100 troy ounces each, with initial margin requirements typically ranging from $7,000 to $12,000 per contract depending on market conditions and brokerage requirements.
A $100+ per ounce intraday move can trigger maintenance margin calls on leveraged positions, forcing portfolio managers to either deposit additional capital or liquidate positions within hours. This mechanical process operates independently of fundamental analysis or long-term investment outlook.
The relationship between leverage ratios and forced selling creates feedback loops during crisis periods. As gold prices decline due to institutional selling, additional margin calls may trigger further liquidation, amplifying the initial price movement beyond what fundamental factors would justify. This technical analysis insight reveals crucial patterns for understanding market behaviour.
What Historical Patterns Reveal About Gold-Oil Dynamics
Examining past energy crises provides crucial insights into how precious metals behaviour has evolved alongside changing market structures and institutional frameworks. Each major supply disruption offers lessons about the complex relationships between energy prices, currency movements, and safe-haven asset demand, as detailed in our comprehensive gold record highs overview.
The 1979 Iranian Revolution Model
The 1979 oil crisis established the template for modern crisis responses, though market structures were fundamentally different. Oil prices rose from approximately $13 per barrel to $40 per barrel between 1978-1980, representing roughly a 200% increase over the full crisis period. Gold experienced initial weakness before recovering to post extraordinary gains, rising from approximately $180 per troy ounce to $850 by January 1980.
This pattern reflected the dominance of physical markets in price discovery during that era. Futures markets existed but remained smaller relative to spot trading, and institutional leverage was significantly lower than modern levels. The initial gold weakness lasted only days before fundamental repricing began as inflation expectations embedded.
Evolution Across Different Crisis Types
Comparative Crisis Analysis demonstrates changing market dynamics:
| Crisis Event | Oil Peak Movement | Gold Initial Response | Gold 6-Month Performance | Market Structure Context |
|---|---|---|---|---|
| 1979 Iran Crisis | +200% (full period) | Initial decline, then surge | +370% (annualised) | Physical market dominance |
| 1990 Gulf War | +65-90% | Positive (+12% first week) | +23% | Early futures market growth |
| 2008 Financial Crisis | +100% (to July peak) | Decline (-10-15%) | +85% recovery | Full derivatives integration |
| 2020 Pandemic | -60% to negative | Positive (+8-12%) | +25-30% | ETF and retail participation |
| 2026 Iran Tensions | Significant increase | Initial spike, then -6%+ | Ongoing | Advanced algorithmic trading |
Market Structure Evolution
The changing nature of gold's crisis responses reflects fundamental shifts in how precious metals markets operate. The 1979 crisis occurred when physical gold markets dominated trading and institutional leverage remained limited. By 2008-2026, futures markets controlled price discovery while ETFs and derivatives created new leverage mechanisms.
Key structural changes affecting price behaviour:
• Price discovery migration – From physical markets to COMEX futures dominance
• Institutional participation – Massive increase in leveraged professional trading
• Derivative complexity – Options, ETFs, and structured products amplifying volatility
• Algorithmic trading – Systematic strategies creating mechanical buying/selling pressure
• Central bank coordination – More explicit monetary policy responses to crises
This evolution explains why initial gold responses differ across crises despite similar supply shock triggers. Modern markets process information faster but create greater mechanical selling pressure during acute stress periods, leading to the gold price drop during oil shock phenomenon becoming more pronounced.
How Currency Movements Amplify Gold Price Volatility
The US dollar's dual role as both oil's primary pricing mechanism and gold's main competitor creates complex feedback loops during energy supply disruptions. Currency market responses often determine precious metals performance more than the underlying commodity supply fundamentals, particularly affecting market performance during surge scenarios.
The Dollar Strength Paradox
Oil supply disruptions frequently strengthen the dollar as global investors seek USD-denominated safety and energy alternatives. This dollar strength can temporarily suppress gold prices despite rising geopolitical tensions, as both assets compete for safe-haven capital flows but respond to different risk factors.
During the March 2026 Strait of Hormuz tensions, dollar strength contributed significantly to gold's price decline even as oil prices surged. The mechanism reflects established patterns where acute geopolitical stress initially benefits the world's primary reserve currency before longer-term inflation concerns support precious metals.
Dollar strength channels during oil crises:
• Flight to safety – USD bonds attracting international capital
• Energy payment flows – Increased dollar demand for oil transactions
• Central bank interventions – Fed policy responses supporting currency stability
• Risk-off positioning – Professional traders reducing non-dollar exposures
Federal Reserve Policy Response Patterns
Central bank reactions to oil-driven inflation fears significantly impact gold pricing through real interest rate adjustments and liquidity provision mechanisms. Historical analysis shows Fed policy responses often matter more for precious metals than the initial supply shock itself.
Policy response evolution:
-
1979 Era – Aggressive interest rate increases to combat inflation
-
1990s-2000s – Measured responses balancing growth and price stability
-
Post-2008 – Quantitative easing and extended low-rate policies
-
2020s-2026 – Complex balancing of inflation control and financial stability
Current Fed frameworks emphasise employment alongside inflation targets, creating more predictable policy responses that precious metals markets can anticipate and price accordingly. However, according to recent WSJ analysis, "rising oil prices continue to spur inflation worries, creating downward pressure on gold prices despite geopolitical tensions."
Portfolio Positioning for Energy-Driven Volatility
Rather than assuming automatic correlations between gold and oil during supply disruptions, sophisticated investors benefit from understanding the specific mechanics driving each crisis. Modern portfolio theory suggests precious metals allocation should account for both fundamental safe-haven properties and technical market dynamics.
The Physical vs. Paper Strategy Framework
Distinguishing between physical ownership and financial market exposure becomes crucial during crisis periods. Physical gold holders can maintain positions through market volatility without facing forced liquidation, while paper instruments may experience mechanical selling regardless of fundamental outlook.
Strategic considerations for oil shock scenarios:
• Physical premiums typically remain elevated regardless of futures price movements
• Regional availability variations become more pronounced during extended crises
• Central bank accumulation often accelerates during sustained energy disruptions
• Industrial demand impacts may affect silver differently than gold
Risk Management Framework for Crisis Investing
Professional portfolio management during energy crises requires understanding the temporal phases of market responses rather than relying on static correlation assumptions. Industry experts, including insights from our mining CEOs perspective analysis, emphasise the importance of timing considerations.
Three-phase positioning approach:
1. Immediate Response (0-48 hours)
- Expect potential gold weakness despite crisis conditions
- Monitor physical market premiums vs. futures prices
- Assess forced selling pressure indicators
2. Assessment Phase (3-7 days)
- Evaluate central bank communications on policy responses
- Track institutional positioning through COT reports
- Measure real interest rate trajectory changes
3. Fundamental Repricing (2-4 weeks)
- Analyse sustained energy price impacts on inflation expectations
- Monitor physical market supply/demand indicators
- Assess geopolitical resolution probability
The next major ASX story will hit our subscribers first
Early Warning Indicators for Gold's Crisis Response
Identifying leading indicators helps investors anticipate precious metals behaviour during oil supply disruptions before mechanical selling pressure intensifies. Professional traders monitor several key metrics that often signal potential volatility ahead of crisis events.
Monitoring Institutional Positioning
Commitment of Traders (COT) reports provide insights into leveraged positioning that may face pressure during energy shocks. Large speculative long positions in gold futures often indicate vulnerability to forced selling when margin requirements increase across commodity markets.
Exchange-traded fund flows offer additional perspective on institutional sentiment. Heavy ETF inflows preceding geopolitical tensions may signal crowded positioning that reverses during acute stress periods.
Key positioning indicators:
• COMEX open interest levels – High leverage ratios increase forced selling risk
• ETF flow patterns – Rapid inflows may indicate overcrowded trades
• Options positioning – Put/call ratios revealing hedging demand
• Central bank activity – Official sector buying patterns during stress periods
Real Interest Rate Trajectories
The relationship between oil-driven inflation expectations and Federal Reserve policy responses often determines gold's medium-term direction more than initial supply shock magnitude. Real interest rates (nominal rates minus inflation expectations) provide the fundamental framework for precious metals valuations.
When oil price increases drive inflation expectations higher faster than nominal interest rates rise, real rates decline and support gold prices over time. Conversely, aggressive Fed responses that raise nominal rates quickly can pressure gold even during ongoing geopolitical tensions.
Real rate monitoring framework:
• TIPS breakeven rates – Market-based inflation expectation measures
• Fed dot plot projections – Official policy rate guidance
• Term structure analysis – Yield curve shape indicating policy expectations
• International rate differentials – Relative central bank policy positioning
Furthermore, investors should consider our comprehensive gold price forecast when evaluating medium-term positioning strategies. According to recent CNBC reporting, "gold appears set for a weekly drop as oil price surge weighs on rate cut hopes," highlighting the interconnected nature of these market dynamics.
Investment Strategy Implications
Modern precious metals investing requires sophisticated understanding of how different market structures respond to energy crises. Traditional buy-and-hold strategies may benefit from tactical adjustments that account for mechanical selling pressure during acute crisis periods.
Timing Considerations for Physical Purchases
Historical evidence suggests that initial weakness in gold prices during oil shocks may provide attractive entry points for long-term physical accumulation. The March 2026 events demonstrated how fundamental safe-haven demand persists even while futures markets experience selling pressure.
Optimal purchase timing indicators:
• Futures market oversold conditions – Technical indicators suggesting excessive selling
• Physical premium expansion – Dealer premiums rising despite lower spot prices
• Central bank buying acceleration – Official sector demand increasing
• Currency market stabilisation – Dollar strength peaking during crisis phase
Portfolio Allocation Adjustments
Professional portfolio managers increasingly focus on precious metals allocation percentages rather than absolute position sizes during volatile periods. Ray Dalio's recommendation of 5-15% gold allocation in diversified portfolios provides a framework for maintaining exposure while managing volatility.
Allocation strategy components:
-
Core physical holdings (60-70% of metals allocation) – Long-term wealth preservation focus
-
Tactical positioning (20-30%) – Opportunistic buying during crisis-driven weakness
-
Hedging instruments (10-20%) – Options or inverse positions managing downside risk
This approach allows investors to benefit from crisis-driven opportunities while maintaining strategic precious metals exposure for fundamental portfolio protection.
Frequently Asked Questions
Why doesn't gold always rise during oil crises?
Gold's response during oil supply disruptions depends on multiple competing factors including dollar strength, institutional positioning mechanics, and the specific nature of the energy disruption. Short-term technical factors such as margin calls and forced liquidation often override fundamental safe-haven demand patterns, creating temporary price weakness before eventual fundamental repricing occurs.
How long do oil shock effects on gold typically last?
Initial volatility from energy supply disruptions usually subsides within 2-4 weeks as markets assess the lasting impact and duration of supply constraints. However, sustained oil price elevation may continue supporting gold over longer periods through embedded inflation expectations and real interest rate adjustments by central banks.
Should investors buy gold during oil price spikes?
Optimal timing depends on the specific crisis phase and individual portfolio objectives. Physical gold purchases during initial futures market weakness may prove advantageous for long-term wealth preservation strategies, while short-term traders face significant volatility risks from continued institutional selling pressure and currency market fluctuations.
The key consideration is distinguishing between temporary mechanical selling in paper markets versus fundamental changes in precious metals' wealth preservation properties during extended geopolitical tensions.
Disclaimer: This analysis is for educational purposes only and does not constitute investment advice. Past performance does not guarantee future results. All investments involve risk, including potential loss of principal. Investors should conduct their own research and consult with qualified financial professionals before making investment decisions. Commodity markets can be extremely volatile, and leveraged trading involves substantial risk of loss.
Ready to Capitalise on the Next Market-Moving Discovery?
Discovery Alert's proprietary Discovery IQ model delivers real-time notifications on significant ASX mineral discoveries, empowering subscribers to identify actionable opportunities whilst institutional traders navigate complex commodity market dynamics. Explore how historic discoveries have generated substantial returns and begin your 14-day free trial today to position yourself ahead of the market during volatile periods like these energy-driven commodity cycles.