
August 6, 2026
The Mechanics Behind the Florida Canyon Gold Recovery Rate
Heap leach gold mining is one of those industries where the headline production number rarely tells the complete story. When a mine reports a quarter of record throughput alongside a declining recovery rate, most observers focus on the output figure and move on. The more analytically useful question is the one that gets skipped: why did recovery fall, and what does that tell us about the margin structure of the operation going forward?
At Nevada open-pit gold mines operating heap leach circuits, the Florida Canyon gold recovery rate is best understood not as a geological constant but as a controllable output of processing decisions made at the mine site each quarter. That distinction has significant implications for how investors and analysts should interpret production reports, cost guidance, and feasibility study assumptions. Furthermore, understanding this dynamic is closely tied to the broader gold price and mining equities relationship that shapes investor returns.
When big ASX news breaks, our subscribers know first
How Heap Leach Processing Actually Works at Florida Canyon
The Fundamentals of Ore-to-Gold Conversion on a Leach Pad
Heap leach processing involves stacking crushed or uncrushed ore onto engineered impermeable pads, then applying a dilute cyanide solution that percolates through the ore column and dissolves the gold it contacts. The gold-bearing solution, known as pregnant leach solution (PLS), is collected at the base of the pad and processed through carbon adsorption or Merrill-Crowe circuits to strip and recover the metal.
Several physical variables govern how much gold the solution actually recovers:
- Particle size: Finer particles expose more gold surface area to the leach solution, increasing the probability of dissolution
- Percolation rate: Solution must move through the ore column at a rate that allows sufficient contact time without channelling around coarser material
- Solution contact time: Longer residence times on the pad generally improve gold extraction, particularly for coarser ROM material
- Ore mineralogy: Nevada oxide deposits, including Florida Canyon, are well-suited to heap leach because the gold occurs in an oxidised, soluble form rather than locked within sulphide minerals
Nevada's oxide gold belt is among the most technically favourable environments globally for heap leach extraction. The oxidised nature of the ore means cyanide can access gold without the additional processing steps required for refractory or sulphide-hosted deposits. This geological advantage underpins why operations like Florida Canyon can produce gold at relatively low capital intensity compared with mill-based alternatives.
The Two Processing Pathways That Define the Recovery Profile
Florida Canyon routes ore to the leach pads via two distinct pathways, each producing a fundamentally different recovery outcome:
| Processing Route | Method | Typical Recovery Range | Key Variable |
|---|---|---|---|
| Crushed ore | Ore reduced in size before pad placement | Low-to-mid 60% range | Finer particles, greater surface area exposure |
| Run-of-mine (ROM) | Ore trucked directly from pit to pad | High-40% to low-50% range | Coarser material, limited solution penetration |
| Historical crushed test work | Various ore domains and periods | 50% to 70% | Ore type and domain |
| Historical ROM test work | Various ore domains and periods | 30% to 58% | Ore type and domain |
The spread between these two pathways is substantial. At the upper end, crushed ore can recover nearly 20 percentage points more gold per tonne stacked than ROM material. This gap is the central operational lever at Florida Canyon, and it is entirely within management's control to influence through processing mix decisions.
Florida Canyon Gold Recovery Rate: What the Quarterly Data Shows
Recovery Performance Across Recent Reporting Periods
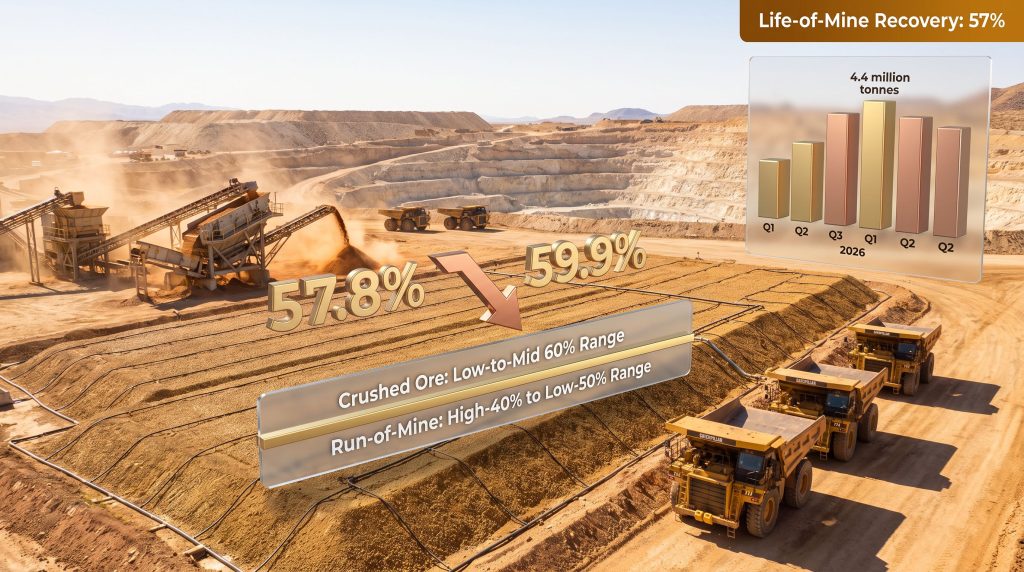
The Florida Canyon gold recovery rate has varied meaningfully across recent quarters and planning periods, with every movement traceable to shifts in the crushed-versus-ROM processing ratio rather than to changes in ore grade or deposit quality.
| Reporting Period | Blended Recovery Rate | Processing Mix Context |
|---|---|---|
| Q1 2026 | 59.9% | Higher proportion of crushed ore |
| Q2 2026 | 57.8% | Shift toward greater ROM placement |
| Recent prior period | 59.2% | Intermediate mix |
| Earlier operating period | 60.1% | Crushed-ore-weighted quarter |
| Cumulative through end-2023 | 55.1% | Per 2024 technical report |
| Cumulative through April 2026 | 58.7% | Per latest filing |
| Life-of-mine plan assumption | 57.0% | June 2026 feasibility study baseline |
What the table reveals is that quarterly recovery at Florida Canyon has consistently exceeded the 57% life-of-mine planning assumption in periods weighted toward crushed ore. The 57% figure is not a ceiling; it is the conservative planning floor derived from the current crusher capacity constraint.
The Q2 2026 Processing Mix Shift in Detail
The second quarter of 2026 produced 16,379 ounces of gold, a 30% increase over Q1. That headline figure obscures a more nuanced operational picture. Mining rates averaged 87,867 tonnes per day, a record for the operation, while ore mined rose 47% to 4.4 million tonnes. Ore placed on the leach pads climbed 45% to approximately 4.2 million tonnes, and the processed grade improved 21% to 0.23 grams per tonne (g/t). The strip ratio declined 38% to 0.81, with waste mined falling 8%.
Despite all of these improvements, the Florida Canyon gold recovery rate fell from 59.9% to 57.8%. The reason is straightforward once the processing mix is examined:
- Q1 2026 ROM placement: 1,074,000 tonnes
- Q2 2026 ROM placement: 2,332,000 tonnes (more than doubled)
- Q1 2026 crushed ore placement: 1,784,000 tonnes
- Q2 2026 crushed ore placement: 1,824,000 tonnes (essentially unchanged)
ROM tonnage doubled whilst crushed tonnage held flat. The blended recovery rate was pulled down not by any deterioration in ore quality or processing efficiency, but by a deliberate routing decision that sent a larger share of the quarterly ore feed directly to the pads without size reduction.
Operational insight: Recovery at Florida Canyon is more sensitive to the crushed-versus-ROM ratio than to ore grade movement. A quarter with lower-grade ore but a higher crushed ore proportion could theoretically deliver a better blended recovery figure than a higher-grade quarter dominated by ROM placement. Grade and recovery are separate levers at heap leach operations.
Why Recovery Rate Is a Cost-Per-Ounce Lever, Not Just a Processing Metric
The Direct Mathematical Link Between Recovery and All-In Sustaining Cost
In conventional milling operations, improving recovery typically requires additional reagent inputs, finer grinding, or more complex processing circuits, each of which adds cost. Heap leach operations have a structurally different relationship between recovery and cost. Directing more ore through the crusher increases the gold yield from material already committed to the leach pad without proportionally increasing operating costs.
The key fixed costs, including stripping, pad construction, and solution management, remain largely constant regardless of whether the incremental ounces come from crushed or ROM ore. This creates an asymmetric cost improvement opportunity: each percentage point of recovery improvement generates additional gold ounces from the existing ore inventory whilst spreading fixed costs across a larger recovered base.
Florida Canyon's 2026 Cost Profile in Context
| Cost Metric | Figure |
|---|---|
| Mine-site AISC guidance (2026) | US$3,300 to US$3,500 per ounce |
| Life-of-mine average AISC | US$2,331 per ounce |
| Life-of-mine cash cost | US$1,940 per ounce |
| Base-case gold price (plan average) | US$3,873 per ounce |
The 2026 guidance range of US$3,300 to US$3,500 per ounce represents the peak cost year of the mine plan. The primary driver is an intensive waste-stripping campaign designed to expose the higher-grade, lower-strip ore zones within the Central pit. Secondary contributors include elevated diesel fuel and explosives pricing, which are market-linked inputs that fluctuate independently of mine-site operational decisions.
The inherited Cat 777 truck fleet replacement programme, which is targeted for completion over approximately two years, adds another layer of near-term capital spend. The life-of-mine AISC projection of US$2,331 per ounce is notably more favourable than the 2026 guidance, illustrating that 2026 is structurally exceptional within the plan rather than representative of steady-state economics.
Why Crushing More Ore Is a Margin Strategy First
A less appreciated aspect of the crusher utilisation decision is that it functions as a capital-light margin improvement tool. Increasing the proportion of ore routed through an existing crusher does not require new mining activity, additional ore purchase, or expanded pad capacity. It uses the same tonne of ore that would otherwise go directly to the pad but extracts materially more gold from it.
The crusher expansion study currently underway at Florida Canyon is evaluating whether installed crushing capacity can be increased beyond current limits. Any expansion that shifts the long-run processing mix toward a higher crushed ore proportion would improve the blended life-of-mine recovery above the 57% feasibility study baseline, with the full cost benefit flowing through to reduced AISC per ounce recovered. Consequently, the current gold price outlook makes this margin optimisation especially timely for operators seeking to maximise returns.
The 8-Year Mine Plan and the 57% Recovery Assumption
How the Feasibility Study Baseline Was Derived
The June 2026 definitive feasibility study released by Integra Resources (TSXV: ITR | NYSE American: ITRG) sets a life-of-mine blended recovery rate of 57% as its planning assumption. This figure represents a weighted average of crushed ore recovery (low-to-mid 60% range) and ROM ore recovery (high-40% to low-50% range), calibrated against the expected processing mix achievable within the current crusher capacity envelope.
Key plan parameters include:
- Mine life: 8 years to 2033, plus two years of residual leaching
- Average annual production: 82,000 ounces of gold, a 17% increase over the prior 70,000-ounce plan baseline
- Life-of-mine blended recovery: 57%
- Life-of-mine average AISC: US$2,331 per ounce
The 57% assumption is not a geological limitation derived from the ore body. It reflects the processing capacity constraint that determines how much ore can practically be crushed within the planned operating schedule. Management has signalled that additional crushing study is ongoing outside the base plan, with the explicit aim of evaluating whether the blended recovery rate can be structurally improved beyond the feasibility study's conservative baseline.
Plan versus actuality: Quarterly results have already exceeded the 57% life-of-mine recovery assumption in periods where crushed ore placement dominated the mix, with Q1 2026 reaching 59.9% and earlier periods exceeding 60%. The feasibility study embeds recoverable upside for investors if crusher utilisation increases relative to the base-case processing mix.
What Would Be Required to Improve Beyond 57%?
Four mechanisms could push the blended Florida Canyon gold recovery rate above the feasibility study's planning floor:
- Increasing the proportion of quarterly ore tonnage routed through the existing crusher rather than placed as ROM
- Expanding crusher throughput capacity beyond currently installed limits through the crusher expansion study
- Optimising ore blending strategy to prioritise crushed placement during higher-grade mining intervals, maximising the value captured per percentage point of recovery improvement
- Introducing new oxide feed from the 50,000-metre drilling programme, including the Standard Mine target approximately five miles south of the main pit, untested by drilling for roughly 15 years
Each of these pathways represents genuine upside relative to the plan's conservative assumptions, with the crusher expansion carrying the largest structural impact potential. In addition, interpreting gold drilling results from the ongoing programme will be critical in assessing whether new oxide feed can further support recovery improvement.
The 2027 to 2029 Window: When Recovery Improvement Has the Greatest Leverage
Post-Stripping Phase as the Critical Performance Test
The operational logic of Florida Canyon's mine plan is sequential. The 2026 cost and recovery profile is a consequence of front-loading waste stripping to unlock access to the Central pit's higher-grade ore zones. The plan anticipates that once this stripping campaign is substantially complete, the mine enters a period of improved ore quality, lower strip ratios, and reduced unit costs.
Annual production targets of 80,000 to 85,000 ounces are established for 2027 and 2028. The combination of higher-grade ore and lower strip ratios in this window creates the conditions where recovery optimisation has the greatest margin amplification effect. Higher-grade ore entering the leach pad multiplies the value of each percentage point of recovery improvement, since every incremental percentage point is applied to a higher base metal content per tonne.
How Grade, Strip Ratio, and Recovery Interact
The three operational variables of ore grade, strip ratio, and recovery rate interact multiplicatively rather than additively in determining cash flow per tonne mined. A simultaneous improvement across all three in the 2027 to 2029 window would represent a compounding margin expansion, not merely the sum of three individual improvements.
Consider the directional logic:
- Lower strip ratios reduce the waste tonnes moved per ore tonne, cutting mining cost per tonne of ore
- Higher ore grades increase gold content per tonne processed
- Higher blended recovery converts a greater share of that gold content into recovered ounces
- All three improvements applied together amplify margin per tonne mined more than any single factor in isolation
Management has positioned this post-stripping phase as the window in which the operational thesis of the mine plan must be demonstrated. That makes the recovery rate decision during 2027 to 2029 particularly consequential for the long-run economics.
Key Milestones and Monitoring Points
| Date / Milestone | Significance |
|---|---|
| August 11, 2026 | Q2 2026 financial results; first detailed cost data from record-volume quarter |
| August 12, 2026 | Management call; commentary on H2 processing mix and recovery trajectory |
| Second-half 2026 | Monitor crushed-to-ROM ratio for shift toward greater crusher utilisation |
| Ongoing (42,500m of 50,000m drilled) | Near-mine oxide and dump material drill programme results |
| Coming weeks from July 2026 | First drilling at Standard Mine site, approximately five miles south of main pit |
| Crusher expansion study completion | Determination of whether increased crushing capacity enters the mine plan |
The next major ASX story will hit our subscribers first
Geological Context: Why Nevada Oxide Ore Is Suited to Recovery Optimisation
The Mineralogical Advantage Underpinning Heap Leach Economics
An aspect of the Florida Canyon recovery story that receives less attention than the processing mix debate is the geological foundation that makes recovery optimisation viable in the first place. Nevada's Basin and Range geology has produced a series of oxide gold deposits where the primary gold mineralisation has been chemically weathered over geological time, converting sulphide-hosted gold into forms that cyanide solution can access directly.
This oxidation is critical. At operations processing refractory or sulphide-hosted ore, gold particles are encapsulated within sulphide minerals such as pyrite or arsenopyrite, and the leach solution cannot reach them without pre-treatment such as roasting, pressure oxidation, or bioleaching. Those processes add substantial capital and operating cost.
Florida Canyon's oxide mineralogy means that improving recovery through finer crushing is technically straightforward. The gold is accessible to the leach solution; the question is simply how much surface area is exposed. This is why the processing mix decision carries so much operational leverage, and why the crusher expansion study represents a genuine improvement pathway rather than a speculative metallurgical exercise.
Ore Domain Variability Within the Deposit
An important nuance in interpreting recovery data is that not all ore zones within a heap leach deposit respond identically to crushing or ROM placement. Historical test work at Florida Canyon has produced recovery ranges of 50% to 70% for crushed material and 30% to 58% for ROM material, with variation driven by differences in ore texture, clay content, and gold deportment across the deposit's geological domains.
This variability means that the quarterly blended recovery figure is also a function of which ore zones are being mined in any given period, not just the processing route. A quarter that sources ore predominantly from domains with inherently higher cyanide amenability will outperform a quarter mining lower-amenability zones, even at the same crushed-to-ROM ratio. This domain-level variability is embedded in the life-of-mine plan's 57% assumption but creates additional quarter-to-quarter noise that complicates period-to-period comparisons.
Frequently Asked Questions: Florida Canyon Gold Recovery Rate
What is the Florida Canyon gold recovery rate?
The Florida Canyon gold recovery rate operates as a blended figure combining two distinct processing pathways. In recent quarters it has ranged from approximately 57.8% to 60.1%, with variation driven by the proportion of ore crushed before leach pad placement versus placed directly as ROM material. The June 2026 feasibility study uses 57% as the life-of-mine blended planning assumption.
Why does recovery change from quarter to quarter?
Quarterly recovery fluctuations reflect changes in the crushed ore to ROM ratio on the leach pads. Crushed ore recovers gold in the low-to-mid 60% range; ROM ore recovers gold in the high-40% to low-50% range. Any quarter where ROM placement increases relative to crushed ore will produce a lower blended recovery regardless of ore grade or mining volume.
Why did the Q2 2026 recovery rate decline despite record output?
ROM placement more than doubled from 1,074,000 tonnes in Q1 2026 to 2,332,000 tonnes in Q2 2026, whilst crushed ore placement remained essentially flat at around 1,824,000 tonnes. The shift in processing mix toward direct ROM placement pulled the blended recovery from 59.9% down to 57.8%, even as total ore mined, grade, and mining rate all improved.
Is 57% the maximum achievable life-of-mine recovery?
No. The 57% life-of-mine assumption in the feasibility study reflects current crusher capacity constraints and represents a conservative planning floor. Quarterly results have already exceeded this figure in crushed-ore-weighted periods. A crusher expansion study is underway to evaluate whether the blended recovery rate can be structurally improved beyond the base-plan assumption.
What are Florida Canyon's all-in sustaining costs?
Mine-site AISC guidance for 2026 is US$3,300 to US$3,500 per ounce, the peak cost year of the plan due to an intensive waste-stripping campaign and fleet replacement programme. The life-of-mine average AISC is projected at US$2,331 per ounce against a base-case gold price of US$3,873 per ounce across the plan period.
What is the crusher expansion study examining?
The study is evaluating whether additional crushing capacity beyond currently installed limits could be incorporated into the mine plan, with the goal of shifting the long-run processing mix toward a higher proportion of crushed ore. Any improvement in the blended recovery rate resulting from expanded crusher utilisation would represent upside to the feasibility study's production and cost projections. The US gold market premium environment further strengthens the case for maximising recovered ounces through such operational enhancements.
Recovery Rate as a Dynamic Operational Variable With Embedded Upside
The Florida Canyon gold recovery rate is best understood as a controllable process output rather than a fixed property of the ore body. The 57% life-of-mine planning assumption in the June 2026 feasibility study is a capacity-constrained baseline, not a geological ceiling. Quarterly performance has already demonstrated that the operation can exceed this figure when processing decisions favour the crusher.
The gap between ROM recovery (high-40% to low-50%) and crushed ore recovery (low-to-mid 60%) defines the improvement potential available through processing mix optimisation alone, without requiring new ore discovery, capital-intensive processing changes, or favourable geological luck. That gap is a management decision.
For those evaluating the long-term economics of the Florida Canyon operation, the recovery rate trajectory through 2027 to 2029 will be among the most informative indicators of whether the post-stripping phase delivers on its margin improvement promise. A mine plan that embeds 57% but operates consistently at 59% to 60% through the higher-grade Central pit years would produce meaningfully more ounces at lower per-unit cost than the feasibility study projects.
Investment-relevant takeaway: The crusher expansion study represents the primary structural mechanism for improving the blended recovery rate above feasibility study assumptions. Combined with the post-stripping grade and strip ratio improvements planned for 2027 to 2029, recovery optimisation is the multiplier variable that could amplify the mine plan's already favourable economics. The 2024 technical report's cumulative recovery figure of 55.1% through end-2023, compared with the 58.7% cumulative figure through April 2026, already evidences that the operation is tracking above its own historical baseline.
This article is for informational purposes only and does not constitute financial or investment advice. Mining operations involve significant operational, geological, and financial risks. Forecasts, guidance figures, and feasibility study assumptions are subject to change and may not be achieved. Readers should conduct their own due diligence before making investment decisions.
Want to Catch the Next Major ASX Gold Discovery Before the Market Does?
Discovery Alert's proprietary Discovery IQ model scans ASX announcements in real time, instantly identifying significant mineral discoveries — including high-potential gold opportunities — and delivering actionable insights directly to subscribers ahead of the broader market. Explore historic examples of exceptional discovery returns and begin your 14-day free trial today to position yourself at the forefront of the next major find.