
August 6, 2026
Why the Gold Price Could Triple If the 1970s Bull Market Pattern Holds
Monetary history has a long memory, even when markets do not. Every few decades, the architecture of the global financial system reaches a stress point where the structural foundations of currency confidence begin to fracture visibly. When that happens, gold does not simply rise — it reprices. Not incrementally, but in moves that reshape generational wealth allocations. Understanding whether the gold price could triple if the 1970s bull market pattern holds requires stepping back from daily price charts and examining the deeper machinery of monetary cycles, behavioural finance, and macro regime transitions.
When big ASX news breaks, our subscribers know first
The Forgotten Architecture of Cycle-Based Price Forecasting
Most financial commentary treats historical cycle analogies with suspicion, dismissing them as pattern-matching dressed up as analysis. Yet this dismissal misses something important: gold does not trade on earnings, dividends, or cash flow multiples. Its price is determined by a fundamentally different set of inputs — real interest rates, monetary system credibility, geopolitical risk intensity, and the perceived sustainability of sovereign fiscal positions.
When those inputs converge across two distinct historical periods, the price trajectories that emerge from them tend to share structural characteristics. This is not coincidence — it is the same economic physics producing the same gravitational effects.
What a 95% Correlation Coefficient Actually Signals
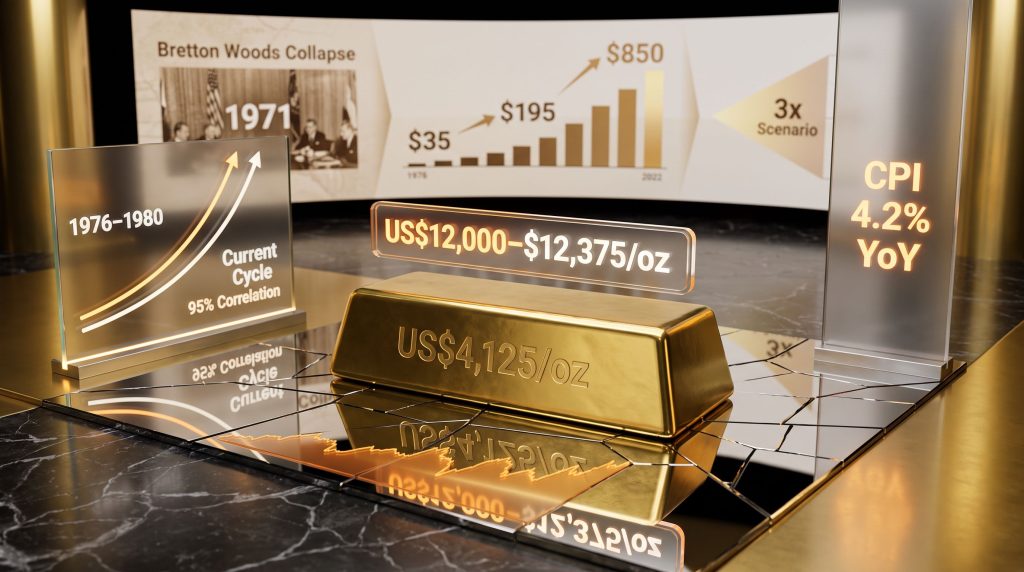
A correlation coefficient of 95% between two separate gold bull market sequences is a statistically exceptional finding. According to analysis published by Jeff Clark of The Gold Advisor, the current gold bull market is tracking the 1976–1980 phase of the 1970s cycle with this level of precision — a near-identical alignment across trajectory shape, percentage move, correction depth, and duration.
To be clear about what this means analytically:
- A 95% correlation does not guarantee future price outcomes
- It establishes that the underlying macro architecture of both periods shares near-identical structural conditions
- It is a quantitative analog model comparing two distinct time windows — not a subjective chart overlay
- The practical implication is a probabilistic framework, not a deterministic forecast
Analytical Note: Analog-based scenario modelling is used in serious macro research precisely because it captures structural similarities that fundamental models sometimes miss. A 95% correlation is a high-confidence signal of shared conditions — but readers should treat it as defining a probability range, not a price guarantee.
Anatomy of the 1970s Gold Bull Market
To understand what the analog implies for today, it is necessary to understand what actually drove the 1970s cycle — not just the price outcome, but the structural mechanics beneath it.
From Bretton Woods to Free-Float: The Monetary Trigger
Prior to August 1971, gold was fixed at approximately US$35 per ounce under the Bretton Woods international monetary framework. The end of the gold standard occurred when President Nixon suspended dollar-gold convertibility, transitioning gold overnight from a pegged instrument to a free-floating monetary asset. The price ceiling that had suppressed gold for decades was removed in a single policy decision.
What followed was one of the most dramatic repricing events in monetary history:
| Phase | Approximate Period | Price Action | Gain/Loss |
|---|---|---|---|
| Initial Surge | 1971–1974 | US$35 → ~US$195 | +457% |
| Mid-Cycle Correction | 1974–1976 | ~US$195 → ~US$100 | -49% |
| Final Acceleration | 1976–1980 | ~US$100 → ~US$850 | +750% |
| Full Cycle Total | 1971–1980 | US$35 → ~US$850 | ~+2,300% |
The detail most investors overlook is the brutal 1974–1976 correction. Nearly half the prior gains were erased over approximately 24 months. Investors who interpreted that drawdown as cycle termination missed the most explosive phase of the entire secular advance — a 750%+ move from the 1976 low to the January 1980 peak of approximately US$850 per ounce.
The Macro Drivers That Powered the Decade
The 1970s gold advance was not a speculative anomaly. It was the logical output of a specific macro environment:
- Monetary regime change: Removal of the dollar-gold peg eliminated the price ceiling
- Persistent energy-driven inflation: The 1973 oil embargo and subsequent supply shocks created stagflation — a condition where both inflation and unemployment rose simultaneously
- Sustained negative real interest rates: The Federal Reserve repeatedly failed to match nominal rates to inflation, making cash and bonds inferior stores of value
- Geopolitical instability: Multiple international crises elevated safe-haven demand across the decade
- Deteriorating sovereign fiscal positions: Rising US government deficits progressively eroded confidence in fiscal sustainability
Mapping Today's Gold Market Against the 1976–1980 Template
This is where the analysis becomes directly relevant to current positioning decisions. Furthermore, the gold and bonds dynamics of the current environment closely mirror those of the late 1970s. The current gold bull market reached an all-time high of approximately US$5,600 per ounce in January 2026. Since that peak, prices have declined approximately 21%, with spot gold trading near US$4,125 per ounce at the time of writing — and the metal has recently broken below its 200-day moving average, a threshold that historically attracts additional near-term selling pressure.
Current Correction in Historical Context
The instinctive reaction to a 21% drawdown is concern. However, the analytical response is to contextualise it within the broader pattern of prior gold bear phases:
| Correction Event | Peak-to-Trough Decline | Duration | Subsequent Outcome |
|---|---|---|---|
| 2008 Global Financial Crisis | ~30% | ~8 months | Full recovery + new all-time highs |
| 2020 Pandemic Shock | ~28% | ~3 months | Full recovery + new all-time highs |
| Current Correction (2026) | ~21% (ongoing) | Ongoing | Undetermined |
| 1974–1976 Mid-Cycle (1970s analog) | ~49% | ~24 months | Led to 750%+ final advance |
The current drawdown is structurally shallower than either of the two most recent major corrections in this cycle. If the 1970s analog continues to hold, the depth of this correction may function as a necessary precondition for the next advance, not evidence against it.
The Duration Argument: Why Brevity Matters
One of the more compelling analytical points in the bull case is the duration argument. Clark's analysis notes that if the current gold bull market were to terminate at its present juncture, it would represent the shortest secular gold bull market in modern recorded history. Every prior documented gold advance has run for a longer period before exhausting its structural drivers.
Based on historical averages across prior gold cycles, the current advance is assessed to have a minimum of approximately two additional years of structural runway. Duration analysis provides a probabilistic floor for the secular trend that operates independently of near-term price volatility.
Could Gold Actually Triple? Scenario Modelling the Path Forward
If the current bull market continues to track the 1976–1980 phase at a 95% correlation, the implied price trajectory would require approximately a three-times multiple from current levels. Applied to a spot price of approximately US$4,125 per ounce, that produces an implied scenario target in the range of US$12,000–US$12,375 per ounce.
More conservative interpretations of the same analog have cited end-of-cycle targets in the US$6,000+ range. Both figures represent scenario projections, not consensus forecasts. For context, gold's historic $3,000 milestone earlier in this cycle was itself considered an ambitious target by many analysts at the time.
Three Forward Scenarios
Scenario A: Full 1970s Analog Continuation (Bull Case)
The macro environment continues to rhyme with the 1970s: persistent inflation, deteriorating fiscal positions, and monetary policy constraints prevent sustained rate increases. The current correction resolves within 6–12 months, followed by re-acceleration. Gold approaches the 3x implied target.
Scenario B: Partial Analog — Truncated Advance (Base Case)
The secular bull market continues but does not fully replicate the terminal magnitude of the 1970s. Gold recovers to new all-time highs above US$5,600 per ounce but falls materially short of the tripling scenario.
Scenario C: Secular Trend Exhaustion (Bear Case)
The current correction marks the end of the secular uptrend — an outcome that would be without modern historical precedent in its brevity. Gold stabilises at lower levels as real interest rates rise durably and monetary confidence recovers.
The Structural Macro Case: Why the Bull Thesis Refuses to Collapse
Every Currency Is Now Fiat — An Unprecedented Monetary Reality
One of the most underappreciated structural facts underpinning the gold bull case is also the most straightforward: for the first time in recorded monetary history, every sovereign currency on earth operates as a fiat instrument with no commodity anchor whatsoever. There is no gold standard, no silver backing, and no commodity convertibility anywhere in the global system.
Clark has stated publicly that this condition is one of the primary reasons he maintains long gold exposure regardless of short-term price behaviour — the structural argument for gold as a monetary alternative has never been stronger from a systemic perspective.
The Federal Reserve's Trilemma
The current macro environment places the Federal Reserve in a structurally difficult position. Headline CPI rose 4.2% year-over-year in May 2026, accelerating from 3.8% in April. Core CPI (excluding food and energy) rose 2.9% annually, remaining above the Fed's 2% target.
At the same time, the Fed faces three competing pressures simultaneously:
- Inflation control: Requires higher interest rates to suppress price growth
- Debt servicing capacity: Higher rates increase the cost of rolling over existing federal debt, creating a fiscal feedback loop that limits the duration of tightening
- Economic growth: Higher rates increase recession risk in an economy already under pressure from energy price disruption caused by ongoing Middle East conflict
The analytical implication, as Clark has articulated, is counterintuitive: if economic conditions deteriorate significantly, the Fed's most probable policy response is rate reduction, not continued tightening. Historically, declining real interest rates have been among the most powerful catalysts for gold appreciation — a relationship that the gold safe-haven dynamics of prior cycles consistently demonstrate.
Clark's assessment is that markets are overweighting inflation as a near-term headwind for gold while underweighting the structural argument that a deteriorating economy would compel monetary easing rather than continued tightening — the precise condition that has historically driven gold's strongest advances.
Energy Market Disruption as an Inflationary Amplifier
Ongoing geopolitical conflict has materially disrupted global energy supply chains, pushing oil prices significantly higher and feeding directly into headline CPI. This dynamic is one of the strongest structural parallels to the 1970s environment, where energy price inflation proved to be both durable and politically intractable.
The challenge for monetary policymakers is that energy-driven inflation does not respond efficiently to interest rate increases — rate hikes reduce demand but cannot resolve supply-side disruptions. This structural limitation on the effectiveness of monetary tightening creates conditions where the Fed may be compelled to tolerate higher inflation rather than inflict sufficient demand destruction to eliminate it.
The next major ASX story will hit our subscribers first
The Psychology of Corrections: Why Investors Consistently Get It Wrong
Recency Bias and the Cost of Selling Structural Bull Markets
Behavioural finance research consistently demonstrates that investors systematically over-weight recent negative price action when assessing long-term trend validity. During the 1974–1976 correction — the closest historical analog to the current environment — selling pressure was intense precisely because the prior advance had been so strong. Investors who extrapolated the correction forward missed the 750%+ advance from the 1976 low to the 1980 peak.
The counterintuitive insight from cycle history is that maximum near-term uncertainty has repeatedly coincided with the most attractive entry points for long-term returns in secular gold bull markets.
Why a 21% Drawdown Does Not Signal Trend Reversal
The key analytical question during any correction is not how far the price has fallen, but whether the structural drivers of the bull market have changed. In addition, central bank influence on gold has remained persistently bullish, with institutions continuing to accumulate rather than divest. Assessing the current environment against that standard:
- Has the all-fiat monetary system been reformed? No.
- Has sovereign debt declined globally? No.
- Have real interest rates sustainably turned positive? Not conclusively.
- Has geopolitical risk materially reduced? No.
- Has inflation been permanently resolved? No.
If none of the structural drivers have reversed, the correct analytical framework treats the correction as a cyclical interruption within a secular advance — consistent with every prior major gold bull market.
Key Risks That Could Derail the Triple Scenario
Intellectual honesty requires acknowledging the variables capable of falsifying the bull case:
- Rapid, credible inflation resolution: If CPI decelerates sharply and real rates turn sustainably positive, gold's inflation hedge premium diminishes materially
- Meaningful fiscal consolidation: A credible reduction in sovereign debt trajectories would weaken one of gold's most durable long-term tailwinds
- Analog divergence: The 95% correlation is backward-looking — modern gold markets include ETF flows, algorithmic trading, and central bank coordination mechanisms that did not exist in the 1970s, potentially altering the magnitude of price outcomes even if directional tendencies persist
- Pattern termination: Historical analogies define probability ranges, not certainties — any significant divergence in macro conditions from the 1970s template reduces the model's predictive reliability
FAQ: Gold Price Tripling and the 1970s Pattern
What price would a tripling imply from current levels?
At a spot price of approximately US$4,125 per ounce, a three-times multiple would imply a scenario target in the range of US$12,000–US$12,375 per ounce. This is derived by applying the proportional magnitude of the 1976–1980 final advance to the current price level.
How reliable is a 95% correlation between two gold bull markets?
It is a statistically significant alignment indicating near-identical trajectory shapes. It is best interpreted as evidence that similar macro conditions are producing similar price dynamics — not as a deterministic forecast.
What would end the current secular bull market prematurely?
A rapid and credible resolution of inflation combined with sustained positive real interest rates and meaningful fiscal consolidation represents the most likely combination capable of ending the structural uptrend.
Is the tripling scenario a mainstream forecast?
No. It is a scenario-based projection derived from historical analog analysis. Furthermore, the gold and bonds dynamics of the current environment suggest the structural bull case remains intact even if the tripling magnitude is not fully realised. It represents a bull-case outcome if current macro conditions continue to track the 1970s pattern and should not be interpreted as a consensus estimate.
Structural Variable Comparison: 1970s vs. Today
| Structural Variable | 1970s Environment | Current Environment | Analog Strength |
|---|---|---|---|
| Monetary regime | Post-Bretton Woods fiat transition | All-fiat global system (no commodity anchor) | Very Strong |
| Inflation trajectory | Persistent, energy-driven stagflation | Re-accelerating (CPI 4.2% YoY, May 2026) | Strong |
| Real interest rates | Frequently negative | Contested; constrained by debt servicing | Moderate |
| Geopolitical risk | Cold War + oil embargo | Middle East conflict + energy disruption | Strong |
| Sovereign fiscal stress | Rising US deficits | Elevated global debt levels | Strong |
| Mid-cycle correction depth | ~49% (1974–1976) | ~21% (2026, ongoing) | Partial |
The weight of structural evidence continues to support the secular bull thesis. Whether the gold price could triple if the 1970s bull market pattern holds depends on the durability of macro conditions that have, to date, shown no signs of fundamental reversal.
Risk Disclosure: Historical price patterns, cycle analogies, and scenario projections are analytical tools only. They do not constitute investment advice. Past performance of any asset class does not guarantee future results. All scenario-based price targets carry material uncertainty and should not be relied upon as the basis for individual investment decisions. Readers should consult a qualified financial adviser before making any investment.
For ongoing analysis of gold, silver, and mining sector developments, readers can explore additional market commentary and educational resources at The Gold Advisor.
Could the Next Major Gold Discovery Deliver Even Greater Returns Than the Metal Itself?
While the macro case for gold's continued advance remains compelling, savvy investors know that junior mining and exploration stocks have historically amplified gold's gains many times over — and Discovery Alert's proprietary Discovery IQ model delivers real-time ASX alerts the moment a significant mineral discovery is announced, ensuring subscribers are positioned ahead of the broader market. Explore historic discovery returns on Discovery Alert's dedicated discoveries page and begin your 14-day free trial today to secure your market-leading advantage.