June 8, 2026
Why Cycle Timing Has Become the Missing Layer in Gold Market Analysis
Most commodity investors approach gold through a familiar lens: inflation expectations, central bank policy, geopolitical risk premiums, and currency dynamics. These fundamental drivers are real and measurable, but they share a critical blind spot. They tell you why gold should move, but rarely when. That timing gap is precisely where multi-timeframe cycle analysis enters as a genuinely complementary discipline, one that maps recurring rhythmic patterns in price data across short, intermediate, and primary wave structures simultaneously.
The methodology draws heavily from the foundational work of J.M. Hurst, whose research into the cyclic nature of financial markets established that price action across virtually all liquid markets reflects nested, overlapping wave structures of varying periodicity. When these cycles align, their combined force amplifies price movement. When they diverge, countertrend corrections emerge. Understanding this layering is essential context for interpreting the current gold cycle and U.S. stocks update for mid-2026.
Framework Note: Cycle-based technical analysis does not replace fundamental research. It adds a temporal dimension, helping investors understand not just directional bias but the likely timing of inflection points. When cycle projections align with institutional macro forecasts, the resulting convergence creates high-probability strategic windows.
When big ASX news breaks, our subscribers know first
Understanding Multi-Timeframe Cycle Analysis in Precious Metals
The Architecture of Nested Cycles
Cycle analysis in gold operates across several timeframe layers simultaneously. The smallest tracked wave in current gold analysis runs on approximately a 10-trading-day rhythm. Above that sits an intermediate 34-day cycle, and above that a primary 72-day wave. These are not isolated signals. They are nested within each other, with smaller cycles completing multiple rotations within each larger cycle phase.
The key terminology matters for interpreting what follows:
- Cycle trough: The low point where a downward phase exhausts and a new upward phase begins
- Upward phase: The portion of a cycle where price tends to rise, lasting roughly half the cycle's total duration
- Downward phase: The corrective portion where price tends to decline or consolidate
- Countertrend correction: A pullback occurring within a larger upward phase, expected to be temporary before the dominant trend resumes
- Bearish divergence: When price fails to confirm upward momentum during a designated upward phase, signalling potential cycle reversal
One of the lesser-appreciated aspects of Hurst-based cycle analysis is the concept of cycle right translation versus left translation. When a cycle peaks in the latter portion of its upward phase (right-translated), it signals underlying bullish momentum. When it peaks early (left-translated), it warns of bearish dominance. This translation concept adds a layer of directional probability beyond simple timing, and it is directly relevant to interpreting gold's current intermediate cycle behaviour.
Gold Cycle and U.S. Stocks Update: The Near-Term Cyclical Picture
The 10-Day Wave: Approaching a Trough
As of mid-May 2026, the shortest tracked wave in gold had advanced 9 trading days into its downward phase, placing it at the extreme outer edge of its typical bottoming window. In cycle analysis terms, this is a high-probability trough zone. Once the downward phase of this wave exhausts, the standard minimum expectation is a recovery rally back toward the 10-day moving average, which functions as a natural gravitational target for price following a short-cycle low.
The subsequent trough for this same 10-day wave is projected to form in the late-May to early-June 2026 window. This creates a rhythm of short-cycle lows spaced roughly two weeks apart through late spring, each punctuating the larger consolidation pattern.
The 34-Day Cycle: A Critical Warning Signal
The intermediate 34-day cycle is where the most analytically significant warning currently resides. This wave had recently entered its designated upward phase, but the expected price follow-through failed to materialise. In cycle framework terms, this absence of upside momentum during an upward phase is a technically meaningful warning, suggesting the wave may be left-translating rather than generating the rightward peak expected in a healthy bull cycle phase.
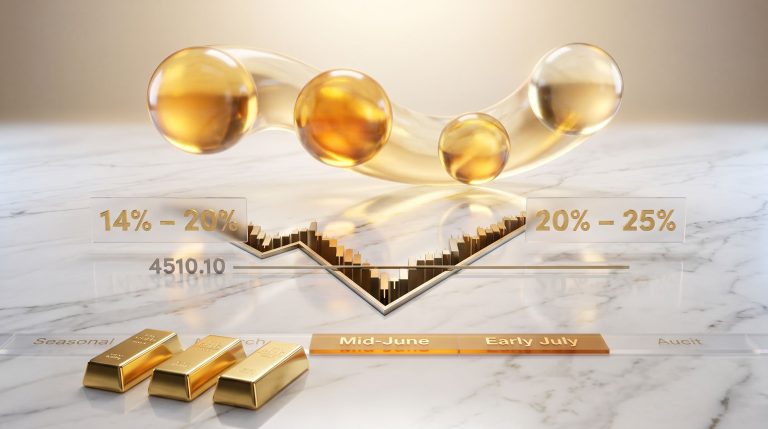
The key price level to monitor is $4,510.10, representing the swing low on the June 2026 gold futures contract. A sustained break below this threshold would confirm that the 34-day cycle has reversed back into its downward phase, opening the door to additional weakness extending into June 2026.
Risk Marker: The failure of an intermediate cycle to generate upward momentum during its designated upward phase is historically one of the more reliable warning patterns in cycle-based analysis. It does not automatically confirm further weakness, but it elevates the probability meaningfully when accompanied by a subsequent break of the prior swing low.
Seasonal Confluence: June's Structural Weakness in Gold
Gold's established seasonal pattern shows a historically soft period from late May through mid-July. This is not a coincidental alignment with the current cycle picture. The seasonal tendency and the projected downward pressure from the 34-day and 10-day cycles reinforce each other, creating a confluence of headwinds for the metal through June. Seasonal patterns should always be treated as a supporting factor rather than a primary signal, but when they align with cycle timing, they increase confidence in the directional call.
| Cycle | Duration | Current Phase | Key Threshold | Next Projected Trough |
|---|---|---|---|---|
| Short-Duration Wave | ~10 trading days | Downward phase at limit | 10-day MA on recovery | Early-to-mid May 2026 |
| Intermediate Wave | ~34 trading days | Upward phase, no follow-through | $4,510.10 swing low | Potential June 2026 reversal |
| Primary Wave | ~72 trading days | Broader consolidation | Prior swing structure | Mid-to-late July 2026 |
The Larger Gold Cycle Structure and the 2026 Outlook
The 72-Day Primary Cycle: Reading the Blow-Off Top Aftermath
Gold experienced what technical analysts classify as a blow-off top in late January 2026. This is a specific price pattern characterised by a sharp, climactic surge in price accompanied by elevated volume and sentiment extremes, followed by an equally abrupt reversal and exhaustion. Blow-off tops are significant because the corrective consolidation that follows tends to be extended, as the market digests the overextension before establishing a new base.
Since that late-January peak, price action has shifted into a broader sideways-to-lower consolidation, consistent with the historical behaviour of the 72-day primary cycle following major price extremes. The projected trough for this primary wave is the mid-to-late July 2026 window. Until that low forms, the consolidation may persist, with short-cycle bounces failing to generate sustained breakouts.
Post-Trough Projections: The September Rally and Beyond
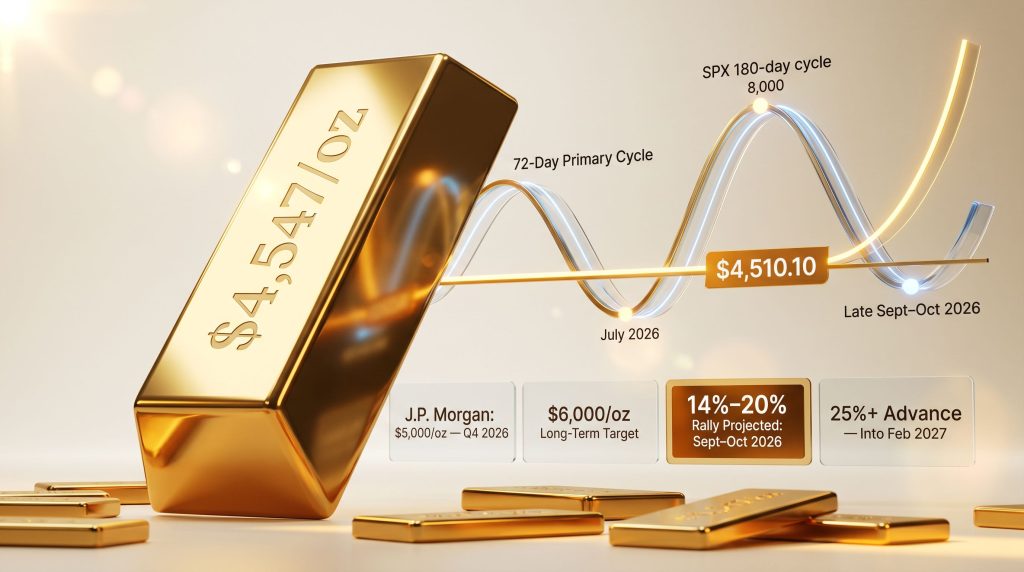
The strategic significance of the July 2026 trough extends well beyond the near term. Cycle analysis projects that from whatever low forms at that trough, a 14% to 20% rally is the expected minimum magnitude, targeting a peak window in the September to October 2026 timeframe. This would be the primary upward phase of the next 72-day cycle.
Following that autumn rally, the next 72-day trough is projected around early November 2026. From that November low, the projected advance is substantially larger, estimated at 25% or more, targeting the February 2027 window. This two-leg structure, a moderate September rally followed by a larger winter advance, forms the backbone of the bullish medium-term cycle roadmap.
What makes this projection particularly noteworthy is its directional alignment with institutional research. The gold price forecast from major financial institutions, including J.P. Morgan, suggests gold could approach $5,000 per ounce by Q4 2026, with longer-term scenario analysis targeting $6,000/oz. State Street Global Advisors has characterised 2025-26 as part of a structural bull cycle for gold, noting that 2025 represented the metal's strongest annual performance since 1979. With gold trading near $4,547/oz as of mid-May 2026, approximately 42% higher year-over-year according to Trading Economics data, the cycle-based rally targets for late 2026 and early 2027 overlap meaningfully with these institutional price scenarios.
Structural Context: The current consolidation phase in gold, while frustrating for short-term holders, is structurally consistent with base-building behaviour that precedes major cyclical advances. The 72-day trough in July represents the technical launching point that cycle analysis identifies as the precursor to the next significant leg higher.
Macro Forces Reinforcing Gold's Cyclical Uptrend
Central Bank Demand: The Floor That Sustains Corrections
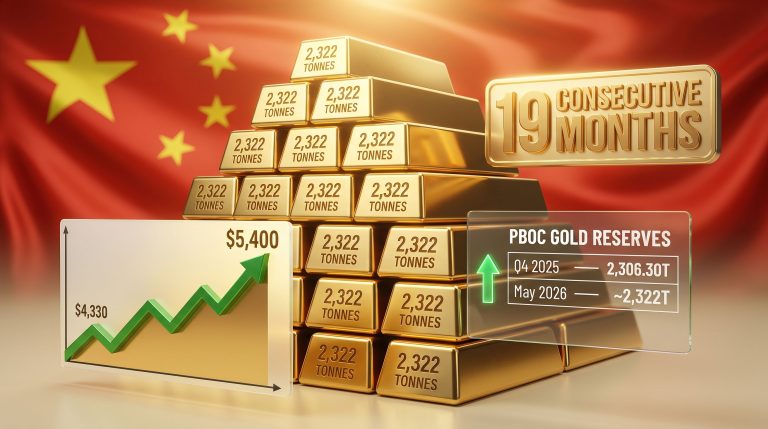
One of the most consequential structural shifts in the gold market over recent years has been the sustained elevation of official sector purchasing. Central bank gold demand across emerging market economies in particular has accelerated as part of broader reserve diversification strategies, reducing reliance on U.S. dollar-denominated assets. This persistent demand creates a structural floor during cyclical correction phases, effectively compressing drawdowns that might otherwise be more severe.
What is less commonly appreciated is the compounding effect of central bank accumulation. Each tonne acquired by official sector buyers removes physical supply from the market on a semi-permanent basis. Unlike speculative positions, central bank holdings are rarely liquidated on short timeframes, meaning the structural demand floor strengthens cumulatively over time. J.P. Morgan expects this institutional and official sector demand to remain robust through 2026 and beyond.
The Fed Policy Dilemma and Real Yield Asymmetry
Stronger-than-expected U.S. inflation data in mid-May 2026 created temporary pressure on gold by reinforcing expectations of a higher-for-longer interest rate environment. The inverse relationship between real yields (inflation-adjusted bond returns) and gold is well-established: rising real yields increase the opportunity cost of holding a non-yielding asset. However, this dynamic creates an asymmetric setup for gold investors.
If the Fed begins an easing cycle, falling real yields act as a powerful and direct tailwind for gold prices. If inflation remains sticky and the Fed holds rates elevated, gold's role as an inflation hedge gains relevance and the eventual policy pivot becomes a larger catalyst. In either scenario, gold retains meaningful upside optionality, which is a key reason institutional allocators are maintaining or increasing exposure despite near-term rate uncertainty.
Portfolio Diversification Breakdown: Why Gold Is Being Re-Rated
The traditional 60/40 portfolio construction model, long the cornerstone of institutional asset allocation, has been significantly challenged by the unusually elevated correlation between U.S. equities and bonds. When both assets decline simultaneously during risk-off episodes, the diversification benefit disappears precisely when it is most needed.
Furthermore, the gold-stock market relationship has evolved considerably in recent cycles, with gold demonstrating a notably lower correlation profile relative to equities compared to bonds. Its historical tendency to rally during equity stress events makes it an increasingly valued portfolio component. This re-rating of gold within institutional frameworks represents a demand driver that extends beyond traditional retail investment sentiment.
The U.S. Stock Market Cycle: Where SPX Stands in Mid-2026
The 180-Day Primary Cycle: Structural Uptrend Intact
The S&P 500 carved out a significant low in late March 2026, which cycle analysis identified as the bottom of the primary 180-day cycle in U.S. equities. From that trough, the upward phase of this larger cycle is projected to remain in force through the late-July to mid-August 2026 window. Within that upward phase, recent price action has raised the prospect of a rally extension toward the 8,000 level on the SPX, representing the next major round-number resistance zone.
Round-number price levels carry particular significance in cycle analysis because they tend to act as magnetic targets for blow-off moves during the final stages of large cycle upward phases. The late-July to mid-August window is where the next significant swing top is expected to form from this 180-day wave.
The 45-Day Countertrend Cycle: Sharp but Temporary Pullback Expected
Nested within the 180-day structure is a shorter 45-day cycle, and it is this wave that generates the near-term complication for equity bulls. Key technical divergences were observed at the most recent SPX swing high, consistent with the upward phase of the 45-day wave having peaked in the May 7-15, 2026 window.
The next trough for this 45-day cycle is projected for late May to early June 2026, implying a sharp but countertrend pullback in the weeks ahead. The critical distinction here is the word countertrend. Because this correction occurs within the larger 180-day upward phase, it is classified as a temporary interruption rather than a primary trend reversal. Following the 45-day trough, the expectation is for higher highs into the late-July to mid-August window.
| Phase | Timeframe | Expected Market Action |
|---|---|---|
| 45-Day Cycle Trough | Late May to Early June 2026 | Sharp countertrend pullback |
| 180-Day Cycle Peak | Late July to Mid-August 2026 | Major swing top, potential SPX 8,000 test |
| 180-Day Cycle Decline | August to Late September 2026 | Sharp decline from summer peak |
| 180-Day Cycle Trough | Late September to Mid-October 2026 | Next primary cycle low |
The next major ASX story will hit our subscribers first
The Gold and Equity Convergence: A Strategic Inflection Point Approaching
The May-June Divergence Window
The overlap between the projected late-May to early-June SPX correction and the expected bottoming of gold's short and intermediate cycles creates a potentially important divergence window. During this period, gold may stabilise or begin recovering while equities experience their 45-day countertrend pullback. Historically, this type of divergence attracts capital rotation from equities into safe-haven assets, amplifying gold's recovery from its short-cycle troughs.
The Late-Summer Convergence Risk
The more strategically significant convergence point is the late-July to mid-August window, when the gold 72-day cycle trough and the SPX 180-day cycle peak are both projected to occur within a similar timeframe. This represents a potential high-volatility inflection: gold potentially completing its consolidation phase and initiating a major rally, while equities are forming what could be a significant medium-term top before a sharp autumn decline.
For portfolio managers, this convergence creates a textbook scenario for rebalancing, trimming equity exposure near the summer peak while establishing or adding to gold positions near the July trough. Examining gold in recession periods further reinforces the rationale for this kind of rotation, given gold's historically strong performance during equity market stress events.
Three Macro Scenarios for Gold Versus Equities Through Late 2026
| Macro Scenario | Gold Implication | SPX Implication |
|---|---|---|
| Fed begins easing cycle | Strong tailwind; real yields decline | Short-term positive; valuation support |
| Inflation stays elevated | Bull cycle delayed but not reversed | Higher-for-longer pressure on multiples |
| Geopolitical or risk-off shock | Safe-haven demand surge | Accelerates 180-day cycle decline |
Frequently Asked Questions: Gold Cycle and U.S. Stocks Update
What is cycle analysis and why does it matter for gold forecasting?
Cycle analysis identifies repeating rhythmic patterns in price data across multiple timeframes simultaneously. Rather than asking why prices will move, it asks when by mapping the typical duration and phase of wave structures. In gold, this methodology helps investors distinguish between temporary corrections within larger bull phases and more meaningful cyclical tops. When applied alongside fundamental analysis, it provides a timing layer that significantly improves strategic decision-making.
What is the key price level for gold right now?
The critical technical threshold is $4,510.10 on the June 2026 gold futures contract. This represents the prior swing low for the intermediate 34-day cycle. A sustained break below this level would confirm that the intermediate cycle has reversed to the downside, increasing the probability of continued weakness through June 2026 and toward the primary 72-day trough expected in mid-to-late July. In addition, monitoring the gold-silver ratio insights can provide a useful secondary confirmation signal during these cycle transitions.
Is the current gold pullback a buying opportunity?
Cycle analysis points to the mid-to-late July 2026 primary cycle trough as the most strategically significant accumulation window. The projected 14% to 20% rally from that trough into September-October, followed by an even larger estimated advance of 25% or more from the November trough toward February 2027, positions this period as a structurally important entry point for long-term investors. Near-term buying ahead of the July trough carries the risk of catching additional weakness before the low forms. For a broader view of gold's market cycle patterns, the technical signals currently support patience over urgency.
What is the SPX outlook for the second half of 2026?
The 180-day primary cycle projects a major swing top forming in the late-July to mid-August 2026 window, potentially near SPX 8,000. Following that peak, a sharp decline into a late-September to mid-October trough is anticipated. Before that summer peak forms, a countertrend 45-day cycle correction is expected in late May to early June, representing a temporary but potentially sharp pullback within the larger uptrend.
Why are institutional investors increasing gold allocations in 2026?
Three interlocking forces are driving institutional re-rating of gold: the sustained elevation of central bank purchases creating a structural demand floor; the breakdown of traditional stock-bond diversification, making gold a preferred portfolio hedge; and the asymmetric policy setup where both Fed easing and persistent inflation create upside scenarios for the metal.
Key Takeaways for the Gold Cycle and U.S. Stocks Update Through Late 2026
- Near-term (May to June 2026): Gold faces cyclical headwinds from both the 10-day and potentially the 34-day downward phases; the critical level to watch is $4,510.10 on June futures; equities face a sharp 45-day cycle countertrend correction
- Mid-year (July to August 2026): The most important strategic inflection point of the year; gold's 72-day trough and the SPX's 180-day cycle peak are projected to converge, creating a major portfolio rebalancing opportunity
- Autumn 2026 (September to October): Gold targets a 14% to 20% rally from the July trough; equities face a sharp decline from the summer peak into a late-September to mid-October low
- Into early 2027: A 25%-plus gold advance is projected from the November 2026 trough toward February 2027, aligning directionally with J.P. Morgan's longer-term $5,000 to $6,000/oz price thesis
Strategic Takeaway: The coherence between cycle-based timing projections and institutional macro forecasts for gold creates an unusually aligned picture for the second half of 2026 and into 2027. The current consolidation phase, while testing for short-term holders, appears structurally consistent with the base-building behaviour that cycle analysis consistently identifies as a precursor to major cyclical advances.
This article is for informational and educational purposes only and does not constitute financial advice. Cycle-based projections involve inherent uncertainty and should not be interpreted as guarantees of future price outcomes. Past cycle behaviour does not ensure future results. Readers should conduct their own research and consult a qualified financial adviser before making investment decisions.
Want to Identify the Next Major ASX Mineral Discovery Before the Broader Market?
Discovery Alert's proprietary Discovery IQ model delivers real-time alerts on significant ASX mineral discoveries, instantly translating complex mineral data into actionable investment insights for both short-term traders and long-term investors — explore historic discoveries and their returns to understand the magnitude of opportunity, then begin your 14-day free trial at Discovery Alert to position yourself ahead of the market.