July 30, 2026
Why Bull Markets Have Always Contained Their Most Convincing Exit Points
Every major bull market in recorded financial history has generated at least one correction severe enough to feel like a reversal. Gold is no exception. In fact, the precious metal has a documented history of producing drawdowns that appear catastrophic on the surface while leaving the underlying monetary thesis entirely intact beneath it.
Understanding the gold drawdown compared to 2008 and COVID is not an exercise in reassurance. It is a diagnostic exercise. The question worth asking is not how far the price has moved, but whether the architecture of the bull market has structurally changed. When examined through that lens, the current environment and the two prior major drawdowns begin to look remarkably similar, particularly when you consider gold's safe-haven role throughout each crisis period.
When big ASX news breaks, our subscribers know first
The Two-Phase Mechanism That Explains Every Gold Selloff During a Crisis
Gold occupies a unique position in the financial system. It functions simultaneously as a long-term monetary reserve asset and as one of the most liquid instruments available for immediate sale. This dual identity creates a paradox during acute market stress: the very feature that makes gold valuable over time (deep global liquidity) is also the reason it gets sold first when institutions need to raise cash quickly.
When margin calls cascade across asset classes, portfolio managers do not sell their least liquid holdings. They sell what they can. Gold, with its globally recognised price and around-the-clock market access, sits near the top of that list. The result is a mechanical selloff that has nothing to do with a fundamental reassessment of gold's role as a monetary asset.
A falling gold price during a crisis does not mean gold has failed. It means the liquidity crunch phase is active and the monetary response phase has not yet begun. Both the 2008 and 2020 events followed this exact two-phase sequence.
The second phase begins when central banks and monetary authorities respond to the crisis with liquidity measures. Historically, this monetary response phase is when gold decouples from equities and resumes its structural trajectory. Recognising which phase is active at any given moment is the analytical skill most retail investors have never been taught.
A Three-Cycle Stress Test: What the Data Actually Reveals
The 2008 GFC Drawdown: Forced Liquidation at Scale
Gold reached a peak of approximately $1,023.50 per ounce on March 17, 2008 (LBMA). As the collapse of Lehman Brothers triggered one of the most severe credit contractions in modern history, institutions sold everything with a bid. Gold was not immune.
| Metric | 2008 GFC |
|---|---|
| Pre-crisis peak | ~$1,023.50 (March 2008) |
| Trough price | ~$692 (October 2008) |
| Peak-to-trough decline | ~27% to ~32% (source-dependent) |
| Time to trough | ~7 months |
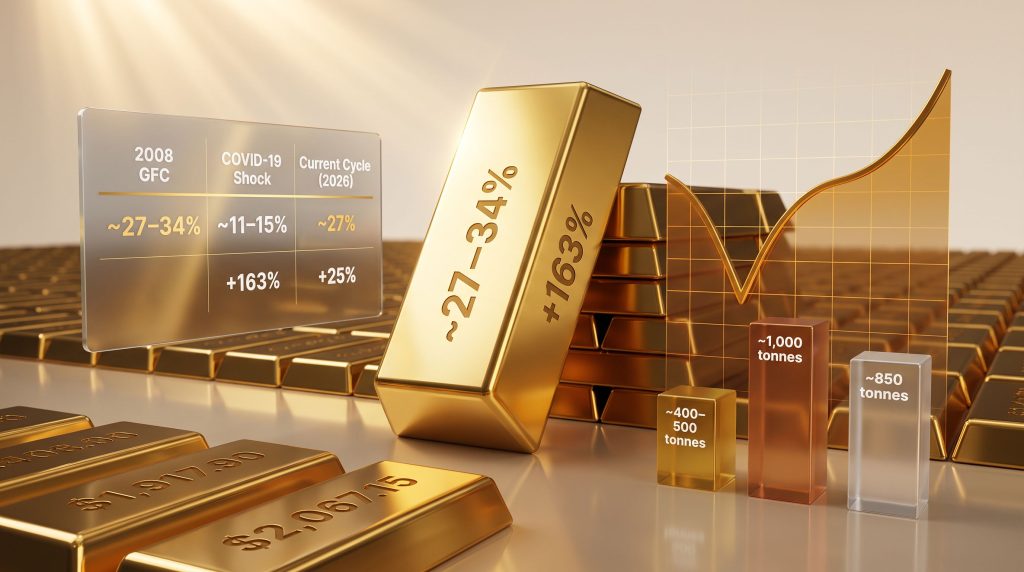
| Recovery gain from trough | ~163% |
| Recovery peak | $1,917.90 (August 2011) |
| Calendar year 2008 performance | ~+5% |
One detail that is consistently overlooked: despite the brutal intra-year drawdown, gold finished calendar year 2008 approximately 5% higher than where it started. The investors who sold at the October trough locked in a permanent loss inside what became one of the strongest gold rallies in recorded history. Furthermore, the Federal Reserve's subsequent quantitative easing programmes, spanning three separate rounds, drove the metal from its trough to $1,917.90 by August 2011 (U.S. Bureau of Labor Statistics; LBMA). That represents a recovery gain of approximately 163% over roughly three years. For additional context on gold price history through major crises, including the highs and lows across multiple decades, the data reinforces how durable these recoveries have proven to be.
The COVID-19 Shock: Speed Over Magnitude
The March 2020 gold correction shared the same underlying mechanism as 2008 but played out at a completely different speed and scale.
| Metric | COVID-19 Shock |
|---|---|
| Peak-to-trough decline | ~11% to ~28% (source-dependent) |
| Time to trough | ~11 days |
| Recovery peak | $2,067.15 (August 6, 2020) |
| Time to full recovery | Under 5 months |
| Full-year 2020 performance | ~+25% |
Data Note: The COVID drawdown magnitude varies meaningfully by source. Figures range from approximately 11% to 15% using certain peak windows, while some analyses cite figures closer to 28% depending on the specific high-water mark selected. Readers should be aware that peak-to-trough calculations are methodology-sensitive across LBMA daily fix, intraday, and monthly average datasets.
The Federal Reserve's announcement of open-ended quantitative easing triggered a rapid reversal. Gold reached a then-record high of $2,067.15 on August 6, 2020 (World Gold Council; LBMA). Full-year 2020 performance was approximately +25%. The investors who waited for confirmation before re-entering missed the majority of the recovery. Research examining gold as a safe haven during financial crises, including both the 2008 and COVID-19 events, consistently supports this two-phase interpretation.
Side-by-Side: Three Cycles Compared
| Dimension | 2008 GFC | COVID-19 Shock | Current Cycle (2026) |
|---|---|---|---|
| Peak-to-trough decline | ~27–32% | ~11–28% | ~27% |
| Speed to trough | ~7 months | ~11 days | Ongoing |
| Primary mechanism | Forced liquidation | Liquidity panic | Rate pressure + volatility |
| Monetary policy response | QE1, QE2, QE3 | Unlimited QE | TBD |
| Recovery magnitude | +163% | ~+25% (2020) | TBD |
| Structural thesis intact? | Yes | Yes | Yes |
The current drawdown, approximately 27% from the January 28, 2026 high of $5,589.38, aligns most closely in magnitude with the 2008 GFC rather than the shorter COVID shock. That matters for time horizon expectations. If the 2008 analog is the more relevant reference, the recovery window historically spans approximately three years from the trough. Price volatility in the current cycle has run at roughly twice the historical average, driven by compounding factors including geopolitical conflict, ongoing policy ambiguity, and speculative repositioning.
The 1970s Parallel: A Correction That Most Analysts Underweight
Neither the 2008 nor the 2020 comparison captures the full historical depth available. The 1970s bull market provides a third reference point that is frequently cited in specialist analysis but rarely understood by retail investors. Notably, this era followed directly from the end of the gold standard, which fundamentally reshaped the relationship between sovereign currencies and precious metals.
Between 1974 and 1976, gold declined approximately 47% over roughly two years (LBMA). At the time, the consensus view among commentators was that the gold bull market had definitively ended. It had not.
From that trough, gold subsequently rose to $850 per ounce by January 1980 (LBMA), representing a gain of more than 700% from the low point. Notably, the 1970s bull market contained five separate corrections exceeding 15% (World Gold Council). Each one generated genuine conviction among participants that the trend had reversed. Each was eventually resolved to new highs.
Historical Context: The 1974–1976 correction is the benchmark for understanding how severe an intra-bull-market drawdown can become without invalidating the underlying trend. A 47% decline that preceded a 700%+ recovery offers a sobering recalibration of what constitutes a genuine reversal versus a prolonged consolidation.
The structural drivers that powered the entire 1970s gold bull run, including the collapse of the Bretton Woods system, rising sovereign debt, and persistent inflation, remained fully intact throughout every correction within it.
The Structural Architecture Behind Every Gold Bull Market Since 1971
What Has Not Changed
Every significant gold bull market since the end of the Bretton Woods system in 1971 has been underpinned by three recurring structural forces: expanding sovereign debt, persistent deficit spending, and the progressive debasement of fiat currency purchasing power. These are not cyclical variables. They are architectural features of the post-1971 global monetary system.
As of mid-2026, the diagnostic checklist looks as follows:
| Structural Driver | Status as of Mid-2026 |
|---|---|
| U.S. sovereign debt trajectory | Unresolved — above $39 trillion (U.S. Treasury, Debt to the Penny) |
| Global fiat currency architecture | Unchanged — no commodity backing across any major currency |
| Real interest rate environment | Contested — rate pressure ongoing |
| Central bank reserve diversification | Active — ~850 tonnes projected 2026 (WGC) |
| Geopolitical reserve risk | Elevated |
None of the conditions that initiated the current gold bull market have been resolved. Several have intensified. The U.S. national debt above $39 trillion represents an obligation that cannot be discharged without some combination of real growth, inflation, financial repression, or currency debasement (U.S. Treasury, Debt to the Penny). Every one of those resolution pathways is historically constructive for gold.
An important distinction exists between short-term headwinds and long-term structural drivers. Rate pressure, speculative positioning, and geopolitical volatility are short-term in nature. However, sovereign debt trajectories, fiat monetary architecture, and reserve diversification trends operate across decades.
Central Bank Demand: Why Sovereign Buyers Behave Differently to Retail Markets
The Structural Floor That Sentiment Cannot Move
Central bank gold demand has been a consistent and defining feature of the market since 2009. Over the four years leading into 2026, sovereign institutions averaged approximately 1,000 tonnes of annual purchases, roughly double the pace of the preceding decade (World Gold Council Central Bank Gold Reserves Survey 2026). The World Gold Council projects approximately 850 tonnes of central bank purchases in 2026, compared to 863 tonnes in 2025 (WGC Q1 2026 Gold Demand Trends).
| Period | Estimated Annual Central Bank Gold Purchases |
|---|---|
| Pre-2022 average | ~400–500 tonnes |
| 2022–2025 average | ~1,000 tonnes |
| 2026 WGC projection | ~850 tonnes |
Even at the projected 2026 pace, central bank buying remains more than double the pre-2022 average. This is a structurally different demand environment than the decade prior to 2022. For a deeper look at how central bank gold reserves have evolved across major economies, the scale of this shift becomes even more apparent.
Why Price Declines Accelerate Sovereign Accumulation
The motivations driving central bank gold acquisition are price-insensitive by design. Sovereign institutions accumulating gold are not seeking short-term price appreciation. They are building long-term reserve positions against dollar concentration risk, geopolitical disruption, and the long-run erosion of fiat currency purchasing power.
A price drawdown in this context represents an improved cost basis for accumulation programmes, not a signal to pause. The three primary drivers of institutional buying, specifically dollar reserve diversification, geopolitical risk hedging, and long-term store of value, remain fully operative at any price level.
Paper vs. Physical: The distinction between paper gold instruments (futures, ETFs, derivatives) and physical gold demand is critical and consistently underappreciated. Paper markets are acutely sensitive to interest rate expectations and speculative sentiment. Physical demand from sovereign institutions historically moves counter-cyclically to paper market selloffs. A paper gold price decline and a physical demand decline are two entirely different phenomena.
An additional and lesser-known demand dynamic has emerged since 2025: stablecoin infrastructure backed by physical gold has introduced a new category of price-insensitive buyer. Since Q2 2025, some private entities building gold-backed digital instruments have been accumulating physical gold at a pace that rivals or exceeds individual central bank programmes, adding a structural demand layer that did not exist in either the 2008 or 2020 cycles.
The next major ASX story will hit our subscribers first
Scenario Modelling: Three Possible Resolutions From a 27% Drawdown
Scenario 1: The 2008 Analog Resolves (Base Case)
- Monetary policy pivots as rate pressure eases or reverses through cuts or renewed quantitative easing
- Central bank accumulation continues near projected levels
- Gold recovers toward and beyond its prior highs on a multi-year timeline
- Historical reference: +163% from the 2008 trough over approximately three years
Scenario 2: The COVID Analog Resolves (Accelerated Case)
- A catalyst event, whether geopolitical escalation, financial system stress, or an unexpected policy shock, triggers an abrupt reversal
- Recovery occurs within months rather than years, consistent with the 2020 pattern
- New all-time highs are established before the full structural thesis plays out
Scenario 3: Extended Consolidation Before Resumption
- Rate pressure persists longer than expected; the drawdown extends or trades sideways
- Gold consolidates in a compressed range while structural drivers continue to build beneath the surface
- Historical reference: the 1974–1976 correction, roughly 47% over two years, resolved to a 700%+ advance by January 1980
- This scenario reinforces the primacy of time horizon alignment over short-term timing precision
An important observation across all three scenarios: roughly half of the major financial crises over the past 50 years have been categorised as events that virtually no market participants anticipated in advance (World Gold Council historical data). This pattern suggests that positioning before a catalyst becomes publicly visible has historically delivered better outcomes than waiting for confirmation.
The Diagnostic Framework: Four Questions That Separate Corrections From Reversals
Rather than tracking price movement, investors with longer time horizons may find more analytical value in applying a structural checklist:
- Has the monetary thesis changed? Is sovereign debt declining? Has a commodity-backed currency system been re-established anywhere in the major global economy?
- Has central bank demand reversed? Are sovereign institutions now net sellers rather than consistent net buyers at scale?
- Has the mechanism of the selloff changed? Is the current pressure driven by a structural reassessment of gold's role, or by short-term rate dynamics and speculative repositioning?
- Has the historical pattern of correction-and-recovery broken down? Is there a documented precedent for this type of drawdown magnitude permanently ending a gold bull market with the structural thesis still intact?
Applying this framework to the current environment produces a consistent finding: none of the four conditions for a structural reversal are present as of mid-2026.
Frequently Asked Questions: Gold Drawdown Compared to 2008 and COVID
How large was gold's drawdown during the 2008 financial crisis?
Gold peaked at approximately $1,023.50 per ounce in March 2008 and declined to approximately $692 per ounce by October 2008. The peak-to-trough decline ranges from approximately 27% to 32% depending on the measurement methodology. Despite this intra-year drawdown, gold finished calendar year 2008 approximately +5%, and subsequently rose approximately 163% from the trough to $1,917.90 by August 2011 (LBMA; U.S. Bureau of Labor Statistics).
How large was gold's drawdown during COVID-19?
Gold's peak-to-trough decline during the March 2020 shock ranged from approximately 11% to 28% depending on which peak is measured. The trough was reached within approximately 11 days. Gold recovered to a then-record high of $2,067.15 by August 6, 2020, a full recovery in under five months. Full-year 2020 performance was approximately +25% (World Gold Council; LBMA).
Why does gold sometimes fall alongside stocks during a market crisis?
In extreme liquidity events, institutional investors sell their most liquid assets, including gold, to meet margin calls and raise cash rapidly. This is a mechanical process with no connection to a fundamental reassessment of gold's monetary value. The initial correlation with equities is consistently followed by a decoupling phase once monetary authorities respond. Both 2008 and 2020 followed this exact two-phase sequence (LBMA; World Gold Council).
What is the largest correction gold has survived within a bull market?
The 1974–1976 correction represents the historical benchmark: a decline of approximately 47% over roughly two years (LBMA). Gold subsequently rose more than 700% from that trough to $850 per ounce by January 1980. The 1970s bull market contained five separate corrections exceeding 15%, none of which constituted a structural reversal (World Gold Council).
Does a falling gold price mean physical demand is also declining?
Not necessarily. Paper gold instruments (futures, ETFs, derivatives) are highly sensitive to interest rate expectations and speculative sentiment. Physical demand from sovereign institutions tends to move counter-cyclically to price. Central banks averaged approximately 1,000 tonnes of annual purchases over the four years to 2026 (WGC CBGR Survey 2026). Lower prices historically accelerate sovereign accumulation rather than reducing it. Furthermore, the gold-silver ratio insights available from recent market analysis provide a useful supplementary lens for assessing relative precious metals positioning during drawdown periods.
Key Takeaways: What the Historical Pattern Tells Long-Term Investors
| Correction | Magnitude | Mechanism | Structural Thesis Intact? | Outcome |
|---|---|---|---|---|
| 2008 GFC | ~27–32% | Forced liquidation | Yes | +163% recovery to Aug 2011 |
| COVID-19 | ~11–28% | Liquidity panic | Yes | +25% full year; new ATH in 5 months |
| 1974–1976 | ~47% | Rate pressure + sentiment shift | Yes | +700%+ to January 1980 peak |
| Current (2026) | ~27% | Rate pressure + volatility | Structurally intact | TBD |
The consistent pattern across every major intra-bull-market gold correction is a short-term mechanical pressure event superimposed on a long-term structural thesis that remains fundamentally unchanged. The gold drawdown compared to 2008 and COVID consistently illustrates this dynamic. The diagnostic question is never how far gold has fallen. It is whether the reason for owning gold has materially changed.
For different investor profiles, the implications diverge:
- Short-term traders face a high-volatility environment running at approximately twice the historical average; timing the trough precisely has historically proven unreliable even for professional investors
- Medium-term investors (1 to 3 years) have the 2008 recovery trajectory as their primary reference point, with monetary policy direction acting as the key inflection catalyst
- Long-term investors (3+ years) are operating in an environment where sovereign debt levels, fiat monetary architecture, and central bank accumulation trends all continue to support the structural thesis regardless of near-term price movements
Important Disclaimer: This article is for educational and informational purposes only and does not constitute financial, investment, or purchasing advice of any kind. Past performance is not indicative of future results. Any historical returns, scenario projections, or data comparisons referenced herein may not reflect actual future performance. All investments, including precious metals, involve risk and may result in partial or total loss. Always consult a qualified financial advisor before making any investment decisions.
Want to Identify the Next Major Mineral Discovery Before the Market Does?
While gold's structural thesis remains intact through every correction cycle, Discovery Alert's proprietary Discovery IQ model delivers real-time alerts on significant ASX mineral discoveries — instantly translating complex mineral data into actionable opportunities for both short-term traders and long-term investors. Explore how historic discoveries have generated substantial returns and begin your 14-day free trial today to position yourself ahead of the broader market.