July 23, 2026
Two Markets, One Metal: Understanding the Gold ETF Outflows and Central Bank Buying Divergence of 2026
There are moments in financial markets when the same asset tells two completely different stories depending on who is holding it. Gold in mid-2026 is precisely that kind of moment. Gold ETF outflows and central bank buying are simultaneously occurring at an accelerating pace, while sovereign reserve managers are buying with a conviction that has not been seen in nearly a decade of tracked survey data. Understanding why both groups are behaving rationally, simultaneously, in opposite directions, is the key to understanding where gold goes from here.
The Gold Market Snapshot: Where Things Stand as of Late June 2026
Before examining the structural forces at work, it helps to anchor the analysis in current data. The following table summarises the key metrics defining the gold market as of June 25, 2026.
| Metric | Data Point | Source |
|---|---|---|
| Gold spot price (June 25, 2026) | ~$4,009/oz | Market data |
| Gold peak price (January 2026) | $5,595/oz | Market data |
| Peak-to-current drawdown | ~29% | Calculated |
| ETF underwater tonnage | ~298 tonnes | Standard Chartered |
| ETF net outflows (May 2026) | 16 metric tonnes | World Gold Council |
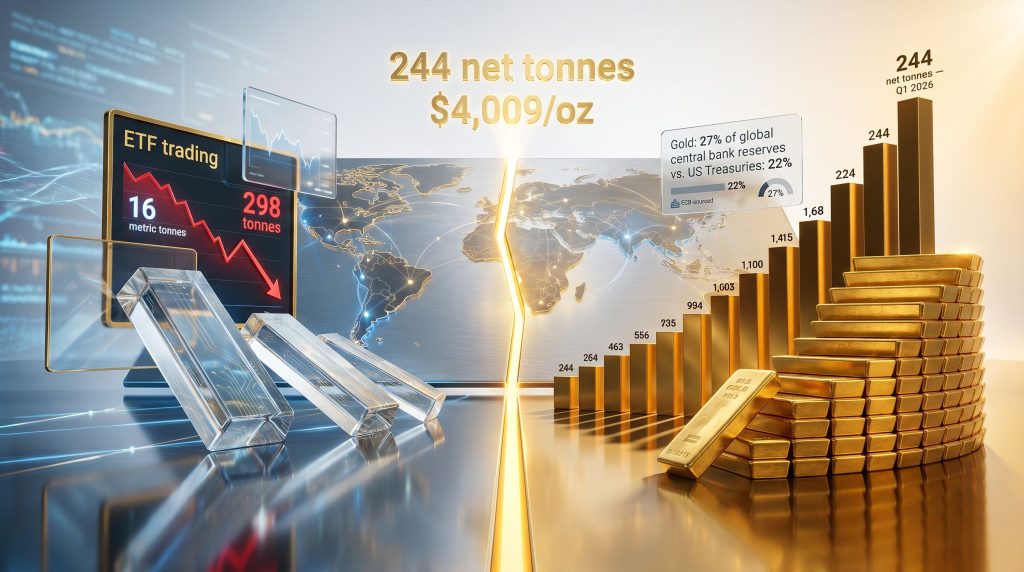
| Central bank purchases (Q1 2026) | 244 net tonnes | World Gold Council |
| Central banks planning to add gold (2026) | 45% of surveyed | WGC Survey 2026 |
| USD reserve share expected to fall (5-yr) | 74% of central banks | WGC Survey 2026 |
| September 2026 rate hike probability | ~68% | CME FedWatch |
| Gold's share of global central bank reserves | 27% | ECB, June 2026 |
| US Treasury share of global reserves | 22% | ECB, June 2026 |
"For the first time in modern financial history, gold has overtaken US Treasuries as the single largest asset class held across global central bank reserves, a structural transition that took decades to build and is unlikely to unwind on a short-term timeline." — ECB International Role of the Euro Report, June 2026
When big ASX news breaks, our subscribers know first
How the Rate-Cut Narrative Built Gold's January Peak, Then Collapsed It
To understand the current wave of gold ETF flows, you need to understand the thesis that created the inflows in the first place. Between October 2025 and January 2026, gold surged approximately 45%, climbing from around $3,865 per ounce to a peak of $5,595. That move was not driven by physical scarcity or a sudden collapse in mine supply. It was driven almost entirely by Western institutional capital flowing into gold-backed exchange-traded funds on the back of an increasingly confident rate-cut narrative.
The mechanics are straightforward. Gold pays no yield, which means its opportunity cost rises and falls with interest rate expectations. When markets anticipated a sustained Federal Reserve easing cycle through late 2025, the cost of holding a non-yielding asset effectively shrank. ETF investors poured capital into gold as a leveraged expression of that thesis, and they were rewarded handsomely through January 2026.
However, the thesis broke. Geopolitical developments in early 2026, specifically the inflationary pressure generated by conflict-driven oil price increases, forced Federal Reserve Chair Kevin Warsh into a hawkish recalibration that markets had not priced in. The dollar surged to a 13-month high. Rate hike probability for September 2026 went from roughly 29% to 68% within a single week, according to CME FedWatch data. That velocity of repricing, not just the level itself, is what triggered the magnitude of ETF redemptions that followed.
Why ETF Redemptions Are a Supply Event, Not Just a Sentiment Shift
A less commonly understood aspect of gold ETF outflows is the physical consequence of the redemption mechanism. Unlike selling a stock, where shares simply change hands, ETF redemptions in physically backed gold funds follow a specific chain of events:
- Investors sell ETF shares on the open market, depressing the share price relative to net asset value.
- Authorised participants, the large financial institutions that facilitate ETF creation and redemption, accumulate those discounted shares.
- They present the shares to the ETF custodian for redemption in exchange for the underlying physical metal.
- The custodian releases that metal back into the market, creating incremental physical gold supply entirely independent of mine production.
This means a sustained wave of ETF redemptions is not merely a repositioning event. It is a supply-generative mechanism. Gold ETFs recorded net outflows of 16 metric tonnes in May 2026, with further redemptions continuing into the first half of June, according to World Gold Council flow data. The brief $1.1 billion inflow snapback in the week prior to June 25 interrupted four consecutive weeks of outflows but did not resolve the structural overhang.
The 298-Tonne Overhang: A Price Ceiling With a Finite Lifespan
According to research published by Standard Chartered on June 24, 2026, approximately 298 tonnes of gold held inside exchange-traded funds is currently priced below its holders' average cost basis at gold prices around $4,000 per ounce. At current prices, that represents roughly $38 billion in metal held by investors whose rational response to any price recovery is to exit near breakeven rather than hold for further upside.
The figure has grown materially in a short period. When gold was still trading above $4,250, the underwater tonnage stood at approximately 270 tonnes. The decline to the $4,000 level added a further 28 tonnes of holders into loss territory. This creates a self-reinforcing dynamic that is important to understand:
- Price recovers toward average cost basis levels for underwater holders.
- Those holders sell into the rally to recover capital, capping the recovery.
- That selling pressure prevents the sustained advance needed to clear the overhang through appreciation.
- The ceiling perpetuates itself until time, rather than price, erodes the selling incentive.
The overhang is real and it matters for near-term price trajectory. However, it is worth emphasising what it is not: it is not an open-ended structural force. The 298 tonnes represents a finite inventory with a quantifiable exit threshold. Once those positions are cleared, whether through price recovery, time-decay of conviction, or further losses that convert reluctant holders into sellers who simply move on, the overhang disappears. The structural force on the other side of this equation does not.
Central Bank Gold Buying Operates on a Completely Different Logic
The World Gold Council's 2026 Central Bank Gold Reserves Survey, published June 16, 2026, surveyed 76 central banks and produced findings that represent the broadest sovereign accumulation intent in the survey's nine-year history. The headline numbers are striking:
- 89% of reserve managers expect global central bank gold holdings to increase over the next 12 months.
- A record 45% of surveyed central banks plan to add to their own gold reserves, up from 43% in 2025.
- 74% of central banks expect the US dollar's share of global reserves to decline over the next five years.
Furthermore, these figures do not emerge from a short-term tactical calculation. They reflect a multi-year structural reallocation that accelerated meaningfully after 2022, when the freezing of Russian sovereign foreign exchange reserves demonstrated to reserve managers worldwide that holding assets within the jurisdictional reach of geopolitical counterparties carries a risk that gold, held in allocated form domestically, does not. The surge in central bank gold demand following this event has reshaped the entire reserve management landscape.
Why Sovereign Buyers Are Structurally Price-Insensitive
The three structural reasons central banks behave differently from ETF investors are worth understanding in detail, because they explain why gold ETF outflows and central bank buying can coexist without contradiction:
- Tonnage targets, not price targets. Reserve managers optimise toward a percentage allocation of total reserves, not a return threshold. Their mandate is to reach a target weighting, and a lower price mathematically accelerates progress toward that target by delivering more tonnes per dollar deployed.
- No stop-losses or redemption pressure. A sovereign institution cannot face a margin call. It does not manage to a quarterly reporting cycle that rewards near-term performance. There is no mechanism by which falling prices force compulsory selling.
- Counter-cyclical incentive structure. Lower prices are not a deterrent for an entity optimising toward a tonnage target. They are an accelerant. This is the exact inverse of the ETF investor's incentive structure.
Country-Level Activity in Q1 and Q2 2026
| Central Bank | Recent Activity | Significance |
|---|---|---|
| Poland | +14 tonnes (April 2026); +45 tonnes YTD | Among the most aggressive European accumulators |
| People's Bank of China | 18 consecutive months of net purchases | Longest uninterrupted streak among major economies |
| Czech National Bank | +2 tonnes (recent quarter) | Continued diversification away from EUR-heavy reserves |
| Global central banks (Q1 2026) | 244 net tonnes purchased | Exceeded prior quarter and five-year quarterly average |
Central banks collectively purchased 244 net tonnes of gold in Q1 2026 alone, according to the World Gold Council's Gold Demand Trends Q1 2026 report, released April 29, 2026. That pace exceeded both the prior quarter and the five-year quarterly average, and it occurred while gold was trading approximately 28% below its January peak. The price decline did not interrupt the buying programme. For reserve managers, it was an operational detail, not a disqualifying signal. Notably, the expansion of central bank gold reserves over this period has been both broad and persistent across emerging and developed economies alike.
The ECB's Reserve Composition Data: A Structural Turning Point
Perhaps the most significant data point to emerge in June 2026 came from the European Central Bank's International Role of the Euro report. According to that publication, gold now accounts for 27% of global central bank reserves, compared to 22% for US Treasuries. Gold has structurally surpassed the world's historically dominant reserve asset.
This shift was driven by two simultaneous forces: active and sustained buying that roughly doubled official-sector gold demand following 2022, and the price appreciation of existing gold stocks amplifying their share of total reserve valuations. Neither force is simply reversible. You cannot un-buy the gold that has already been accumulated, and the de-dollarisation trend driving the structural reallocation is reflected in survey data showing 74% of central banks expecting the dollar's reserve share to decline over the next five years.
Scenario Analysis: Three Pathways for the Second Half of 2026
The interaction between gold ETF outflows and central bank buying creates three plausible market trajectories for the remainder of 2026. Each scenario is driven primarily by the trajectory of US inflation data and its effect on Federal Reserve policy expectations.
Scenario A: Overhang Persists, Sovereign Bid Holds
PCE inflation remains at or above consensus levels. The Federal Reserve proceeds with the September rate hike that CME FedWatch prices at 68% probability. ETF outflows continue at a reduced pace, and the 298-tonne overhang clears through time rather than price. Central bank buying absorbs available supply. Gold consolidates in approximately the $3,900 to $4,200 range, with price action remaining sideways and structurally supported.
Scenario B: Soft Inflation Data Triggers ETF Re-entry
Core PCE prints meaningfully below the 3.3% consensus. September rate hike probability recedes. Break-even selling pressure eases as underwater ETF holders choose to hold rather than crystallise losses into a weakening narrative. Renewed ETF inflows, similar to the $1.1 billion weekly snapback already observed, combine with steady sovereign demand. Gold consequently recovers toward the $4,400 to $4,600 range within two to three months.
Scenario C: Macro Shock Accelerates De-dollarisation
A geopolitical escalation or a significant US fiscal event accelerates reserve reallocation decisions globally. Central bank purchases exceed current annual estimates of approximately 800 tonnes. The 298-tonne ETF overhang becomes structurally irrelevant to price direction as sovereign demand overwhelms the available supply from redemptions. Gold recaptures territory above $5,000, and ETF holders who maintained positions through the drawdown are rewarded while those who sold at breakeven crystallise what proves to be a timing error.
In all three scenarios, central bank demand functions as the price floor. The ETF overhang determines the ceiling's height and duration, not the existence of the floor itself.
What Macro Indicators Should Investors Monitor Now?
For investors trying to navigate the current environment, three data points carry the most mechanical weight for gold prices in the near term:
1. The PCE Inflation Reading
The Personal Consumption Expenditures price index is the Federal Reserve's preferred inflation gauge. A core PCE reading at or above 3.3 to 3.4% extends dollar strength and prolongs the ETF overhang dynamic. A sub-3.3% print begins to erode September rate hike probability and removes some of the break-even selling pressure from underwater ETF positions.
2. The July 28–29 FOMC Meeting
The dot plot evolution coming out of this meeting will reshape rate expectations across the remainder of 2026. The velocity of change in rate hike probability, not simply the absolute level, has been the most powerful near-term price signal for gold throughout this cycle. Investors should consequently watch how the dot plot shifts relative to current market pricing rather than focusing solely on whether a hike occurs.
3. The Dollar Index
The DXY is currently at a 13-month high and is mechanically suppressing gold's USD-denominated price. In prior gold cycles, DXY peaks have preceded periods of ETF re-entry as rate expectations shifted. A dollar reversal driven by softening inflation data would directly compress the timeline over which the 298-tonne overhang clears. Understanding gold and bond dynamics in this context is equally important, as yield movements remain a critical co-driver of gold's price direction.
The next major ASX story will hit our subscribers first
FAQ: Gold ETF Outflows and Central Bank Buying Explained
What does it mean when gold ETFs experience outflows?
When investors redeem ETF shares, authorised participants collect that metal and return it to the broader market. Sustained redemptions therefore generate incremental physical gold supply, applying downward price pressure independently of what mining operations are producing.
Why do central banks keep buying gold when prices are declining?
Sovereign reserve managers target percentage allocations by tonnage, not by return thresholds. A lower price delivers more tonnes per dollar deployed, which mathematically accelerates progress toward their strategic allocation target. Falling prices are, in fact, an operational advantage for these buyers, not a deterrent.
How much gold inside ETFs is currently held at a loss?
As of late June 2026, approximately 298 tonnes of ETF-held gold is priced below its holders' average cost basis at prices around $4,000 per ounce, representing an estimated $38 billion in metal with latent selling incentives attached, according to Standard Chartered research published June 24, 2026.
Can central bank buying offset the ETF overhang in volume terms?
Central banks purchased 244 net tonnes in Q1 2026 alone, a volume comparable to the entire underwater ETF inventory. However, the two flows operate across different markets and different timeframes, meaning the offset is structural and cumulative rather than immediate and mechanical.
What percentage of global central bank reserves is now held in gold?
According to the ECB's June 2026 International Role of the Euro report, gold accounts for approximately 27% of global central bank reserves, surpassing US Treasuries at 22% to become the largest single reserve asset class. This transition illustrates how gold's safe-haven demand has evolved from a cyclical phenomenon into a permanent structural force in global finance.
What would reverse the ETF outflow trend?
A meaningful decline in rate hike expectations, driven by softer-than-expected inflation data such as a below-consensus PCE print, would reduce the opportunity cost of holding gold and ease the break-even selling pressure concentrated in the 298-tonne underwater inventory.
The Long-Game Framework: Which Buyer Has the Structural Advantage?
The answer to the question of who ultimately determines gold's structural price level comes down to a single variable: time horizon. ETF investors operate on quarterly rebalancing windows, driven by rate expectations, portfolio mandates, and near-term performance attribution. Central banks, however, operate on decade-long reserve management cycles driven by geopolitical risk assessment, currency diversification mandates, and sovereign balance sheet objectives.
The buyer with the longer time horizon sets the structural price floor. The buyer with the shorter time horizon sets the near-term ceiling. In the current environment, those roles are unambiguous.
The 298-tonne ETF overhang is a real, quantifiable, and finite constraint on near-term price recovery. Furthermore, sovereign gold accumulation is now in its fourth consecutive year of elevated purchasing, and the World Gold Council survey data indicates that intent is broadening rather than narrowing. The structural shift in how central banks value gold relative to dollar-denominated assets is a multi-decade revaluation in progress, not a quarterly tactical trade.
For long-term investors in physical precious metals, the distinction between these two buyer types is not a minor academic point. It is the entire analytical framework. The ETF overhang determines when the next leg higher begins. The sovereign reallocation mandate determines how far it ultimately goes.
Key structural takeaways:
- Approximately 298 tonnes of underwater ETF gold creates a real but finite ceiling on near-term price recovery.
- Central banks purchased 244 net tonnes in Q1 2026, a pace exceeding the five-year quarterly average.
- A record 45% of central banks plan to add gold reserves over the next 12 months, per the WGC's 2026 survey.
- Gold has structurally surpassed US Treasuries as the world's largest central bank reserve asset class for the first time in modern history.
- 74% of central banks expect the US dollar's share of global reserves to decline over the next five years.
- The ETF overhang clears; the sovereign reallocation mandate does not.
This article is for informational and educational purposes only and does not constitute financial or investment advice. All figures and data referenced are sourced from publicly available reports including the World Gold Council's Gold Demand Trends Q1 2026 and 2026 Central Bank Gold Reserves Survey, the ECB's International Role of the Euro report (June 2026), CME Group FedWatch, and Standard Chartered research. Forecasts, scenario projections, and probability estimates involve inherent uncertainty. Past performance is not indicative of future results. Always consult a qualified financial adviser before making investment decisions.
Want to Identify the Next Major Mineral Discovery Before the Broader Market Does?
While gold's structural dynamics play out across sovereign reserve rooms and ETF redemption desks, Discovery Alert's proprietary Discovery IQ model delivers real-time alerts on significant ASX mineral discoveries — instantly translating complex data across more than 30 commodities into clear, actionable insights for both short-term traders and long-term investors. Explore Discovery Alert's dedicated discoveries page to understand how historic mineral discoveries have generated substantial returns, and begin your 14-day free trial today to position yourself ahead of the market.