July 23, 2026
The Income Problem with Gold: Why Most Investors Are Looking at This All Wrong
Precious metals have anchored wealth preservation strategies for centuries, yet gold's most celebrated quality — its independence from any issuing authority or cash flow obligation — is simultaneously its greatest limitation for income-seeking investors. Bullion neither pays interest nor distributes profits. It simply holds value, appreciating and depreciating in response to monetary conditions, geopolitical stress, and shifting investor sentiment.
This structural reality has quietly driven a growing segment of investors toward a different kind of gold exposure: gold ETFs with dividends. These are not physical gold funds. They are vehicles that layer income-generating mechanisms on top of gold price exposure, either through equity stakes in mining companies or through sophisticated options strategies. Understanding the difference between these approaches, and which one suits a given investor's objectives, requires a clear-eyed look at how the income is actually produced and what risks accompany it.
When big ASX news breaks, our subscribers know first
Why Physical Gold ETFs Produce No Income
Before examining dividend-paying alternatives, it helps to understand why the most widely held gold ETFs — including GLD and IAU — generate no distributions at all. These funds hold physical bullion in vaulted storage. The gold neither grows, compounds, nor produces cash flow. The only return available to investors is price appreciation.
This is a deliberate structural feature, not a flaw. Physical gold vs ETFs designed to track spot prices are built for precise benchmark replication, minus a modest expense ratio. For investors seeking a pure hedge against inflation, currency debasement, or systemic financial risk, that simplicity is exactly what they want.
For investors who also need their portfolio to generate income, however, physical gold ETFs create a gap. That gap is filled by two distinct product categories.
The Two Pathways to Dividend Income Through Gold Exposure
Pathway 1: Gold Mining Equity ETFs
These funds hold shares in publicly listed gold mining companies. Because mining companies generate operating revenue, they can distribute a portion of profits to shareholders as dividends. When an investor buys a gold miner ETF, they are effectively purchasing a basket of these equities, and any dividends paid by the underlying companies are collected and distributed to ETF unitholders.
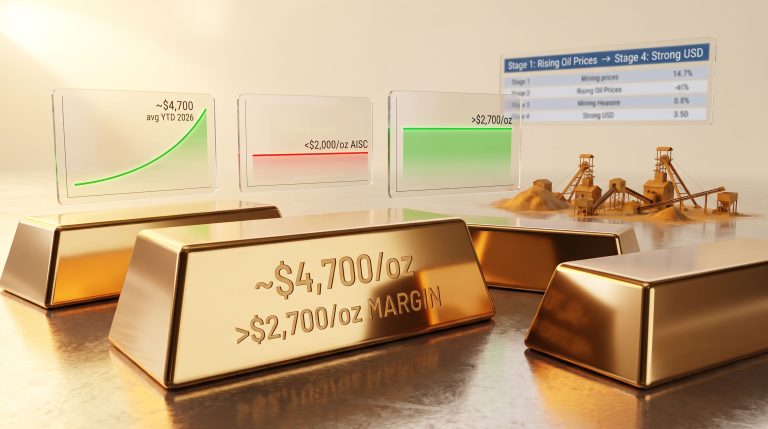
The critical insight here is that dividends are paid from corporate earnings, not from the value of gold itself. A gold miner's ability to distribute income depends on the spread between the gold price it receives and the all-in sustaining cost (AISC) it incurs to produce each ounce. AISC typically encompasses mining, processing, corporate overhead, sustaining capital expenditure, and environmental remediation costs. When gold prices are high and AISC is well-controlled, margins expand and dividends can grow. When margins compress, distributions shrink or disappear entirely.
Pathway 2: Options-Income Gold ETFs
A newer category of gold ETFs with dividends takes an entirely different approach. Rather than owning mining companies, these funds hold positions in gold exchange-traded products and then sell call options against those positions — a strategy known as a covered call overlay. The premiums collected from selling those options are distributed to investors as monthly income.
This structure can generate substantially higher headline yields than traditional miner ETFs, but the income source is fundamentally different. Investors are essentially monetising the implied volatility of gold, receiving option premiums in exchange for capping some of their upside exposure during strong gold rallies.
Key structural distinction: Mining ETF dividends reflect the operational profitability of real companies. Options-income ETF distributions reflect derivative premiums tied to gold price volatility. Both can decline or fluctuate, but for entirely different reasons and under entirely different market conditions.
How Gold Mining Dividends Are Actually Generated
The Profit Chain From Ore to Distribution
Understanding the journey from gold in the ground to cash in an investor's brokerage account clarifies why dividend yields in this sector behave so differently from those in utilities or consumer staples.
The process follows a specific sequence:
- Gold is extracted and processed at a mine site, incurring labour, energy, consumable, and capital costs.
- The refined metal is sold at or near the prevailing spot price, generating revenue.
- Operating margins are calculated by subtracting AISC from the realised gold price per ounce.
- Corporate financial policy determines how much of the resulting free cash flow is reinvested in exploration or expansion versus returned to shareholders as dividends.
- ETF fund managers collect dividends from all underlying holdings and distribute the aggregate to ETF unitholders.
Each step in this chain introduces variability. A single mine experiencing operational disruptions, a spike in diesel fuel costs, or a permitting delay can reduce a company's contribution to the fund's overall yield. Multiply that across dozens of holdings, and the aggregate ETF yield can shift meaningfully from one distribution period to the next.
What Drives Dividend Variability in Gold Mining ETFs
Several forces shape how much income a gold miner ETF actually pays out:
-
Gold spot price movements: Higher gold prices directly expand mining margins. Furthermore, because many miners operate with relatively fixed cost bases in the short term, a $100 per ounce increase in the gold price can translate to a disproportionately larger increase in free cash flow — a dynamic sometimes called operational leverage. How gold prices affect miners is therefore one of the most important variables to monitor.
-
All-in sustaining costs (AISC): This is the most important operational metric for assessing dividend sustainability. Miners with low AISC relative to the prevailing gold price have greater capacity to pay and grow dividends. Industry average AISC figures have risen meaningfully over the past decade due to deeper ore bodies, higher energy costs, and increasing regulatory requirements.
-
Corporate dividend policy: Each mining company independently sets its approach to distributions. Some prioritise aggressive reinvestment in new projects; others have adopted formal dividend frameworks tied to free cash flow generation. ETFs holding companies with structured dividend policies tend to deliver more predictable distributions.
-
Geopolitical and jurisdictional risk: Gold mining is a globally dispersed industry, with significant production in jurisdictions that carry elevated political or regulatory risk. Changes in mining royalties, taxation regimes, or export restrictions in key producing countries can directly affect company profitability and, by extension, dividend capacity.
-
Currency dynamics: Most gold is priced in US dollars, but many mining companies incur costs in local currencies. A strengthening US dollar relative to the Australian dollar, South African rand, or Canadian dollar can actually improve the margins of miners operating in those jurisdictions, creating a nuanced currency tailwind that not all investors consider.
Investor note: Unlike dividend yields from sectors with stable earnings, gold miner ETF yields should be treated as directional indicators tied to the gold price cycle, not as reliable income floors. Yield figures can appear attractive at cyclical peaks and deteriorate rapidly as conditions shift.
Comparing the Major Gold ETFs That Pay Dividends (2026 Data)
The following table summarises the key metrics for the four primary gold ETFs with dividends available to investors as of early 2026. All data is sourced from fund prospectuses and publicly available ETF disclosures and is subject to change.
| ETF | Ticker | Inception | Distribution Frequency | Distribution Yield | 30-Day SEC Yield | Expense Ratio | Shares Outstanding |
|---|---|---|---|---|---|---|---|
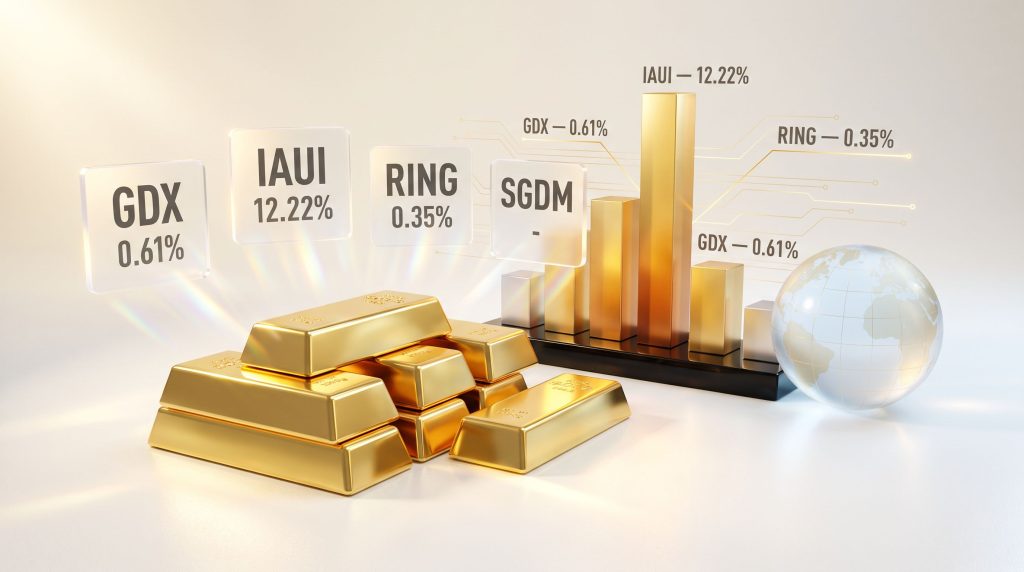
| VanEck Gold Miners ETF | GDX | May 2006 | Annual | 0.61% | 0.18% | 0.51% | 316,652,500 |
| NEOS Gold High Income ETF | IAUI | June 2025 | Monthly | 12.22% | 1.75% | 0.78% | 6,360,000 |
| iShares MSCI Global Gold Miners ETF | RING | Jan 2012 | Semi-Annual | N/A | 0.35% | 0.39% | 41,250,000 |
| Sprott Gold Miners ETF | SGDM | July 2014 | Annual | N/A | Not disclosed | 0.50% | 9,580,000 |
VanEck Gold Miners ETF (GDX): The Liquidity Benchmark
With over 316 million shares outstanding, GDX is the most liquid vehicle in this category by a considerable margin. It seeks to replicate the price and yield performance of the MarketVector Global Gold Miners Index (MVGDXTR), providing broad-based exposure to large-cap gold producers globally.
Its annual distribution yield of 0.61% reflects the aggregate dividend output of its diversified holdings. GDX is widely noted for its high beta characteristic — meaning it tends to amplify gold price movements in both directions, often outperforming gold during bull runs and underperforming during corrections. This amplification effect makes the fund appealing for investors seeking leveraged gold exposure alongside a modest income component. For a broader overview of gold mining stock types and how they compare, it is worth exploring the full spectrum of available structures.
NEOS Gold High Income ETF (IAUI): The Options-Income Outlier
Launched in June 2025, IAUI is the newest entrant in this comparison and arguably the most structurally distinctive. It does not hold gold mining equities. Instead, it applies a data-driven call option strategy to gold ETPs, generating monthly distributions that have produced an annualised distribution rate of 12.22%, with a per-share distribution amount of $0.6202 as of early 2026.
The 30-Day SEC Yield of 1.75% is notably lower than the headline distribution rate, which highlights how significantly the two metrics can diverge. The expense ratio of 0.78% is the highest in this peer group and represents meaningful cost drag that should be weighed against the elevated yield.
Investors considering IAUI should understand that the fund's income is sensitive to options market conditions. During periods of compressed gold price volatility, option premiums decline, which can reduce distribution amounts. The fund is best suited for income-focused investors who are comfortable with derivatives-based strategies and accept yield variability. Investopedia's analysis of gold ETFs that pay dividends provides additional context on how these structures have historically performed.
iShares MSCI Global Gold Miners ETF (RING): The Global Diversifier
RING tracks the MSCI ACWI Select Gold Miners Investable Market Index, offering exposure to gold mining equities across multiple continents. Its semi-annual distribution schedule provides two income events per year, and at an expense ratio of 0.39%, it is the most cost-efficient mining-focused option in this comparison.
With 41.25 million shares outstanding, RING offers meaningful but more targeted liquidity than GDX. Its geographic diversification across developed and emerging market mining jurisdictions can reduce concentration risk relative to funds weighted heavily toward North American producers.
Sprott Gold Miners ETF (SGDM): The Factor-Weighted Alternative
SGDM differentiates itself through a factor-weighted methodology, tracking the Solactive Gold Miners Custom Factors Index (SOLGMCFT). Rather than simply weighting holdings by market capitalisation, the index applies rules-based factors to target larger gold companies listed on Canadian and major US exchanges.
At 9.58 million shares outstanding, SGDM has the smallest float in this comparison, which may create wider bid-ask spreads and reduced trading efficiency for larger positions. The annual expense ratio of 0.50% is moderate, and the 30-Day SEC Yield is not publicly disclosed on the fund's primary listing page, making direct yield comparisons more difficult.
Decoding the Metrics: Distribution Yield vs. 30-Day SEC Yield
One of the most common points of confusion for investors researching gold ETFs with dividends involves the relationship between these two yield figures.
Distribution yield is calculated by taking the fund's most recent single distribution, multiplying it by 12 to annualise it, and then dividing by the fund's most recent ex-date net asset value (NAV). It reflects a single point in time and does not represent total return or guarantee future payouts.
The 30-Day SEC Yield is a standardised metric mandated by the US Securities and Exchange Commission. It estimates a fund's hypothetical annualised income as a percentage of assets based on the projected dividend yield of holdings over the trailing 30-day period. This figure is designed to allow apples-to-apples comparisons across funds but can diverge significantly from actual distributions.
The divergence between these two figures is especially pronounced in gold miner ETFs because the underlying holdings are cyclical. A fund might distribute a large one-time special dividend that inflates the distribution yield without that level of income being sustainable — something the SEC yield methodology is better positioned to smooth out. Always evaluate both figures together, and treat either in isolation as incomplete.
The next major ASX story will hit our subscribers first
Understanding Ex-Dividend, Record, and Payment Dates
Three dates govern when and whether an investor receives a distribution from a gold ETF:
-
Ex-dividend date: Investors must hold shares before this date to qualify for the upcoming distribution. Buyers on or after this date are not entitled to receive it.
-
Record date: The date on which the fund confirms its list of eligible shareholders. If this falls on a non-business day, the ex-dividend date moves to the preceding business day.
-
Payment date: When the cash distribution is actually credited to investor accounts.
A well-documented market pattern surrounds these dates: ETF prices frequently rise in the days preceding the ex-dividend date as demand increases from investors seeking to qualify for the distribution. Prices then tend to soften afterward as the upcoming payment is effectively priced out of the NAV. Investors buying primarily for dividend capture should factor this dynamic into their timing and entry price calculations.
Reinvesting vs. Taking Cash: A Framework for Decision-Making
Whether to reinvest gold ETF dividends or take them as cash depends on several investor-specific factors. The compounding argument for reinvestment is straightforward: additional shares purchased through reinvestment increase unit count over time without requiring new capital, and in a sustained gold bull market, those additional shares can compound significantly. Furthermore, central bank gold demand has reinforced upward price momentum in recent years, making the case for compounding within gold-related holdings increasingly compelling.
However, the case for taking cash distributions is equally valid in certain circumstances:
- Investors in or near retirement who require a regular income stream from their portfolio
- Situations where additional ETF exposure would create concentration risk in gold-related holdings
- Periods of elevated miner valuations where reinvestment risk is disproportionately high
Critical reminder: Reinvesting dividends does not protect against market risk. Additional shares purchased through a dividend reinvestment plan (DRIP) are subject to exactly the same price fluctuations as the original holding. The initial invested capital is not preserved or guaranteed by the reinvestment mechanism.
Many brokerage platforms offer automatic DRIP functionality for ETFs, though availability varies by platform and specific fund. For a more detailed look at how gold ETF dividend reinvestment works in practice, the APMEX learning centre offers a useful technical breakdown.
Risk Dimensions Specific to Dividend-Paying Gold ETFs
Operational Risk: The Layer Physical Gold Doesn't Have
Physical gold ETFs carry essentially no operational risk — the metal sits in a vault and its value tracks the spot price. Gold miner ETFs introduce an entirely separate risk layer: the operating performance of real companies in a complex, capital-intensive industry.
Key operational risks that can erode mining profitability and dividend capacity include:
- Labour disputes and strikes at mine sites
- Energy cost inflation, particularly diesel and electricity
- Geotechnical challenges such as ground instability or unexpected ore body changes
- Environmental regulatory changes requiring additional capital expenditure
- Mine permitting delays extending project timelines
- Jurisdictional risk in politically unstable mining regions
Comparing Risk Profiles Across Gold ETF Structures
| Risk Dimension | Physical Gold ETFs | Gold Miner ETFs | Options-Income Gold ETFs |
|---|---|---|---|
| Dividend Income | None | Modest, variable | Higher, structurally different |
| Gold Price Sensitivity | Direct (1:1) | Amplified (leveraged beta) | Indirect (via ETP overlay) |
| Operational Risk | None | High | Low to moderate |
| Yield Stability | N/A | Low to moderate | Variable (options-dependent) |
| Expense Ratio Range | 0.10%–0.25% | 0.39%–0.78% | 0.78%+ |
It is also worth noting that undervalued gold miners within these ETF baskets can sometimes present asymmetric return opportunities, particularly when spot prices are rising faster than miner valuations have reflected.
A Decision Framework for Evaluating Gold ETFs with Dividends
Before committing capital to any dividend-paying gold ETF, investors benefit from working through a structured evaluation process:
- Clarify the primary objective — Are you seeking income, gold price participation, or total return growth? Each objective points toward a different product structure.
- Identify the dividend source — Mining profits and options premiums behave differently across market cycles. Understanding which one you are exposed to is foundational.
- Compare both yield metrics — Distribution yield and 30-Day SEC Yield should always be read together. Neither in isolation provides an accurate picture.
- Account for expense ratios — A 0.39% expense ratio versus a 0.78% ratio may seem minor but compounds meaningfully over multi-year holding periods.
- Assess liquidity — Float size and average daily trading volume affect transaction costs, particularly for larger positions.
- Read the prospectus — Each ETF's legal disclosure document outlines investment objectives, benchmark methodology, risk factors, and distribution policies in full.
- Consider the role of physical gold — For investors who prioritise capital preservation, holding physical gold or a physical gold ETF alongside a dividend-focused miner ETF may provide a more balanced risk-return profile.
- Consult a qualified financial advisor — Given the cyclical complexity of this sector, professional guidance is strongly recommended before making allocation decisions.
Disclosure: This article is intended for educational purposes only and does not constitute financial or investment advice. All investment decisions should be based on individual research and, where appropriate, the guidance of a licensed financial professional. Past performance is not indicative of future results, and all investments carry the risk of capital loss.
Investors seeking additional context on gold ETF structures, dividend mechanics, and precious metals investing fundamentals may find educational resources at learn.apmex.com useful as a starting reference point.
Want to Know When the Next Major Gold Discovery Hits the ASX?
Discovery Alert's proprietary Discovery IQ model scans ASX announcements in real time, instantly identifying significant mineral discoveries — including gold — and translating complex data into clear, actionable insights for both short-term traders and long-term investors. Explore how historic discoveries have generated substantial returns on Discovery Alert's dedicated discoveries page, then begin your 14-day free trial to position yourself ahead of the broader market.