July 23, 2026
The Operating Leverage Story That Gold Investors Are Underpricing
Across commodity cycles, the gap between what a raw material earns and what the companies extracting it are valued at rarely stays wide for long. History suggests that when miners generate cash flows well above what their equity prices imply, the market eventually closes that gap, sometimes slowly and sometimes in concentrated bursts that reward early positioning. In mid-2026, that gap in the VanEck gold mining stocks upside narrative has become difficult to ignore.
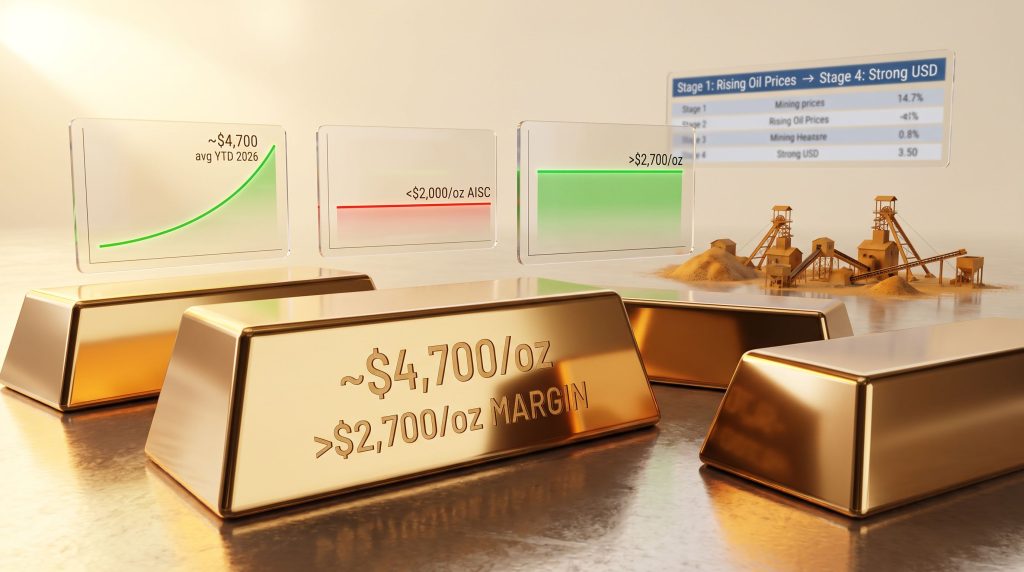
The arithmetic is stark. Gold has traded at an average price of approximately $4,700 per ounce through the first half of 2026, while sector-wide all-in sustaining costs (AISC) are estimated to remain below $2,000 per ounce for the full year. That leaves an implied gross margin exceeding $2,700 per ounce, a spread that represents one of the most exceptional operating environments in the history of the modern gold mining industry.
Yet equity valuations in the sector are not reflecting that operational strength. Current share prices across major producers appear to embed far more conservative gold price assumptions than spot levels justify, according to VanEck Portfolio Manager Imaru Casanova, who outlined the thesis in a mid-2026 market commentary published by Kitco News.
When big ASX news breaks, our subscribers know first
Mapping the Current Macro Environment Against Gold's Historical Drivers
Why Gold's Structural Case Extends Beyond Any Single Catalyst
Gold's role as a portfolio anchor is frequently misunderstood. It is neither purely a hedge against inflation nor solely a safe-haven asset activated by geopolitical crisis. Over long cycles, gold has functioned as a form of monetary insurance against the erosion of purchasing power across multiple stress scenarios, including inflationary environments, deflationary shocks, currency debasement, and periods of acute geopolitical instability.
What makes the current cycle structurally different from prior gold bull markets is the geographic broadening of demand. Furthermore, sovereign buying from central banks across Asia, the Middle East, and Eastern Europe has become a persistent and diversified source of accumulation that was largely absent in earlier cycles. This de-dollarisation dynamic, where reserve managers are actively reducing exposure to U.S. Treasury holdings and substituting physical gold, has created a structural demand floor that is less sensitive to Western investor sentiment than past cycles.
The World Gold Council's data covering 44 Federal Reserve rate increases between March 1997 and July 2023 found that gold delivered a positive surprise return on more than 50% of those hike days, directly challenging the widely held assumption that monetary tightening is uniformly bearish for the metal.
This is a critical piece of market psychology to understand. Investors who automatically reduce gold exposure when the Fed signals hawkishness may be acting on an oversimplified framework, one that the historical data does not consistently support.
The 2024–2026 Cycle: New Demand Architecture
Several features distinguish the current gold cycle from prior multi-year rallies:
- Sovereign diversification: Central banks globally have maintained elevated and geographically diversified gold accumulation programs, providing consistent demand that does not respond to the same sentiment cycles as retail or institutional Western flows.
- Asian investment demand: Retail and institutional buyers across Asia have remained resilient buyers of both physical gold and gold-backed products, even during periods when Western investor enthusiasm has faded.
- De-dollarisation momentum: The structural shift away from dollar-denominated reserve assets among major emerging market economies has introduced a long-duration demand driver with geopolitical, rather than purely financial, motivations.
- Western investor participation gap: Institutional participation from Western fund managers, which was notably active through 2025, has moderated in mid-2026, creating what may be the largest incremental demand catalyst yet to fully engage.
Understanding the 25% Price Correction: Context and Mechanics
How the Self-Reinforcing Macro Loop Works
Gold's trajectory from approximately $5,600 per ounce in late January 2026 to a June 2026 low near $3,943 per ounce reflects a specific macro feedback dynamic that is worth dissecting systematically. The mechanism works as follows:
Analytical Framework: The Four-Stage Macro Feedback Loop
| Stage | Driver | Impact on Gold |
|---|---|---|
| 1 | Rising oil prices from geopolitical escalation | Keeps headline inflation elevated |
| 2 | Persistent inflation expectations | Delays Federal Reserve rate cuts |
| 3 | Fed on hold | Sustains elevated real yields |
| 4 | Elevated real yields and strong USD | Suppresses gold price |
The onset of the Iran war reshaped the dominant macro narrative, embedding oil price risk into inflation expectations and effectively pushing rate cut expectations further out on the horizon. A stronger U.S. dollar accompanied this repricing, and since gold is priced in dollars and pays no income, the combination of dollar strength and elevated real yields created meaningful headwinds.
However, this feedback loop carries an important internal contradiction. Extended periods of monetary policy stasis, where the Fed holds rates steady while inflation gradually decays, have historically produced environments where real yields drift lower or turn negative over time. Consequently, flat-to-negative real rate environments have been among the most reliably favourable backdrops for gold across modern monetary history.
What "Fed on Hold" Actually Means for Gold Long-Term
The intuition that gold requires active rate cuts to rally is not well supported by the historical record. What gold actually responds to is the level of real yields, not the direction of nominal rate changes. A prolonged pause in Fed policy, during which nominal rates stay fixed while inflation persists, can erode real yields over time without any formal policy pivot, creating a favourable backdrop for gold without requiring the Fed to cut at all.
This distinction matters considerably for investors calibrating their positioning. Furthermore, understanding gold as a safe haven means recognising that waiting for a rate cut announcement before increasing gold exposure may mean arriving after much of the re-rating has already occurred.
Gold Mining Equities: The Leverage Mechanism Explained
Operating Leverage and Why It Creates Asymmetric Outcomes
The fundamental reason gold mining equities can dramatically outperform physical gold in rising price environments comes down to the structure of their cost bases. Mining operations carry a significant proportion of fixed and semi-fixed costs: labour agreements, energy contracts, royalty obligations, and capital maintenance schedules that do not scale proportionally with the gold price.
When gold prices rise, revenue per ounce increases while many of those costs remain relatively stable, causing operating margins to expand at a rate that exceeds the percentage increase in the gold price itself. This is the operating leverage effect, and it is the core reason VanEck gold mining stocks upside arguments tend to centre on miners rather than the metal during bull phases.
The inverse is equally true. When gold prices fall, margins compress faster than the percentage decline in gold, which is why the MarketVector Global Gold Miners Index (MVGDX) fell 15.54% in June 2026 alone, even as gold's own decline was significant but less severe. Investors in mining equities are accepting this asymmetric volatility profile in exchange for the amplified upside when conditions turn. For instance, understanding how gold price movement affects mining equities is essential before committing capital to this sector.
Record Margins and What They Mean for Capital Allocation
Margin Snapshot: Gold Mining Sector, 2026
| Metric | Estimated 2026 Figure |
|---|---|
| Average Gold Price (YTD) | ~$4,700/oz |
| Sector Average AISC | <$2,000/oz |
| Implied Margin per Ounce | >$2,700/oz |
| Margin Resilience Floor | Positive at ~$4,000/oz |
The practical consequence of these margins is a transformation in what major gold producers can do with their balance sheets. At over $2,700 per ounce in gross margin, well-run producers have simultaneous capacity to:
- Self-fund organic growth projects without dilutive equity raises
- Sustain and grow dividend programs that attract income-oriented institutional capital
- Execute share buyback programs that signal management confidence and reduce float
- Build cash reserves that provide resilience against future gold price volatility
Q1 2026 earnings results across major producers reflected this dynamic, with record cash flow generation reported across the sector. Yet equity prices have not fully repriced to reflect this operational reality, a divergence that historically resolves in favour of equities when sentiment recovers. According to Sprott's analysis of gold miners in 2025, this pattern of delayed equity re-rating following periods of strong cash generation is well-documented across prior cycles.
The GDX Framework: Bull Case, Bear Case, and Key Conditions
What the Bull Case Requires
The upside thesis for VanEck gold mining stocks is not unconditional. Several specific conditions need to align for the re-rating to materialise:
- Gold price stabilisation above $4,000/oz to preserve the strong margin structure that underpins current cash flow generation
- Return of Western institutional participation in gold markets, which was active through 2025 but has since moderated significantly
- Continued central bank accumulation providing a structural demand floor beneath spot prices
- Equity re-rating as the market recognises the gap between current valuations and actual cash flow generation
Additional potential catalysts that could accelerate the thesis include a softening in Fed communication that reduces real yield pressure, escalation of geopolitical risk driving safe-haven demand, and rotation of institutional capital from high-multiple growth sectors into commodity equities trading at historically low cash flow multiples.
The Bear Case: Risks That Cannot Be Ignored
| Risk Factor | Potential Impact |
|---|---|
| Further gold price decline | Rapid margin compression; miners underperform the metal sharply |
| Rising real interest rates | Strengthens USD, reduces non-yielding asset appeal |
| Operational cost inflation | Erodes AISC advantage if energy and labour costs accelerate |
| Sustained equity market strength | Reduces defensive rotation into gold equities |
| Geopolitical resolution | Removes risk premium embedded in current gold pricing |
Gold pays no income and can experience sharp or prolonged price declines. It may not act as an effective hedge or diversifier in any given period. The same operating leverage that amplifies gains in rising gold price environments accelerates losses when prices fall, making position sizing and entry discipline critical considerations for investors.
Demand Architecture: Who Is Actually Buying Gold
The Structural Shift Away From Western-Centric Demand
One of the most consequential and underappreciated structural changes in the gold market over the past several years is the shifting geographic centre of gravity for demand. For decades, Western institutional and retail investors drove marginal price discovery in gold. That dynamic has changed materially.
Demand Structure Comparison
| Demand Segment | Current Status | Upside Potential |
|---|---|---|
| Central Banks (Global) | Elevated and sustained | Moderate, already partially priced |
| Asian Investment Demand | Resilient | Moderate |
| Western Institutional Investors | Subdued vs. 2025 levels | High, key re-entry catalyst |
| Western Retail Investors | Reduced | High, sentiment-driven |
The most significant incremental demand catalyst that has yet to fully materialise is the re-engagement of Western institutional investors at scale. When that participation returned in 2025, it contributed meaningfully to gold's ascent toward the $5,600 per ounce peak. A repeat of that dynamic, layered on top of already resilient central bank and Asian demand, represents the most powerful potential upside scenario for both gold prices and VanEck gold mining stocks upside specifically. In addition, gold investment amid inflation and economic uncertainty has historically been a key driver of this type of institutional re-engagement.
The next major ASX story will hit our subscribers first
Portfolio Construction: Integrating Gold Mining Exposure Thoughtfully
Five Factors to Evaluate Before Allocating
Investors considering exposure to gold mining equities through vehicles like GDX, which tracks the MarketVector Global Gold Miners Index and offers diversified liquid access to global producers, should evaluate these five variables in sequence:
- Gold price outlook as the single most important variable driving equity returns across the sector
- AISC trajectory and sensitivity to input cost inflation, particularly energy and labour
- Balance sheet quality with emphasis on low debt, strong free cash flow, and hedging policy
- Capital return discipline as dividend growth and buyback programs signal management conviction
- Valuation entry point relative to historical cash flow multiples, where current levels appear to offer a meaningful margin of safety
Moreover, understanding the different types of gold mining investment vehicles available is an important step before determining which exposure best suits a given portfolio objective.
The Time-Sensitivity of the Re-Rating Window
Re-rating events in commodity equities tend to be concentrated and rapid. The window during which quality gold mining stocks trade at a discount to their implied fundamental value is typically narrow. Investors who wait for price confirmation before positioning often find that the momentum-driven phase of re-rating has already compressed much of the valuation gap by the time they act.
This is a documented pattern in market psychology: the uncertainty that keeps valuations depressed resolves suddenly, and the equities that were pricing in overly conservative gold assumptions reprice sharply as those assumptions are revised upward. For investors with a constructive medium-term view on gold, the current environment may represent precisely that setup.
Frequently Asked Questions
What is the primary reason VanEck sees upside in gold mining stocks?
Gold mining equities are generating record cash flows at current gold prices, yet equity valuations remain below historical norms relative to those fundamentals, creating a potential re-rating opportunity if gold prices stabilise or recover above key levels.
Do gold miners outperform gold in rising price environments?
Historically, yes. The operating leverage embedded in mining businesses means that revenue growth from higher gold prices tends to exceed cost growth, expanding margins and driving equity outperformance relative to the metal itself. VanEck's 2026 gold outlook explores this leverage dynamic in considerable depth.
What is the biggest risk to the gold mining upside thesis?
A sustained decline in gold prices represents the primary risk. The same leverage that amplifies gains in rising markets accelerates losses when gold falls, as demonstrated by the MVGDX declining 15.54% in June 2026 alone.
Does the Federal Reserve need to cut rates for gold to rally?
Not necessarily. An extended period of monetary policy stasis where the Fed holds rates steady while inflation gradually erodes real yields has historically been a favourable backdrop for gold, even without formal rate reductions.
What role do central banks play in supporting gold prices?
Central banks have emerged as a structurally significant and geographically diversified source of gold demand, providing a consistent demand floor that has helped moderate downside price risk even during periods of reduced Western investor participation.
How does GDX provide exposure to gold mining upside?
GDX tracks the MarketVector Global Gold Miners Index, offering diversified exposure to a broad basket of global gold producers. This structure reduces single-company operational risk while preserving the sector-level leverage to gold price movements that defines the VanEck gold mining stocks upside thesis.
This article is for informational purposes only and does not constitute financial advice or a solicitation to buy or sell any securities or commodities. Gold mining equities involve significant risks, including but not limited to gold price volatility, operational risk, and leverage amplification of both gains and losses. Past performance of gold or gold mining equities is not indicative of future results. Investors should seek independent financial advice before making investment decisions. Views referenced from VanEck are sourced from Kitco News reporting and represent the opinions of the named analyst, not the views of this publication.
Want to Catch the Next Major ASX Gold Mining Discovery Before the Market Does?
Discovery Alert's proprietary Discovery IQ model delivers real-time alerts on significant ASX mineral discoveries, instantly cutting through complex geological and market data to surface actionable opportunities in gold and across 30+ commodities — explore the historic returns major discoveries have generated and begin a 14-day free trial to position yourself ahead of the broader market.