
July 24, 2026
The Macro Forces That Make Gold and Oil Pull in Opposite Directions
Most investors instinctively group gold and oil together as inflation-sensitive commodities that should rise in tandem when price pressures build. The reality is considerably more nuanced. When energy markets experience sharp dislocations, the downstream effects on monetary policy expectations can actually work against precious metals, creating a counterintuitive divergence that confuses even experienced market participants.
Understanding why gold falls as Brent tops $100 requires unpacking a layered transmission mechanism, one that connects crude oil prices to consumer inflation, inflation to central bank rhetoric, and central bank rhetoric to the real yields that ultimately govern gold's appeal as an asset.
When big ASX news breaks, our subscribers know first
When Energy Prices Become a Monetary Policy Problem
Oil is not simply a commodity. It is an input embedded across virtually every sector of the global economy, from transportation and manufacturing to agriculture and retail. When Brent crude crosses the psychologically significant threshold of $100 per barrel, it does not merely increase petrol costs. It recalibrates the entire inflation outlook.
The Transmission Chain From Crude to Consumer Prices
The sequence through which oil price shocks feed into broader inflation is well-documented but often underappreciated in its speed:
- Energy costs spike at the producer level, immediately pressuring margins across transport-intensive industries.
- Supply chain costs rise, as freight, logistics, and manufacturing inputs become more expensive.
- Consumer price indices accelerate, reflecting higher costs across food, goods, and services.
- Inflation expectations reprice in financial markets, with bond traders adjusting yield demands accordingly.
- Central bank policy expectations shift, with rate hike probability rising as policymakers signal commitment to controlling price growth.
It was precisely this chain reaction that gained fresh momentum when crude oil price trends showed Brent surging approximately 7% in a single session, breaching the $100 level for the first time since May following Houthi strikes on Saudi oil tankers in the Red Sea. That geopolitical escalation did not just rattle energy markets. It forced a rapid repricing of rate expectations globally.
Why $100 Brent Functions as a Market Inflection Point
The $100 threshold carries weight beyond arithmetic. Historically, sustained crude prices above this level have been associated with meaningful inflation acceleration, prompting central bank responses that tighten financial conditions. Market participants recognise this pattern, which means a breach of $100 triggers anticipatory repositioning, not just reactive adjustment.
When traders expect tighter monetary policy, they begin rotating away from non-yielding assets such as gold and toward instruments that benefit from or are protected by higher rates. This dynamic is the foundation of the current gold-oil tension.
The Real Yield Problem: Gold's Most Dangerous Adversary
To understand gold's vulnerability in this environment, the concept of real yield is essential. Real yield represents the return on fixed-income instruments after adjusting for inflation. When real yields are negative, as they were during much of 2020 and 2021, gold thrives because the cost of holding a non-yielding asset is effectively zero or even advantageous. When real yields turn positive and climb, gold faces a structural headwind.
How the Opportunity Cost Equation Works Against Bullion
| Factor | Impact on Gold | Directional Bias |
|---|---|---|
| Rising real yields | Increases opportunity cost of holding gold | Bearish |
| Stronger U.S. dollar | Makes gold costlier in other currencies, reducing demand | Bearish |
| Elevated crude oil prices | Raises inflation expectations, increasing rate hike probability | Mixed / Short-term Bearish |
| Fed rate hike probability rising | Suppresses near-term rate cut expectations | Bearish |
| Geopolitical risk premium | Supports safe-haven demand as a counterweight | Bullish |
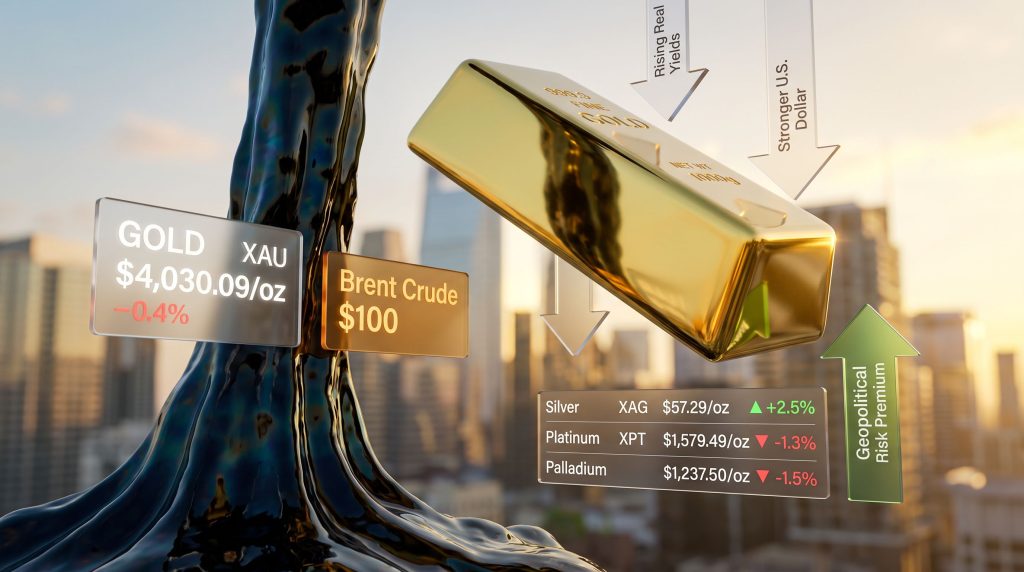
The current environment sits at the intersection of multiple bearish factors. Furthermore, spot gold eased to $4,030.09 per ounce, extending losses after a 2% decline in the prior session, with prices retreating more than $130 from a two-week high recorded just days earlier. U.S. gold futures for August delivery settled similarly lower at $4,033.20 per ounce.
Despite the near-term pressure, bullion remained on track for a modest weekly gain of 0.4%, suggesting that underlying demand has not evaporated. These gold and bond dynamics continue to shape how institutional investors position across asset classes.
The Consolidation Range and What It Reveals
Industry observers have noted that gold has been oscillating between approximately $3,980 and $4,170 per ounce for several weeks. Significant buying interest has consistently materialised near the $3,980 to $4,000 level, while selling pressure has repeatedly capped advances toward the upper bound. This range-bound behaviour reflects a genuine tug-of-war between macro headwinds on one side and durable structural demand on the other.
The persistence of buyers near $4,000 is notable. It implies that longer-term demand from central banks, institutional allocators, and physical buyers in Asia continues to underpin prices even as rate-sensitive Western investors reduce exposure.
Federal Reserve Policy and the 81% September Rate Hike Probability
Markets were positioning ahead of the next U.S. Federal Reserve policy meeting with considerable attention, given that the CME FedWatch Tool indicated approximately an 81% market-implied probability of a rate hike in September. While the upcoming meeting was broadly expected to produce no change in rates, the trajectory beyond that meeting was driving near-term gold volatility.
Why Traders Price Rate Hike Probabilities Into Gold Immediately
Gold does not pay interest or dividends. When central banks raise nominal rates at a pace that outstrips inflation, real yields rise. As those yields climb, the return available from government bonds, money market instruments, and other fixed-income products increases relative to gold, reducing the metal's competitive appeal. The forward-looking nature of financial markets means traders begin adjusting positions before rate decisions are formalised, creating price pressure in advance of any actual policy change.
The European Central Bank compounded this dynamic by signalling at its most recent meeting that another rate increase in September remained a live possibility, even as it held rates steady. Coordinated hawkishness across major central banks creates a synchronised headwind for precious metals globally, not just in U.S. dollar terms. Understanding central banks and gold helps explain why institutional positioning shifts so rapidly in response to policy signals.
Silver, Platinum, and Palladium: A Comparative Performance Snapshot
The rate-driven pressure affecting gold extended across the broader precious metals complex, though with meaningfully different magnitudes reflecting each metal's unique demand profile.
| Metal | Spot Price | Session Change | Weekly Performance |
|---|---|---|---|
| Gold (XAU) | $4,030.09/oz | -0.4% | +0.4% |
| Silver (XAG) | $57.29/oz | -0.7% | +2.5% |
| Platinum (XPT) | $1,579.49/oz | -1.3% | Negative |
| Palladium | $1,237.50/oz | -1.5% | Negative |
Silver's Outperformance: Industrial Demand as a Counterbalance
Despite silver's greater session decline relative to gold, its weekly gain of 2.5% significantly outpaced gold's 0.4% advance. This divergence reflects silver's dual identity as both a monetary metal and an industrial material. Elevated demand from the solar panel manufacturing sector, electronics, and electric vehicle components has provided silver with a demand floor that purely monetary metals like gold lack. This precious metals market analysis highlights how industrial drivers increasingly differentiate performance across the complex.
Platinum and Palladium: Industrial Exposure Cuts Both Ways
Platinum and palladium's steeper declines, with platinum falling 1.3% to $1,579.49 and palladium dropping 1.5% to $1,237.50, reflect a different risk calculus entirely. Both metals are heavily dependent on automotive sector demand, particularly catalytic converter production. When oil-driven inflation fears raise recession probabilities, industrial demand expectations deteriorate, adding a separate layer of downward pressure beyond the rate sensitivity shared with gold and silver.
Rethinking the Inflation Hedge Thesis in a Rate-Responsive World
The traditional argument for gold as an inflation hedge contains an important but frequently overlooked caveat. Gold performs well as an inflation hedge specifically when inflation is accompanied by negative or near-zero real interest rates. When oil-driven inflation prompts central banks to raise nominal rates faster than inflation itself rises, real yields can shift positive, directly undermining the conditions that make gold attractive. According to Reuters reporting on commodity markets, these sharp reversals in gold have historically occurred with remarkable speed when real yields shift decisively.
Three Scenarios That Could Reverse Current Pressure on Gold
- Scenario A: Fed Pivot Signal. If incoming economic data deteriorates materially, reducing rate hike probability, gold could recover rapidly toward the upper end of its $3,980 to $4,170 consolidation range.
- Scenario B: Geopolitical Escalation. Further disruption to Middle Eastern energy infrastructure, particularly in and around the Red Sea corridor, could trigger a flight-to-safety bid that overrides rate-driven selling.
- Scenario C: Oil Demand Destruction. If Brent crude sustaining above $100 begins to suppress global economic activity meaningfully, recession concerns could paradoxically support gold as a defensive allocation, even in a higher-rate context.
The critical distinction investors must maintain is between inflation expectations and actual inflation outcomes. Markets reprice on expectations, which means gold can face pressure before any rate hike is formally implemented, and recover before any pivot is officially announced.
The next major ASX story will hit our subscribers first
Geopolitical Risk: An Embedded Premium That Markets Cannot Ignore
The Red Sea disruptions involving Houthi attacks on Saudi oil tankers represent more than a short-term supply scare. They highlight the structural vulnerability of global energy infrastructure to regional conflict, a vulnerability that has historically provided a persistent risk premium across commodity markets.
When energy supply routes face credible threats, oil price volatility increases, feeding directly into inflation forecasts. However, the same geopolitical conditions that pressure gold through the inflation-rate channel also support gold through the safe-haven channel. Understanding these gold safe-haven dynamics is essential when interpreting the mixed-signal environment visible in current market price action, where sharp single-session declines are followed by partial recoveries. Commodity analysts at TradingView have noted similar divergent behaviour during prior episodes of Brent crude surges above key thresholds, reinforcing how different investor cohorts respond to the same news in opposite ways.
Frequently Asked Questions: Gold, Oil, and Interest Rates
Why does gold fall when oil prices rise above $100?
Higher crude oil prices intensify inflation concerns. That in turn increases the probability that central banks will maintain restrictive monetary policy or raise rates further. Because gold generates no yield, rising interest rates make competing assets more attractive, reducing gold's relative appeal and pushing prices lower.
Does rising oil always push gold lower?
Not automatically. The outcome depends on whether markets interpret the oil surge as an inflation problem requiring monetary tightening, or as a geopolitical shock requiring safe-haven positioning. Both interpretations can operate simultaneously, creating conflicting price pressures that result in the consolidation ranges observed in current market conditions. This is precisely why gold falls as Brent tops $100 in some episodes but not others.
What does the $100 Brent threshold actually mean for markets?
Beyond its numerical significance, $100 per barrel functions as a widely monitored psychological level that historically triggers reassessments of global inflation forecasts, supply chain cost structures, and central bank policy trajectories. A sustained breach typically initiates a chain of portfolio reallocation across rate-sensitive asset classes.
What is the current gold price range, and what does it indicate?
Spot gold has oscillated between approximately $3,980 and $4,170 per ounce in recent weeks. Persistent buying near the lower bound and selling near the upper bound reflects a market in equilibrium, with structural demand competing against macro headwinds in real time. Consequently, understanding when gold falls as Brent tops $100 versus when it holds firm requires tracking both the rate and safe-haven channels simultaneously.
How has silver performed relative to gold in this environment?
Silver posted a weekly gain of approximately 2.5%, notably outperforming gold's 0.4% weekly advance, demonstrating that its industrial demand characteristics provide a performance differentiator even when both metals share monetary sensitivity to interest rate changes.
Disclaimer: This article is intended for informational purposes only and does not constitute financial or investment advice. Commodity and precious metal prices are subject to significant volatility. Past performance is not indicative of future results. Investors should conduct their own due diligence and consider seeking professional financial advice before making investment decisions.
Want to Stay Ahead of the Next Major Mineral Discovery on the ASX?
Discovery Alert's proprietary Discovery IQ model delivers real-time alerts on significant ASX mineral discoveries, instantly translating complex data across 30-plus commodities into clear, actionable insights for traders and investors alike — explore Discovery Alert's historic discoveries page to see the extraordinary returns major finds have generated, and begin your 14-day free trial today to position yourself ahead of the broader market.