June 29, 2026
The Paradox Driving Gold Markets in Mid-2026
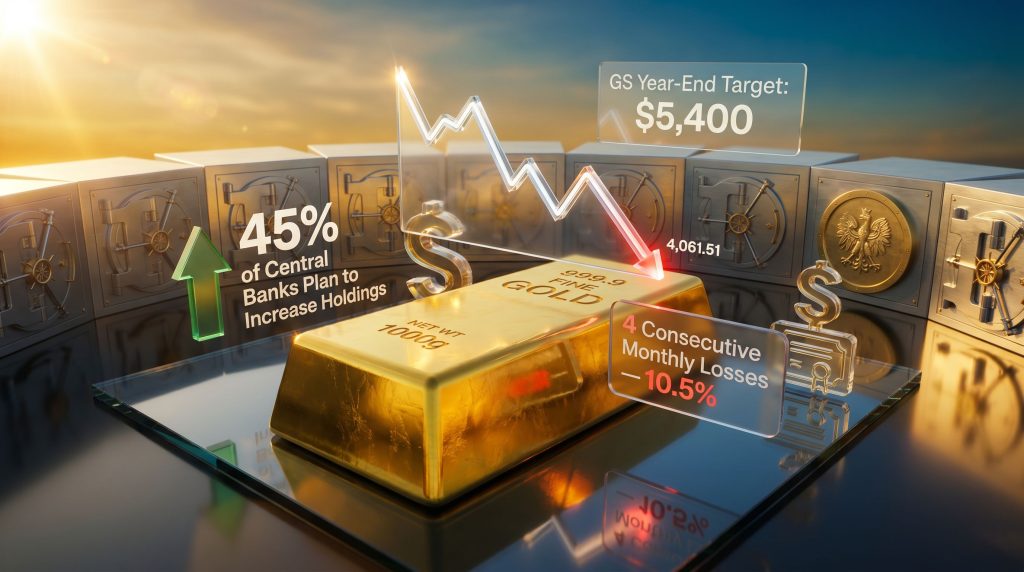
Precious metals markets occasionally produce conditions that appear to contradict conventional logic. The current environment is one of them. On one side of the ledger, gold has recorded four consecutive monthly losses, shedding 10.5% in June 2026 alone and pulling the spot price to $4,061.51 per ounce as of June 29. On the other side, institutional demand from the world's sovereign wealth managers has never been more decisively tilted toward accumulation. Understanding why both of these things are true simultaneously is the central challenge facing gold investors right now.
The phrase gold falls as Fed hike odds hit 80% and central banks keep buying captures the contradiction precisely. Two structurally opposing forces are acting on the same asset at the same time, and the outcome of their collision will shape gold's trajectory well into 2027.
When big ASX news breaks, our subscribers know first
What Is Actually Pulling Gold Lower?
The Opportunity Cost Mechanism Explained
Gold generates no yield. That single characteristic makes it extraordinarily sensitive to interest rate cycles, and the current tightening environment engineered by the Federal Reserve is exacting a significant cost on holders of the metal.
The transmission mechanism works through a logical sequence that becomes self-reinforcing once set in motion:
- The Fed signals continued tightening, or delivers an actual rate increase.
- Treasury yields rise in response, increasing the return available on risk-free US government paper.
- The US dollar strengthens as capital flows toward higher-yielding dollar assets.
- Gold becomes more expensive in non-dollar currencies, suppressing demand from international buyers.
- ETF investors and speculative traders reduce gold exposure, rotating into yield-bearing instruments.
- Spot prices fall even though physical fundamentals, mine supply, jewellery demand, and industrial consumption remain relatively stable.
This is the environment gold has been navigating since Kevin Warsh assumed the Federal Reserve chairmanship. His hawkish policy stance reversed prior market expectations for rate cuts and pushed Treasury yields materially higher. Traders have since priced approximately an 80% probability of a December 2026 rate hike, with three total hikes anticipated across the calendar year. That is a considerably more aggressive monetary path than most market participants anticipated at the start of 2026. Furthermore, the gold and bond dynamics at play here are consistent with historical tightening cycles, where rising yields reliably suppress gold's appeal.
Dollar Strength as an Amplifier
The dollar index posted a 2.5% gain in June 2026, its strongest single-month advance since July 2025, and was holding near 101.34 at month-end, approaching a 13-month high. This dollar move has a direct mechanical effect on gold prices: since gold is priced in dollars globally, a stronger dollar compresses the purchasing power of non-US buyers and reduces the relative competitiveness of gold versus local-currency alternatives.
Lloyd Chan, Senior Currency Analyst at MUFG Bank, has noted that the dollar is likely to remain well-supported in the absence of a clear dovish pivot from the Fed or a meaningful deterioration in US economic data. Neither condition appears imminent based on current indicators, which means dollar-driven gold headwinds are unlikely to dissipate in the near term without a catalyst.
The Ceasefire Effect: When Good News Is Bad for Gold
A less intuitive driver of June's gold weakness was the Iran-US ceasefire agreement, which resolved a military confrontation that had embedded a meaningful geopolitical risk premium into gold prices. When Iran and the United States agreed to halt hostilities and resume negotiations over the Strait of Hormuz, safe-haven demand that had partially cushioned gold during the conflict rapidly evaporated.
The ceasefire also had secondary effects. Reduced Middle East tension eased oil price pressure, which in turn softened near-term inflation expectations. However, the impact on Fed rate hike pricing was modest. Oil-driven inflation expectations had already reinforced the case for monetary tightening, and Tim Waterer, Chief Market Analyst at KCM Trade, has argued that the opportunity cost equation for gold remains unfavourable as long as the Fed's tightening path stays intact. The gold safe-haven dynamics observed during the conflict illustrate precisely how quickly geopolitical premiums can unwind once tensions ease.
The removal of a geopolitical risk premium does not necessarily rebalance the monetary forces weighing on gold. In June 2026, both forces were operating in the same bearish direction simultaneously.
How the Fed Rate Hike Probability Framework Works
Reading the CME FedWatch Signal
Market-implied rate hike probabilities are derived from federal funds futures contracts traded on the CME, with the FedWatch Tool providing a real-time aggregation of trader positioning. The 80% December hike probability is not a forecast from any single analyst; it reflects the collective positioning of institutional traders who have committed capital to specific rate outcomes.
In the week preceding June 29, the probability of a September hike had already surged to approximately 69% before stabilising. Three hikes priced into a single calendar year represents a materially more aggressive trajectory than was being discounted at the start of 2026, when markets were still entertaining the possibility of rate cuts. According to CNBC's gold market analysis, gold's slip to two-week lows was directly tied to these strengthening Fed rate hike bets supporting the dollar.
| Data Release | Direction of Impact on Gold |
|---|---|
| Strong ADP Employment Report | Bearish: reinforces rate hike expectations |
| Weak Nonfarm Payrolls | Bullish: could trigger dovish Fed repricing |
| Elevated CPI or Core Inflation | Bearish: extends the tightening cycle duration |
| Hawkish Fed Chair Communications | Bearish: supports dollar, compresses gold |
| Ceasefire or geopolitical de-escalation | Bearish short-term: removes safe-haven premium |
The Oil-Inflation-Gold Feedback Loop
One underappreciated dynamic in the current environment is how oil prices are functioning as an indirect driver of gold weakness. The sequence operates as follows: oil prices rise due to geopolitical risk or supply constraints, which feeds into broader inflation expectations, which strengthens the case for Fed tightening, which raises the opportunity cost of holding gold.
This feedback loop is self-reinforcing and difficult to interrupt unless oil prices reverse materially or the Fed signals tolerance for above-target inflation. Waterer has identified this connection explicitly, noting that oil-driven inflation expectations are amplifying the monetary case against gold. His conditional bull case for a return to $5,000 per ounce requires three things to align: the Gulf ceasefire must hold durably, oil must return to pre-conflict price levels, and the dollar must weaken from its current highs. As of late June 2026, none of these conditions were confirmed.
Why Central Banks Are Buying More Gold Despite Falling Prices
The 2026 World Gold Council Survey: What It Actually Shows
The World Gold Council's 2026 Central Banks Gold Reserves Survey, covering 76 central banks, revealed findings that challenge conventional assumptions about how institutional buyers respond to price weakness. In addition, central bank gold reserves data from prior years shows that this accumulation trend has been building consistently over multiple cycles.
Key findings from the survey:
- 89% of surveyed reserve managers expect global official-sector gold holdings to increase over the next 12 months.
- A record 45% of respondents plan to actively increase their own institutions' gold reserves within that period.
- The survey was largely completed after the Middle East conflict escalated, meaning the results already incorporate current geopolitical conditions.
- The fact that buying intentions held at record levels despite a 10.5% monthly price decline indicates that sovereign demand is structurally different from speculative demand.
The majority of survey participants submitted their responses after geopolitical tensions in the Middle East had already escalated. Their continued commitment to gold accumulation at elevated buying rates, against a backdrop of falling prices, speaks to the depth of the strategic rationale.
Shaokai Fan, WGC Global Head of Central Banks, has observed that the proportion of institutions treating gold as a legacy or passive holding is declining, with the majority now classifying it as an active and deliberate strategic allocation. This represents a fundamental philosophical shift in how reserve managers approach the metal. Consequently, the role of central banks influencing gold prices is becoming increasingly pronounced relative to speculative flows.
Understanding Why Sovereign Buyers Are Price-Insensitive
Central banks operate on multi-decade investment horizons. Their gold allocation decisions are driven by portfolio diversification goals, reduction of US dollar concentration risk, and the desire for an asset with no counterparty risk. A 10% price decline measured in dollars does not alter these strategic priorities.
There is also an important asymmetry in how price movements affect sovereign versus speculative buyers. A speculative fund manager faces redemption pressure if gold declines; a central bank reserve manager faces no equivalent constraint. This insulates official-sector demand from the short-term volatility that drives ETF outflows and futures positioning.
Central Bank Purchase Volumes and Vaulting Shifts
| Metric | Reported Figure |
|---|---|
| Estimated monthly central bank gold purchases (2026) | ~60 tonnes per month |
| Poland gold purchases (April 2026) | 14 tonnes (leading buyer) |
| China gold purchases (April 2026) | 8 tonnes |
| China's consecutive monthly buying streak | 18 months |
| Reserve managers expecting global holdings to rise | 89% |
| Reserve managers planning own-institution increases | 45% (record high) |
| Central banks increasing domestic storage (past 12 months) | 9% |
| Central banks diversifying overseas vaulting | 10% |
| Bank of England share of reported overseas reserves held | ~57% |
The vaulting diversification data is particularly instructive. Over the preceding 12 months, 9% of central banks expanded domestic gold storage capacity and 10% reduced their reliance on the Bank of England for overseas vaulting. The Bank of England still holds approximately 57% of reported overseas central bank gold reserves, a concentration that some reserve managers are actively working to reduce. These vaulting infrastructure decisions require years of planning and significant logistical commitment, and their continuation during falling prices confirms that accumulation strategies are not being unwound by short-term market movements.
The $4,500 to $4,600 Structural Floor
Analysts have identified a price range of approximately $4,500 to $4,600 per ounce as a structural demand floor where sovereign buyers have historically absorbed available supply with sufficient consistency to prevent sustained downside. This is not a guaranteed support level in the mathematical sense, but it reflects the observed behaviour of institutional buyers during recent price weakness.
Goldman Sachs maintains a year-end 2026 gold price target of $5,400, anchored by the expectation that reserve diversification demand will remain robust even as monetary headwinds persist. This forecast carries significant uncertainty and should not be treated as a base case by individual investors without independent analysis. According to JP Morgan's commodities research, structural demand drivers similarly underpin their long-term constructive outlook on the metal.
Disclaimer: Price targets and analyst forecasts represent opinions, not guarantees. Past performance and institutional buying patterns do not guarantee future price outcomes.
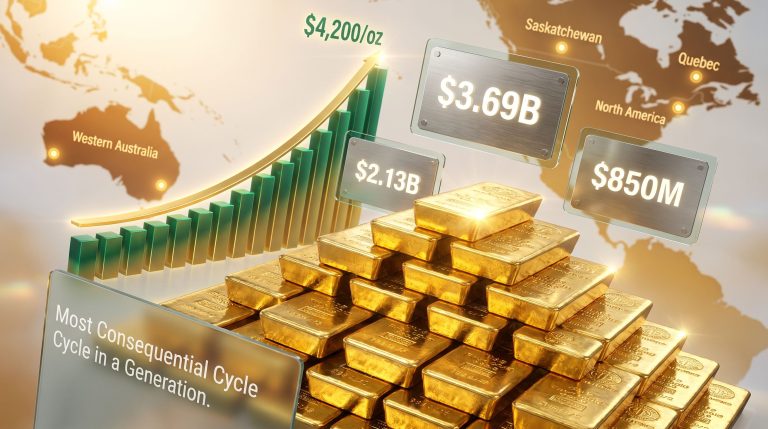
How the Price Decline Affects Producers, Royalty Companies, and Streamers
Spot Exposure and the Margin Compression Problem
For producers selling output at prevailing spot prices, a sustained 10.5% monthly decline translates directly into compressed operating margins. The severity of this compression depends on each producer's all-in sustaining cost (AISC), which varies substantially across the industry.
- Low-cost producers with AISC well below $3,500 per ounce retain meaningful margins even at current spot prices.
- Mid-tier producers operating with AISC in the $3,500 to $4,000 range face significant margin pressure.
- High-cost or junior producers near the margin of profitability may find operations economically challenged at $4,061 spot.
Why Royalty and Streaming Structures Offer Differentiated Resilience
Royalty and streaming contracts are frequently priced using trailing average gold prices rather than real-time spot rates. This lagged pricing mechanism insulates royalty and streaming companies from the acute volatility that directly affects spot-exposed producers. During multi-month price declines like the current one, gold's impact on miners diverges meaningfully depending on the business model in question.
| Business Model | Price Exposure | Margin Risk in Downturn | Upside Recovery Leverage |
|---|---|---|---|
| Spot-price producer | Direct, real-time | High | High |
| Royalty company | Lagged, averaged | Low-to-moderate | Moderate |
| Streaming company | Contractual fixed cost | Low | Moderate-to-high |
Where Silver, Platinum, and Palladium Sit in This Environment
The June 2026 precious metals complex revealed a meaningful divergence in performance across the group that reflects the different demand drivers underpinning each metal.
- Spot silver fell 0.9% to $58.64 per ounce, amplifying gold's directional move with slightly greater percentage weakness. Silver's dual role as both a monetary metal and an industrial input creates a complex demand structure, but its correlation with gold during monetary tightening cycles tends to be high.
- Platinum gained 0.1% to $1,616.55 per ounce, demonstrating marginal resilience driven by industrial demand from autocatalyst and hydrogen applications.
- Palladium rose 1.0% to $1,221.29 per ounce, outperforming the complex on the back of sustained autocatalyst demand from the automotive sector.
The performance divergence between monetary metals like gold and silver versus industrial metals like platinum and palladium illustrates a broader point: Fed policy sensitivity is not uniform across the precious metals complex. Investors seeking precious metals exposure during a tightening cycle may find that platinum group metals offer differentiated risk characteristics worth examining.
The next major ASX story will hit our subscribers first
Scenario Analysis: Three Paths Forward for Gold
Base Case: Sustained Pressure Through the Rate Hike Cycle
If the Fed delivers all three anticipated 2026 rate hikes, the dollar maintains its June gains, and no significant geopolitical shock emerges, gold is likely to remain range-bound below $4,200 through the third quarter of 2026. Central bank buying will provide a floor but is unlikely to generate sufficient upward price momentum to reverse the trend in this environment. This is precisely the scenario in which gold falls as Fed hike odds hit 80% and central banks keep buying continues to define market conditions.
Bull Case: Dovish Pivot or Data Deterioration
A material weakening in US employment data could force the Fed to pause or signal a reversal of its tightening trajectory. If nonfarm payrolls or ADP data disappoint significantly, the dollar could retreat from its 13-month highs, rate hike probabilities would compress, and gold could recover toward the $4,500 to $4,600 structural floor range identified by analysts. Goldman Sachs's $5,400 year-end target becomes achievable under this scenario, though it remains conditional.
Tail Risk: Geopolitical Re-escalation
A resumption of Middle East hostilities or a new geopolitical flashpoint would reintroduce safe-haven demand rapidly. The outcome would depend on whether the Fed interpreted any re-escalation as primarily inflationary, supporting continued tightening, or as a growth shock requiring accommodation. Oil price behaviour in such a scenario would be the key interpretive variable.
The Long-Term Structural Picture That Short-Term Traders May Be Discounting
Gold's correction from its January 2026 record high of approximately $5,594 per ounce to the current $4,061 represents a roughly 27 to 29% drawdown from peak levels. Historical analysis of gold corrections during tightening cycles shows that price declines of this magnitude have frequently preceded multi-year recovery phases once monetary policy eventually pivots.
The structural demand argument that survives this downturn rests on three pillars:
- Near-unanimous institutional conviction: 89% of reserve managers expecting global gold holdings to rise is not a marginal signal. It reflects a consensus that crosses geographies, institutional mandates, and reserve sizes.
- A generational shift in reserve philosophy: The transition from treating gold as a passive legacy holding to classifying it as an active strategic allocation represents a durable change in how central banks manage national balance sheets.
- A large and consistent demand baseline: Approximately 60 tonnes of monthly central bank purchases creates a demand floor that is structurally larger than at any point in the previous decade.
The current market presents a textbook collision between short-term monetary headwinds and long-term structural demand. The resolution will not be determined by which force is stronger in absolute terms, but by which proves more durable over a multi-year horizon. On that timeframe, the weight of evidence increasingly favours the structural buyers.
This article is intended for informational and educational purposes only. Nothing contained herein constitutes investment advice. Gold price forecasts referenced in this article represent analyst opinions and carry material uncertainty. Readers should conduct their own due diligence before making any investment decisions.
Want To Stay Ahead of Major ASX Mineral Discoveries During Volatile Markets?
While gold markets navigate the tension between Fed tightening and record central bank accumulation, Discovery Alert's proprietary Discovery IQ model delivers real-time alerts on significant ASX mineral discoveries — instantly translating complex data into actionable opportunities for investors at every level. Explore historic discoveries and their exceptional returns, then begin your 14-day free trial to position yourself ahead of the market.