May 12, 2026
When Inflation Refuses to Cooperate: Gold, Oil, and the Fed's Narrowing Options
Monetary policy frameworks are built on assumptions. The assumption that energy shocks are transitory. The assumption that wage growth moderates before inflation becomes entrenched. The assumption that the Fed can cut when growth softens or hike when prices accelerate, without being trapped by the simultaneous presence of both problems. The current macroeconomic environment is systematically dismantling each of those assumptions, one data release at a time, and gold and the data the Fed can't ignore are increasingly converging into a single, complicated story.
When big ASX news breaks, our subscribers know first
The Inflation Print That Changed the Calculus
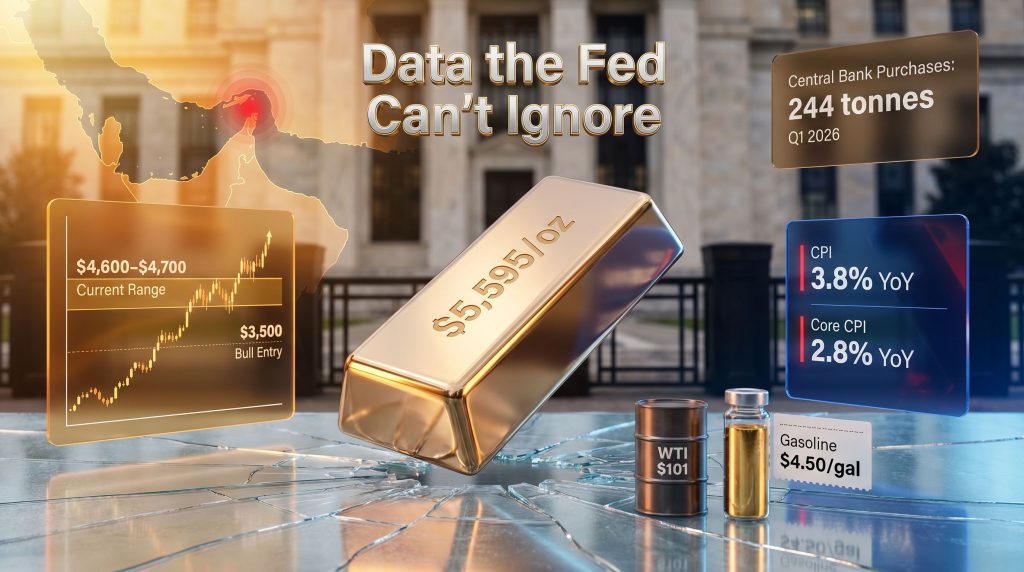
April's Consumer Price Index report landed above consensus on every meaningful measure. Headline CPI reached 3.8% year-over-year, exceeding the 3.7% forecast. Core CPI, the measure that strips out food and energy and therefore captures the stickier, more policy-relevant components of inflation, came in at 2.8% year-over-year, above the 2.7% expectation. On a month-over-month basis, core CPI rose 0.4% against a 0.3% consensus estimate.
These are not rounding errors. They represent a consistent pattern of inflation running hotter than professional forecasters anticipated, which itself carries an important signal: the models used to project inflation are systematically underestimating the persistence of current price pressures. Furthermore, two-year yield signals have reinforced the view that markets are pricing in prolonged policy uncertainty.
Stagflation by Numbers
What makes this inflation episode particularly difficult for policymakers is not just its level but its composition. Real average hourly wages declined 0.5% month-over-month and 0.3% year-over-year, meaning workers are experiencing purchasing power erosion even as the nominal economy appears to be running warm. Shelter inflation accelerated to 3.3% from 3.0% the prior month, confirming that the most significant component of household budgets remains under upward pressure.
This combination defines the stagflationary squeeze:
- Prices rising faster than incomes
- Real consumption capacity declining
- Services inflation remaining sticky despite elevated borrowing costs
- Policy tools poorly suited to address both simultaneously
The Fed's dilemma is structural: cutting rates risks re-accelerating inflation, while hiking risks tipping a labour market already showing real wage compression into genuine contraction. Neither option resolves the underlying problem.
Energy Price Passthrough: The Mechanism Most Analysts Underestimate
The energy components of April's CPI were striking in their magnitude. Overall energy costs rose 17.9% year-over-year, accelerating sharply from 12.5% in March. Gasoline surged 28.4% compared with 18.9% the prior month. Fuel oil registered a 54.3% annual increase. Diesel costs are up 61.0% year-over-year. Airline fares, which directly reflect jet fuel costs, climbed 14.9% annually.
| Energy Category | Year-over-Year Change | Prior Month |
|---|---|---|
| Overall Energy | +17.9% | +12.5% |
| Gasoline | +28.4% | +18.9% |
| Fuel Oil | +54.3% | N/A |
| Diesel | +61.0% | N/A |
| Airline Fares | +14.9% | N/A |
These figures explain how core inflation is being contaminated despite technically excluding energy. The passthrough mechanism works through supply chains, transport costs, and services pricing rather than through direct energy line items. A business paying 61% more for diesel doesn't absorb that cost in isolation; it redistributes it across every product and service it delivers.
Oxford Economics has noted that energy cost spillovers into core inflation typically peak approximately three months after the initial shock. With the current energy disruption originating in late February, the peak passthrough window falls in late May through early June. This framing suggests that the April CPI print represents the beginning of the worst passthrough period, not its resolution.
Oil Above $100 and the Normalization Timeline Stretching to 2027
Crude oil price trends show WTI crossing back above $101 per barrel, with Brent trading above $107, reversing the brief dip below $100 that had been driven by diplomatic deal optimism the prior week. That selloff reversed within days, consistent with a recurring pattern in which geopolitical progress narratives temporarily suppress energy prices before structural supply realities reassert themselves.
The CEO of the world's largest oil producer, Aramco's Amin Nasser, stated during the company's Q1 2026 earnings call that even under the most optimistic scenario, meaning an immediate reopening of the Strait of Hormuz, the oil market would require months to rebalance. If the closure extends into June, which reflects the current base case given the absence of any imminent diplomatic resolution, normalisation timelines extend into 2027.
This framing carries profound implications for inflation forecasting:
- Energy passthrough into core CPI will continue throughout the remainder of 2026
- The Federal Reserve's path to its 2% inflation mandate becomes structurally longer
- Rate cuts remain politically and data-incompatible
- The probability of a rate hike, rather than a cut, begins entering serious market consideration
National average gasoline prices are currently sitting at $4.50 per gallon, ensuring that energy inflation remains a daily lived experience for consumers rather than an abstraction on a spreadsheet.
The Flag Pattern and the $170 Oil Projection
From a technical standpoint, crude oil's price structure merits serious attention. Flag patterns in commodity markets historically resolve in the direction of the preceding trend, with the post-flag move approximating the magnitude of the initial impulse. Crude oil's prior rally ran from approximately $55 to $120. If a comparable move is underway from the April low, a projection toward $170 per barrel emerges over the weeks and months ahead.
That level would represent a breakout to all-time highs, a development that no economy, central bank, or equity market could price in as a contained, temporary phenomenon.
The Fed's Rate Expectations Collapse: From One Cut to Zero to Possible Hike
At the start of 2026, consensus market pricing incorporated at least one Federal Reserve rate reduction during the year. That expectation has been completely eliminated. CME FedWatch data now reflects:
- Zero rate cuts priced for 2026
- Fed funds rate held at 3.5-3.75%
- Probability of a rate hike by December 2026 above 9%
This repricing represents one of the most significant shifts in interest rate derivative positioning in the current cycle. The Fed finds itself in what analysts increasingly describe as a two-sided risk environment, where upside inflation risks and downside employment risks are simultaneously elevated, making any decisive policy action carry equal and opposite dangers.
Compounding this challenge is the fiscal backdrop. US federal debt has exceeded 125% of GDP, with publicly held debt above 100% for the first time since 1946. The concept of fiscal dominance — the condition where debt sustainability concerns begin constraining monetary policy independence — is no longer a theoretical concern but an increasingly operative constraint. Some FOMC projections now show inflation remaining above 2.5%, with certain scenarios projecting as high as 4%. For a detailed breakdown of how these dynamics interact, gold and bond dynamics provide important context for understanding the broader cycle.
Gold's Short-Term Technical Setup: Bearish Signals Within a Structural Bull Market
Understanding the current gold market requires separating two distinct analytical timeframes that are pointing in opposite directions.
Near-Term Technicals: The Fibonacci Ceiling
In the short term, gold's price action is sending bearish signals. The metal has repeatedly failed to sustain a breakout above its 61.8% Fibonacci retracement level, one of the most widely monitored technical boundaries in financial markets. The rapid invalidation of a move above the prior May high added a second confirming signal that near-term momentum is negative.
| Technical Signal | Implication |
|---|---|
| Failed 61.8% Fibonacci retracement | Near-term ceiling confirmed |
| Rapid invalidation of May high breakout | Bearish momentum continuation |
| USD Index breaking above declining resistance | Headwind for gold pricing |
| GDXJ erasing prior session gains | Mining equity weakness confirms metal weakness |
Spot gold is trading in the $4,600-$4,700 per ounce range, having retreated from the January 2026 all-time high of $5,595 per ounce. Key technical support levels to monitor include:
- $4,550: Primary near-term support
- $4,250-$4,380: Secondary support band and medium-term floor
- $3,900-$4,100: Deep structural support representing a washout scenario floor
- $3,500: Long-term bull market accumulation zone
The Dollar Symmetry That Could Cascade Through Commodities
The US Dollar Index is exhibiting a technical structure that analysts have compared to the pattern preceding the dollar's significant rally from its April 2025 low. If this symmetry holds and the dollar breaks convincingly above its near-term declining resistance line, the implications cascade through commodity markets via a well-established pricing channel:
- Dollar strengthens, making gold more expensive for foreign buyers priced in local currencies
- International demand softens, exerting downward price pressure
- Commodity prices broadly decline, compressing mining sector revenues
- Risk-off sentiment deepens, reducing speculative long positioning in metals futures
The next major ASX story will hit our subscribers first
Silver's Speculative Surge and What the One-Day Reversal Reveals
Silver's 5%-plus single-session surge, followed by a near-complete reversal the following day, offers a textbook example of a pattern that experienced precious metals traders recognise as speculative froth rather than structural accumulation. When thinner, less liquid metals significantly outperform gold on a short-term basis, the divergence typically reflects momentum-driven positioning rather than a genuine shift in underlying macro conditions.
| Metal | Prior Session | Following Session |
|---|---|---|
| Silver | +5%+ surge | Declined sharply |
| Platinum | Sharp rally | Declined |
| Palladium | Modest gains | -2%+ |
| Gold | Flat | -1%+ |
The reversal pattern is worth noting for its predictive track record. The same sequence preceded the March 2026 decline, the mid-April GDXJ crash, and the late April selloff. Recognising thin-metal outperformance followed by broad reversal as a leading indicator provides a meaningful edge in near-term positioning decisions.
However, this does not diminish the genuine fundamental case for silver. COMEX registered inventories stand at 79.8 million ounces, the market has experienced six consecutive years of supply deficit, and active May delivery windows reinforce physical tightness. Physical tightness in the underlying commodity cannot reliably override the macro trading channel when dollar strength and rate expectations are the dominant price determinants.
Geopolitical Wildcards: Why Diplomatic Optimism Keeps Failing to Hold
High-level diplomatic engagement between major powers generates consistent short-term volatility in commodity markets, particularly when deal proximity narratives drive brief oil selloffs. Analysts at institutions including the Brookings Institution and the Peterson Institute have framed the realistic best-case outcome of major summits in the current environment as avoiding a fresh escalation rather than achieving a structural breakthrough.
The anticipated transactional outcomes from US-China engagement illustrate the gap between headline announcements and structural resolution:
| Category | Expected Announcement | Structural Reality |
|---|---|---|
| US Energy Purchases | China to announce US energy buys | Does not address Hormuz constraint |
| Agricultural Trade | Boeing and agricultural deals | Transactional, not strategic |
| Rare Earth Minerals | Truce extension expected | Leverage retention, not resolution |
| Iran Pressure | US seeking Chinese influence | China's incentives favour leverage |
China's structural incentives in the current geopolitical configuration point toward retaining Iran as a source of leverage over the United States rather than delivering a diplomatic resolution that would primarily benefit Washington's inflation problem. The pattern of oil price corrections driven by deal optimism reversing within approximately one week has repeated consistently throughout the current episode, making it a high-risk positioning error to treat diplomatic-driven commodity selloffs as durable.
The Long-Term Structural Case: Why Gold Defied Rate Hikes and May Do So Again
The short-term bearish technical picture for gold exists within a long-term structural environment that remains fundamentally constructive. The most important historical precedent is the 2022-2023 Federal Reserve tightening cycle — the most aggressive in four decades — which lifted the federal funds rate from near zero to 5.5%. Conventional financial theory predicted that such aggressive tightening would weigh heavily on gold, a non-yielding asset whose opportunity cost rises as interest rates climb.
Instead, gold reached $5,595 per ounce in January 2026, a nominal all-time high, demonstrating that the traditional inverse relationship between rates and gold prices is not a deterministic law but a conditional relationship that breaks down when structural demand forces are sufficiently powerful. Indeed, gold as an inflation hedge has proven far more resilient than many conventional models suggested.
Three macro forces underpin that structural demand:
- Central bank accumulation: 244 tonnes purchased in Q1 2026 alone, reflecting institutional diversification away from dollar-denominated reserve assets. In fact, central bank gold buying has become one of the most powerful structural tailwinds underpinning prices
- Fiscal dominance: US debt exceeding 125% of GDP creates long-term credibility risk for the dollar as a stable store of value
- De-dollarisation: Emerging market central banks systematically increasing gold's share of reserve portfolios
Gold's long-term price trajectory is ultimately determined by the interaction of real yields, dollar credibility, and structural demand forces. When fiscal constraints erode confidence in the Fed's ability to maintain price stability without compromising debt sustainability, gold's role as a monetary reserve asset strengthens independently of the nominal rate environment.
Consequently, analysts tracking gold and the data the Fed can't ignore have increasingly noted that the metal's behaviour is less about short-term rate moves and more about systemic confidence in policy frameworks. As FX Empire's recent analysis highlights, the Fed is confronting a data environment that leaves it with few clean options. Furthermore, GoldSilver's reporting on gold's 41% rise underscores just how dramatically the metal has outperformed expectations even amid aggressive monetary tightening.
Three Scenarios for Gold Through 2026
Scenario 1: Stagflation Deepens, Fed Remains Frozen
Oil holds above $100 through Q3 2026. Core CPI prints above 3% in May and June. No rate cuts materialise and hike probability rises above 20%. Gold consolidates at current levels before resuming its uptrend as the fiscal dominance narrative strengthens and central bank accumulation continues.
Scenario 2: Dollar Breakout, Short-Term Gold Correction
The USD Index breaks above declining resistance with conviction. Gold tests the $4,250-$4,380 support band. Mining equities decline 15-25% from current levels, creating a structural buying opportunity for investors with longer time horizons and defined entry criteria.
Scenario 3: Geopolitical Resolution, Oil Normalization
The Strait of Hormuz reopens and oil retreats toward $75-$85 per barrel. The inflation trajectory moderates and the Fed regains rate-cutting optionality. Gold's geopolitical premium compresses, however central bank buying and fiscal dominance provide a durable structural floor above $3,500. In each scenario, gold and the data the Fed can't ignore remain inseparable from the broader macro narrative shaping 2026.
Disclaimer: This article is provided for informational and educational purposes only and does not constitute financial advice. All forecasts, price targets, and scenario projections involve significant uncertainty and should not be construed as recommendations to buy or sell any financial instrument. Past performance is not indicative of future results. Readers should conduct their own research and consult qualified financial advisers before making investment decisions.
Want To Position Ahead Of The Next Major Mineral Discovery?
Discovery Alert's proprietary Discovery IQ model delivers real-time alerts on significant ASX mineral discoveries, instantly translating complex data across 30-plus commodities into actionable insights for both short-term traders and long-term investors — start your 14-day free trial today and explore the historic returns major discoveries have generated to understand what early positioning can mean for your portfolio.