June 11, 2026
The Inflation Paradox Trapping Gold Between $4,000 and the Fed's Next Move
Commodity markets have long operated on a deceptively simple principle: when the purchasing power of fiat currency erodes, hard assets appreciate. Gold built its multi-decade reputation on exactly that logic. Yet the mid-2026 environment has shattered that neat framework, presenting a situation where the very inflation that should be propelling gold higher is simultaneously arming the Federal Reserve with justification to raise interest rates and cap the metal's upside. Understanding how fed rate hike odds pressure gold above $4,000 requires unpacking the layered, sometimes contradictory forces now competing for control of price direction.
When big ASX news breaks, our subscribers know first
How CME FedWatch Probabilities Shape Institutional Gold Positioning
Most retail investors track gold through spot price movements and headline news. Institutional positioning, however, is driven by a more precise input: the probability distribution of Federal Reserve policy decisions derived from Fed Funds futures contracts. The CME FedWatch Tool aggregates these futures prices into market-implied probabilities, and those numbers have become one of the most closely watched inputs in gold market analysis.
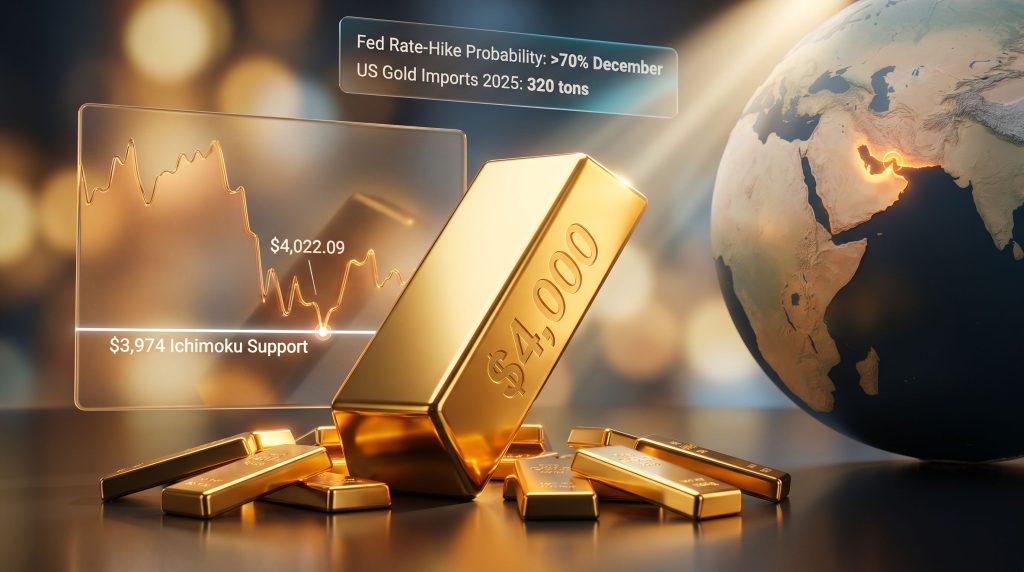
As of June 2026, markets were pricing in a greater than 70% probability of a Fed rate hike by December, with October odds sitting near 42%. These are not marginal readings. When hike probabilities breach 70%, institutional risk models begin systematically reducing exposure to non-yielding assets, and gold occupies the top of that list.
The mechanism is rooted in opportunity cost. Gold generates no income. When risk-free rates rise, the implicit cost of holding gold increases relative to Treasury instruments or money market funds. A 70%-plus probability of a December hike means the market is essentially treating that hike as baseline, not tail risk, and positioning accordingly.
Key Insight: Market-implied rate-hike probabilities consistently drive gold positioning adjustments before the Fed actually moves. By the time a hike is formally announced, much of the downward pressure on gold has already been priced in through this futures-driven mechanism.
What makes the 2026 situation analytically complex is that May CPI rose at its fastest pace in three years, driven substantially by energy costs following geopolitical disruptions in the Middle East. This was not the kind of wage-driven, demand-pull inflation that the Fed has historically addressed most aggressively. It was supply-side and energy-led, creating a genuine policy dilemma. Furthermore, gold as an inflation hedge becomes considerably more complicated when the same inflation triggers rate responses that suppress gold's upside.
Historical Rate Cycles and Gold: What the Precedents Show
Gold's response to rate-hike cycles is not uniform. The determining factor is whether real interest rates (nominal rates adjusted for inflation expectations) are rising or falling alongside nominal hikes.
- During the 2004 to 2006 hiking cycle, gold actually appreciated as inflation ran ahead of rate increases, keeping real rates low or negative
- During the 2022 aggressive tightening cycle, gold fell sharply as real rates moved decisively into positive territory
- In stagflationary environments, where growth stalls while inflation persists, gold has historically been the strongest performing major asset class
The 2026 environment most closely resembles a hybrid: energy-driven inflation creating CPI pressure while broader economic growth signals remain mixed, leaving the Fed with limited clean options. In addition, gold and bond dynamics in this environment suggest that rising yields are compressing gold's relative appeal across multiple asset classes simultaneously.
From Oil Shock to Rate Table: How Energy Inflation Transmits Through the Economy
The sequence of events that placed gold under sustained pressure in mid-2026 began with a geopolitical catalyst. Iran's announcement of the Strait of Hormuz closure following US military strikes introduced a classic supply-side oil shock into an economy already sensitive to inflation data. The transmission pathway from that disruption to gold market stress follows a predictable chain.
Higher crude oil prices flow through to Producer Price Index (PPI) readings first, elevating costs for transportation, manufacturing inputs, and energy-intensive operations. Those upstream cost pressures then migrate into CPI as businesses pass through higher costs to consumers. Rising CPI readings increase Fed rate-hike probabilities, which strengthens the US dollar, which in turn applies downward pressure on gold priced in those stronger dollars.
This creates what market analysts describe as the inflation paradox for gold:
| Inflation Type | Fed Response | Gold Impact | USD Impact |
|---|---|---|---|
| Energy/Supply-Side | Reluctant hikes | Mixed: hedge demand vs. rate pressure | Moderate strengthening |
| Demand-Pull | Aggressive hikes | Bearish: rate premium dominates | Strong appreciation |
| Stagflationary | Policy paralysis | Bullish: safe-haven premium surges | Weakening |
| Energy + Geopolitical | Constrained response | Contested: dual forces competing | Volatile |
The current environment sits in the fourth category, where energy inflation and geopolitical risk are operating simultaneously with elevated rate expectations. Gold receives safe-haven demand from one direction while facing rate-driven selling pressure from another, producing the contested, range-bound price action observed around the $4,000 level. According to recent Fed rate hike analysis from ATFX, this tug-of-war dynamic has been amplified by stronger-than-expected jobs data reinforcing the hawkish policy outlook.
Is $4,000 a Structural Floor or a Psychological Threshold?
Gold's intraday low on June 11, 2026 registered at $4,022.09, its weakest point since November 2025, before recovering 0.7% to $4,103.74 ahead of the May PPI release. That $22 buffer above the $4,000 round number carries genuine analytical significance. It indicates that buyers entered the market in sufficient volume near a widely monitored level to arrest the decline, suggesting active price defence rather than passive support.
Round numbers in commodity markets function as coordination points for diverse market participants. Options traders, risk managers, and systematic funds all reference $4,000 as a threshold that triggers position adjustments. When price approaches such levels, buying activity tends to cluster, creating self-reinforcing support, at least temporarily.
The more technically rigorous support level, however, sits at $3,974 per ounce, the top boundary of the weekly Ichimoku cloud. This is the level identified by UOB analyst Quek Ser Leang as the next significant support zone should $4,000 fail to hold.
The Ichimoku Cloud Framework: Why $3,974 Matters
The Ichimoku Kinko Hyo system is one of the more comprehensive technical frameworks applied to commodity markets, incorporating trend direction, momentum, and support/resistance into a single integrated structure. The cloud component, formed by two leading span lines projected forward in time, identifies zones where buying and selling pressure have historically converged.
The weekly timeframe application is particularly significant because it filters out short-term noise and reflects the positioning of longer-duration participants, including institutional funds and macro-oriented hedge funds. A weekly close below $3,974 would represent a meaningful technical deterioration, signalling that the dominant market structure has shifted from consolidation to a broader corrective phase.
Compounding this concern, weekly stochastic oscillators for gold remained above oversold territory as of June 11. This is technically unfavourable in a corrective environment: it means selling momentum had not yet been exhausted, leaving open the possibility of additional downside before a genuine technical buy signal emerges.
Technical Watch: Until weekly stochastics print a confirmed oversold reading and begin recovering, any bounce toward $4,100 or above should be treated as a potential retracement within a broader downtrend rather than evidence of a sustained reversal.
Why the PPI Release Carries More Weight Than CPI Right Now
Consumer Price Index data captures inflation at the retail level. Producer Price Index data captures it upstream, measuring price changes at the wholesale and manufacturing stage. Because PPI tends to lead CPI by several weeks, a May PPI beat in 2026 would signal that further consumer inflation pressure was still building in the pipeline, even if the May CPI reading had already been processed by markets.
With December rate-hike odds already above 70%, a PPI surprise to the upside would accelerate that probability higher, potentially pushing it toward 85% or above. That incremental shift in probability would likely trigger additional gold selling and further USD strength.
Three PPI Scenarios and Their Gold Market Implications
Scenario 1: PPI Exceeds Forecasts
- Fed rate-hike probability rises further toward 85%+
- USD index likely recaptures post-CPI highs
- Gold tests $3,974 Ichimoku support with potential extension toward $3,888
- Mining sector margins compress further on dual pressure of lower gold revenue and higher fuel costs
Scenario 2: PPI Matches Forecasts
- Rate-hike odds remain elevated but stable near 70%
- Gold consolidates between $4,000 and $4,100
- $3,974 remains the key downside reference but is not immediately tested
- USD momentum stalls, providing mild relief for gold
Scenario 3: PPI Misses Forecasts
- Rate-hike expectations soften, December probability drops below 60%
- Gold recovers toward the $4,200 to $4,300 range
- Central bank demand and geopolitical risk premium re-emerge as dominant price drivers
- Technical picture improves if gold achieves two consecutive weekly closes above $4,100
What the US Gold Import Surplus Reveals About Structural Demand
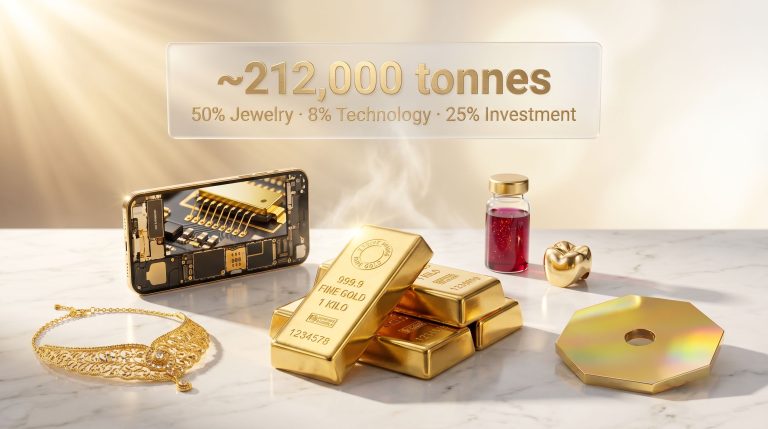
One of the less-discussed but analytically significant data points in the current gold market is the substantial gap between US gold imports and domestic consumption. According to USGS data, US gold imports for consumption reached 320 tons in 2025, while reported domestic end-use consumption totalled approximately 150 tons, a discrepancy of 170 tons.
This gap is not explained by jewellery demand, industrial applications, or dental use, all of which are captured in domestic consumption figures. The surplus instead reflects accumulation by financial institutions, exchange-traded funds, and strategic buyers who absorbed this gold at prices generally above the June 2026 spot level.
The investment implication is meaningful. Entities that purchased gold at prices above the current spot level have a financial incentive to defend those positions, either by adding to holdings on weakness or by absorbing selling pressure through their existing long exposure. This creates a structural demand floor near $4,000 that is distinct from, and potentially more durable than, technically driven support.
Investor Consideration: The 170-ton import surplus represents a substantial volume of gold held at an average cost basis likely well above $4,000. This embedded long position provides genuine structural support, but it also means that if sentiment deteriorates sufficiently, the unwinding of those positions could amplify selling pressure rather than absorb it.
The next major ASX story will hit our subscribers first
US Gold Production Economics: Margin Squeeze in a High-Cost Environment
The pressure on gold prices does not affect all producers equally, and understanding the cost structure of US gold mining reveals important nuances for investors evaluating producer-level exposure.
US mine output declined marginally from 163 tons in 2024 to 160 tons in 2025, yet the sector's total production value surged 32% to $17 billion, a direct consequence of elevated gold prices compensating for volume shortfalls. That arithmetic works well when prices are high. It becomes precarious when prices fall while costs simultaneously rise. Consequently, the gold price impact on miners in this environment is particularly pronounced for operators with above-average all-in sustaining costs.
The geographic concentration of US production amplifies this vulnerability:
- Nevada and Alaska combined account for 86% of total US gold output, creating a supply base exposed to regional regulatory, environmental, or operational disruptions
- The remaining 14% is distributed across multiple states with generally higher per-ounce production costs
- Approximately 7% of US gold production is derived as a byproduct of copper mining operations, giving those producers a natural revenue hedge that pure-play gold miners lack
The byproduct credit dynamic is particularly relevant in the current environment. When oil prices rise, mine operating costs increase across the board, affecting fuel for heavy equipment, explosives containing ammonium nitrate (which is energy-intensive to produce), and ore transport logistics. For pure-play gold operations, this cost pressure arrives simultaneously with the revenue headwind of lower gold prices. For copper-gold operations, byproduct copper revenues partially offset the margin compression, making them structurally more resilient.
Central Bank Demand vs. Fed Tightening: A Question of Time Horizons
Central bank gold demand has been a defining feature of the post-2022 monetary landscape. Sovereign institutions across emerging markets, and increasingly among developed nation reserve managers, have been adding gold to diversify away from US dollar reserve concentration. This persistent buying provides a baseline demand floor that has prevented gold from revisiting the sub-$2,000 levels seen in previous rate-hike cycles.
However, the critical distinction is one of time horizon. Central bank buying operates on annual budget cycles and long-duration reserve management frameworks. Fed rate-hike probability adjustments operate on weekly or even daily timeframes. In the short run, the rate-hike pricing mechanism dominates. Over months and years, central bank accumulation reasserts its influence.
| Historical Period | Rate Environment | Geopolitical Context | Gold Outcome |
|---|---|---|---|
| 2022 | Aggressive hiking cycle | Russia-Ukraine conflict | Initial rally, then sustained decline |
| 2018 | Gradual hiking cycle | US-China trade tensions | Multi-month correction |
| 2011 | Near-zero rates | Middle East instability | Multi-year bull market |
| 2026 (Current) | Hike odds above 70% | Strait of Hormuz closure | Consolidation contested near $4,000 |
Risk Matrix: Key Catalysts and Warning Signals for the Second Half of 2026
Bearish Catalysts to Monitor:
- Sequential PPI and CPI beats sustaining Fed rate-hike probability above 70%
- A confirmed December rate hike accompanied by forward guidance signalling further tightening
- US dollar index breaking decisively above its post-CPI resistance level
- Weekly gold close below $3,974, triggering systematic technical selling from momentum-driven funds
Bullish Catalysts to Monitor:
- Inflation data softening through Q3 2026, reducing December hike probability below 50%
- Geopolitical escalation in the Middle East intensifying safe-haven demand beyond what rate expectations can suppress
- Acceleration of central bank gold purchases beyond current annual pace
- USD weakness driven by deteriorating US growth expectations
Key Metrics for Ongoing Monitoring:
- CME FedWatch December rate-hike probability (current baseline: above 70%)
- US Dollar Index position relative to post-CPI resistance
- Weekly gold stochastic oscillator for oversold signal confirmation
- Sequential monthly PPI and CPI trend through Q3 2026
- Nevada and Alaska operational updates given their 86% production concentration
FAQ: Gold, Fed Rate Hikes, and the $4,000 Level Explained
Does a Fed rate hike automatically push gold prices lower?
Not necessarily. Gold's response depends on whether real interest rates are rising or falling. When inflation outpaces nominal rate increases, real rates remain negative or low, historically a supportive environment for gold. The current scenario is complicated by energy-driven inflation, which may not be fully responsive to Fed tightening, keeping real rate dynamics uncertain.
Why does the $4,000 level carry such significance beyond psychology?
The round number matters partly for psychological reasons, but the more durable significance is that it approximates the average cost basis of substantial gold accumulation by US financial institutions during 2025, when the import-consumption gap of 170 tons represents inventory built at prices near or above current spot. This embedded long position creates structural demand that reinforces the psychological threshold.
What makes the Ichimoku cloud support at $3,974 technically credible?
The weekly Ichimoku cloud integrates price history across multiple timeframes to identify equilibrium zones. The cloud top at $3,974 represents a confluence of support from both the trend-following and momentum components of the system. Crucially, weekly timeframe signals filter out the noise that dominates daily charts and better reflect the positioning of institutional market participants whose movements ultimately determine trend direction.
How does rising oil specifically hurt gold miners beyond the revenue side?
Mining operations are among the most energy-intensive industrial activities. Diesel fuel powers haul trucks, excavators, and ore processing facilities. Ammonium nitrate, a primary blasting explosive, is derived from natural gas, so energy price spikes directly increase drilling and blasting costs. Transport of ore and concentrate to processing facilities adds further fuel exposure. A simultaneous decline in gold prices and rise in oil creates a dual margin compression that can rapidly erode mine profitability, particularly for higher-cost operations.
What does the 170-ton import surplus signal about future price risk?
Beyond providing structural support, the surplus also represents a potential source of future selling pressure. If market sentiment deteriorates sufficiently, whether through additional Fed hawkishness or a broader risk-off event, institutions holding gold above current spot may choose to reduce positions, converting structural support into a supply overhang. Investors should monitor ETF flow data and futures positioning reports for early signals of institutional liquidation.
The Macro Verdict: Contested Territory Defined by Inflation Data
The $4,000 level in gold is functioning as a real-time referendum on the trajectory of US monetary policy. With fed rate hike odds pressure on gold above $4,000 firmly embedded in market pricing, the metal finds itself caught between two structural forces operating on incompatible timescales.
On one side sits the short-term rate-hike pricing mechanism, currently assigning greater than 70% probability to a December hike and generating consistent selling pressure on non-yielding assets. On the other sits a structural demand architecture built from years of central bank accumulation, a 170-ton US import surplus held above current spot prices, and persistent geopolitical risk premium from Middle East supply disruptions. The gold price forecast for the remainder of 2026 will hinge critically on which of these forces prevails as inflation data continues to roll in.
The resolution will not come from sentiment shifts or technical patterns alone. It will come from the inflation data pipeline, specifically the sequential trajectory of PPI and CPI readings through the third quarter of 2026. A softening trend would allow Fed rate-hike probabilities to recede, releasing the pressure valve and permitting gold to reclaim the $4,200 to $4,300 range. A sustained beat sequence would validate the December hike and potentially drive a test of $3,974 Ichimoku support, with further downside risk toward $3,888 if that level fails.
What is clear is that gold's holding pattern near $4,000 is not a sign of stability. It is a sign of an unresolved macro argument playing out in real time, with the next chapter written by data rather than conviction. For a broader institutional perspective, J.P. Morgan's commodities research on gold reinforces the view that this contested range reflects genuine uncertainty rather than directional consensus.
This article is for informational purposes only and does not constitute financial advice. Forecasts, scenario projections, and technical analysis discussed herein involve inherent uncertainty and should not be relied upon as the basis for investment decisions. Past performance of any asset or strategy is not indicative of future results. Readers should conduct their own due diligence and consult qualified financial advisers before making any investment decisions.
Want to Identify the Next Major ASX Gold Discovery Before the Market Does?
Discovery Alert's proprietary Discovery IQ model scans ASX announcements in real time, instantly converting complex mineral data across more than 30 commodities into actionable insights — so subscribers can position themselves ahead of the broader market the moment a significant discovery is announced. Explore historic discoveries and the exceptional returns they have generated, then begin your 14-day free trial at Discovery Alert to secure a genuine market-leading edge.