
July 12, 2026
The Architecture of a Gold Market Turning Point: What Cycle Convergence and Technical Signals Are Revealing
Most market participants assess gold through a single analytical lens, whether that is macroeconomic fundamentals, central bank policy, or geopolitical stress. Yet some of the most reliable signals in precious metals markets emerge not from any one framework in isolation, but from the rare convergence of multiple independent analytical systems pointing toward the same conclusion at the same moment in time. That is precisely the situation unfolding in gold markets through mid-2026.
The gold forecast key signal forms for gold discussion that follows draws on technical pattern recognition, time cycle analysis rooted in J.M. Hurst's spectral methodology, momentum-sentiment divergence signals, and macro fundamental drivers. When these frameworks align, the resulting signal carries a weight that no single indicator can produce independently.
When big ASX news breaks, our subscribers know first
Understanding the ~30% Correction: A Secular Bull Market Reality Check
Context matters enormously when assessing any correction in a secular bull market. Gold's decline from its early-2026 peak represents a retracement of approximately 30%, a figure that sounds alarming in isolation but fits a recognisable historical pattern. Blow-off sentiment peaks, where positioning becomes excessively one-sided and momentum indicators reach extreme readings, have historically preceded extended consolidation phases in gold markets.
The January 2026 peak in gold was accompanied by exactly this type of sentiment extreme. A proprietary composite sentiment and momentum measure, referred to as the Gold Timing Index within cycle analysis frameworks, registered what analysts described as a blow-off top signal — a condition where near-universal bullishness exhausts the available pool of new buyers and leaves prices vulnerable to a sharp unwind.
Was This Correction Historically Normal?
What followed was a correction of approximately 30% from the peak. In the context of gold's long-term secular bull cycle, this magnitude of retracement is neither unprecedented nor structurally damaging. What matters analytically is identifying the specific structural signals that mark the transition from correction to recovery.
Historical secular bull markets in gold, including the 2001 to 2011 advance, featured multiple corrections of 15% to 30% that were subsequently followed by powerful new legs higher. The 2008 correction, for instance, saw gold fall more than 30% before resuming its bull market and ultimately reaching a new all-time high. Recognising the pattern does not guarantee the same outcome, but it establishes a credible precedent for the current setup.
What Are the Key Technical Signal Forms for Gold Right Now?
Signal #1: Momentum-Sentiment Divergence at the Late-June Trough
Among the various gold forecast key signal forms for gold, bullish divergence between price and a composite momentum-sentiment indicator ranks as one of the most analytically significant. The mechanics are straightforward: a bearish divergence forms when price makes a higher high not confirmed by the indicator; a bullish divergence forms when price makes a lower low that the indicator refuses to confirm.
What Is a Bullish Divergence in Gold Trading?
A bullish divergence occurs when gold's spot price records a new lower low, but a corresponding momentum or sentiment indicator holds above its prior trough rather than confirming the move. This structural disconnect signals that selling pressure is exhausting itself even as price makes new lows. It is widely interpreted as a leading indicator that a mid-term bottom may be forming or already in place.
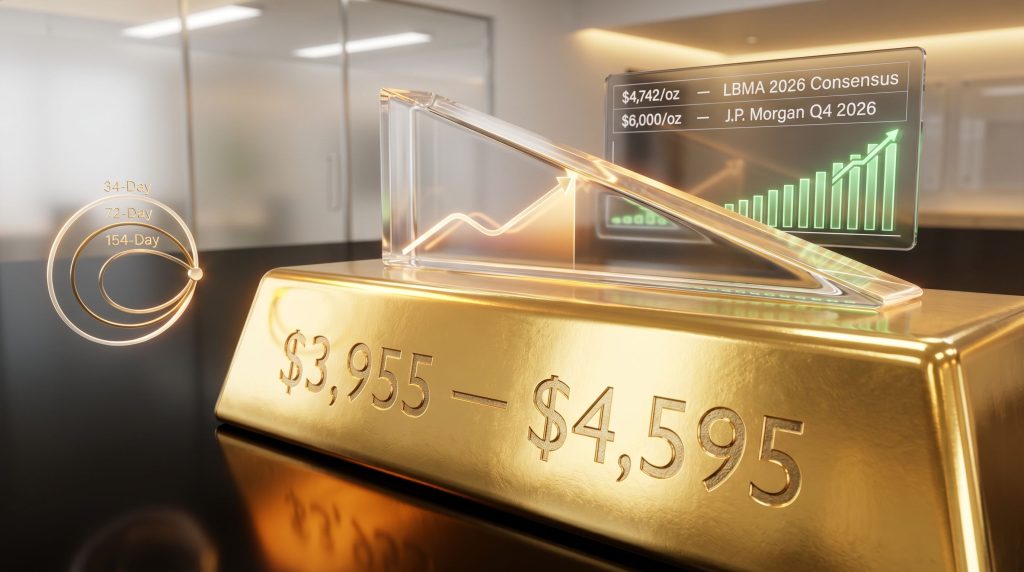
In late June 2026, gold's price printed a lower low near $3,955 (August 2026 contract), but the composite sentiment and momentum indicator did not confirm this with a corresponding new trough. This divergence is considered a bullish signal for the mid-term view. Furthermore, this type of signal carries more weight at cycle turning points than any price action signal in isolation, because it reflects a fundamental shift in the underlying supply and demand dynamics driving price movement.
It is worth noting that a short-term cycle indicator simultaneously moved above its upper reference band, which technically constrains near-term upside. However, cycle analysts following this methodology treat the divergence in the broader composite indicator as the higher-priority signal for the medium-term directional outlook. For a broader view of these dynamics, the current gold market outlook provides additional structural context.
Signal #2: The Falling Wedge Pattern and Critical Breakout Levels
The falling wedge is a well-documented technical pattern characterised by two converging downward-sloping trendlines, where price oscillates within a narrowing range that slopes lower. Crucially, it is classified as a bullish continuation or reversal pattern because the compression of volatility within the wedge structure builds directional energy ahead of a breakout. FX Empire's technical analysis of the falling wedge formation provides further insight into this inflection zone.
The key price levels defining the current technical setup are outlined below:
| Signal Level | Price Point | Significance |
|---|---|---|
| Wedge Breakout Trigger | $4,595 | Confirms bullish reversal of structure |
| 200-Day MA Validation | $4,497 | Near-term bullish confirmation level |
| Bearish Invalidation | $4,366 | Below this level negates bullish case |
| Fibonacci Downside Target | $4,262 | 78.6% retracement if support fails |
| Consensus Forecast | $4,742/oz | LBMA 2026 survey midpoint |
| Bullish Institutional Target | $6,000/oz | J.P. Morgan Q4 2026 average forecast |
A confirmed daily close above $4,595 would validate the wedge breakout, signalling a structural reversal. Initial upside targets upon breakout confirmation are $4,774 and $4,891. These are not arbitrary levels but are derived from measured-move projections based on the height of the wedge at its widest point, a standard technical methodology for establishing price targets following pattern breakouts.
Signal #3: The 200-Day Moving Average as Dynamic Support
The 200-day moving average is arguably the single most widely monitored long-term trend indicator used by both human traders and algorithmic systems. Its importance derives from its near-universal adoption: when price tests this level, the sheer volume of market participants watching it creates a self-reinforcing dynamic that can generate genuine support or resistance.
Gold's mid-2026 test of the 200-day MA at approximately $4,497 mirrors corrective episodes in prior gold bull cycles where this level acted as a structural floor. The appearance of an outside-day candle reversal pattern near this support zone adds a layer of short-term confirmation. A sustained close above $4,497 would communicate a resumption of the primary uptrend to both discretionary and algorithmic participants.
How Time Cycle Frameworks Inform the Gold Forecast
The J.M. Hurst Methodology: Spectral Analysis Applied to Gold
The cycle analysis underpinning this gold forecast draws on a methodology pioneered by J.M. Hurst, whose foundational work The Profit Magic of Stock Transaction Timing introduced the concept of spectral cycle analysis to a wider audience. Hurst's core premise is that markets move in recurring, measurable time intervals driven by the collective psychological behaviour of market participants.
Practitioners of this methodology track multiple timeframes simultaneously, identifying short, intermediate, and longer-order cycles to pinpoint high-probability turning zones. The value lies not in any single cycle but in the convergence of multiple independent cycles within a narrow calendar window — an event that substantially increases the analytical weight of the resulting signal.
The 34-Day Cycle: Short-Term Directional Signal
The 34-day wave in gold represents one of its most reliable short-term oscillations. The sequence of events in this cycle has been clearly defined:
- The reversal below $4,510.10 (June contract) on May 18, 2026 confirmed the downward phase of the 34-day cycle.
- This trigger initiated over 500 points of additional weakness in gold prices.
- The late-June trough at $3,955 marked the completion of the downward phase.
- The upward phase of the 34-day cycle is now considered re-engaged.
- The 34-day moving average acts as a natural price magnet during the upward phase.
- Projected upward trajectory extends into the latter part of July 2026, plus or minus.
The 72-Day Cycle: Intermediate-Term Bottoming Window
The 72-day cycle governs intermediate corrections in gold, typically producing troughs that reset the medium-term trend direction. The projected bottoming window for this cycle was mid-June to mid-July 2026, and the late-June price trough at $3,955 falls squarely within that window.
Cycle analysts emphasise that the 72-day cycle trough designation remains speculative until confirmed by follow-through price action. However, if the trough is confirmed, the subsequent upward phase historically produces sharp, sustained rallies extending into September 2026, plus or minus, with a secondary 72-day trough anticipated in the early-autumn timeframe before a potentially stronger advance extending into Q1 2027.
The 154-Day Cycle: The Bigger Picture
The 154-day cycle represents a higher-order rhythm that encompasses multiple 72-day oscillations. Its projected trough window aligns with both the 34-day and 72-day cycles in the mid-June to mid-July 2026 period, creating what cycle analysts describe as a triple-cycle convergence.
Cycle Convergence Logic: When multiple independent time cycles of different orders — short (34-day), intermediate (72-day), and medium-long (154-day) — project their respective troughs into the same narrow calendar window, the resulting low carries significantly more analytical weight than any single-cycle bottom in isolation. The late-June 2026 trough near $3,955 falls within this convergence zone.
Historically, extended recovery phases following triple-cycle convergence lows have tended to outperform rebounds from single-cycle bottoms, because the larger-order cycles provide a sustained structural tailwind that reinforces the smaller-cycle advances rather than competing against them.
Macro and Fundamental Drivers Supporting a Gold Recovery
Federal Reserve Policy and Real Yield Dynamics
The inverse relationship between real interest rates and gold prices is one of the most empirically robust relationships in financial markets. As real yields fall, the opportunity cost of holding gold — which pays no income — declines, making the asset more attractive on a relative basis.
Current expectations for the Federal Reserve's rate path have shifted toward accommodation, and a pivot toward easing would structurally support gold prices from a fundamental perspective. Analyst consensus suggests moderate gold gains of 5% to 15% under a soft-landing, rate-cutting scenario. An aggressive easing cycle or outright recession scenario could push gains to 15% to 30% above current levels, according to scenario modelling by precious metals research teams.
Central Bank Demand and De-Dollarisation
Central bank gold demand has been one of the defining structural features of the 2020s gold market. According to World Gold Council data, central banks purchased more than 1,000 tonnes of gold in both 2022 and 2023, levels not seen in over five decades. While the pace has moderated slightly from those peak years, reserve diversification strategies remain firmly in place across emerging market central banks.
The de-dollarisation narrative, reflecting a gradual shift by some sovereigns away from USD-denominated reserves toward alternative stores of value including gold, provides a multi-year structural floor under demand. This trend is tracked by the Bank for International Settlements and reflected in IMF reserve composition data, and while it moves slowly, its cumulative effect on gold demand is substantial.
Geopolitical Risk Premium
Elevated geopolitical stress embeds a persistent risk premium in gold prices that tends to compress slowly even as specific triggering events resolve. The gold safe-haven appeal from institutional and sovereign buyers during periods of global uncertainty has become a recurring feature of the current gold market cycle. Consequently, this premium remains a supportive factor in the fundamental backdrop.
Gold Price Forecast Targets: What Are Analysts Projecting?
| Forecast Scenario | Price Target | Key Assumption |
|---|---|---|
| LBMA 2026 Survey Consensus | $4,742/oz | Moderate macro environment |
| LBMA 2026 Survey Range | $4,000 to $6,050/oz | Wide analyst disagreement |
| J.P. Morgan Q4 2026 Average | $6,000/oz | Continued macro tailwinds |
| J.P. Morgan 2027 Projection | $6,300/oz | Extended bull cycle |
| Wedge Breakout Target 1 | $4,774 | Technical breakout above $4,595 |
| Wedge Breakout Target 2 | $4,891 | Secondary technical extension |
| Bearish Fibonacci Target | $4,262 | Failure below $4,366 support |
The forecast landscape splits into two distinct phases. In addition, reviewing the broader gold price forecast context helps frame where mid-year levels sit relative to longer-term projections.
Phase 1 (July to September 2026): The 34-day cycle upward phase drives initial recovery toward the 34-day moving average, with the potential 72-day cycle rally extending into September. Confirmation requires a sustained daily close above $4,595.
Phase 2 (Autumn 2026 to Q1 2027): A secondary 72-day trough in early autumn provides a second entry opportunity, with the subsequent advance projected to extend into February 2027 or later. The 154-day cycle alignment supports a broader recovery through Q1 2027, potentially testing the $6,000 to $6,300 institutional forecast range.
The next major ASX story will hit our subscribers first
How the U.S. Stock Market Cycle Intersects with Gold's Outlook
The S&P 500's 180-Day Cycle
The SPX 180-day cycle bottomed in late March 2026, initiating an upward phase that has carried equities higher. This cycle's upward phase is projected to peak in the late-July to mid-August 2026 window, with a potential spike toward the 8,000 level on the S&P 500 representing the upper boundary of the advance. However, that level is not guaranteed given the limited remaining time horizon.
Following that peak, the projected scenario calls for a sharp correction of 8% to 10% into the late-September to mid-October window, where the next 180-day trough is expected to form. A mid-August peak would have the potential to drag price back toward the 200-day moving average on the SPX during the corrective phase.
The Autumn Convergence Scenario
Scenario Modelling: If the SPX 180-day cycle peaks in mid-August and corrects 8% to 10% into late September, while gold's secondary 72-day trough also forms in early autumn, both asset classes could bottom simultaneously. This would create a dual entry window across equities and precious metals before a year-end rally driven by the 360-day cycle advance.
The larger 360-day cycle in U.S. stocks also projects a key trough for early autumn 2026, aligning with the seasonal cycle low. The advance that follows this combined 180-day and 360-day cycle trough is projected to produce a 15% to 20% rally into year-end. This would have broader implications for risk appetite and commodity demand heading into 2027. The gold-silver ratio analysis also offers a complementary lens through which to assess precious metals positioning during such multi-asset cycle convergences.
What Would Invalidate the Bullish Gold Thesis?
No forecast, regardless of how many independent frameworks support it, should be treated as certainty. The bullish cycle interpretation carries clearly defined invalidation conditions:
- A sustained break below $4,366 negates the bullish short-term structural interpretation.
- More than two consecutive days of corrective price action below near-term support levels signals bearish continuation rather than consolidation.
- The next Fibonacci downside target in a bearish continuation scenario is $4,262, representing the 78.6% retracement level.
- Macro invalidation scenarios include an unexpectedly hawkish Federal Reserve pivot, rapid USD strengthening, or a significant compression in geopolitical risk premiums.
Disclaimer: This article is intended for informational purposes only and does not constitute financial advice. All price targets, cycle projections, and forecast scenarios represent analytical frameworks and historical pattern recognition, not guaranteed outcomes. Past cycle behaviour does not guarantee future results. Readers should conduct their own due diligence and consult a qualified financial adviser before making any investment decisions.
Projected Timeline: A Summary Framework
| Timeframe | Expected Development |
|---|---|
| July 2026 | 34-day cycle upward phase; initial recovery rally |
| September 2026 | Potential 72-day cycle peak; first significant resistance zone |
| Early Autumn 2026 | Secondary 72-day trough; second buying opportunity |
| Late Sept to Mid Oct 2026 | SPX 180-day cycle correction (8 to 10%); potential safe-haven bid for gold |
| Q4 2026 | Stronger gold advance; J.P. Morgan targets $6,000/oz average |
| Q1 2027 (Feb or later) | Extended 154-day cycle advance; potential test of $6,300 institutional targets |
FAQ: Gold Forecast and Cycle Signals Explained
What Does a Key Signal Mean in the Context of Gold Technical Analysis?
A key signal refers to a specific price pattern, indicator divergence, or cycle alignment that suggests a meaningful shift in market direction is either underway or imminent. These signals carry the most analytical weight when multiple independent frameworks — including technical patterns, momentum indicators, and time cycles — align simultaneously within a narrow window.
What Is the Most Important Price Level to Watch for Gold Right Now?
The most immediately actionable upside level is $4,595. A confirmed daily close above this threshold validates the falling wedge breakout and signals a bullish structural reversal. On the downside, $4,366 represents the critical invalidation threshold; a sustained break below this level would negate the bullish cycle interpretation.
How Reliable Are Time Cycle Forecasts for Gold?
Time cycle analysis based on Hurst's spectral methodology provides probabilistic windows for turning points rather than precise predictions. Reliability improves significantly when multiple cycles of different lengths project their troughs into the same narrow time window, as is the case with the 34, 72, and 154-day cycles aligning in mid-2026. Furthermore, the World Gold Council's gold outlook research provides additional institutional context for evaluating these cycle signals against broader market expectations.
What Is the Long-Term Gold Price Forecast for 2026 to 2027?
The LBMA 2026 survey consensus sits at $4,742/oz, while the survey range spans $4,000 to $6,050/oz. J.P. Morgan projects a Q4 2026 average of $6,000/oz and a 2027 target of $6,300/oz, both contingent on continued macro tailwinds including Fed rate cuts, sustained central bank demand, and elevated geopolitical risk premiums. This aligns with the gold forecast key signal forms for gold analysis outlined throughout this article.
How Does Equity Market Behaviour Affect Gold Positioning?
The two markets are linked through capital flow dynamics. When equity markets enter a corrective phase — as projected for the SPX in late September to mid-October 2026 — institutional capital often rotates toward safe-haven assets including gold. The timing of the projected SPX correction aligns directly with gold's secondary 72-day cycle trough window, potentially amplifying the precious metals recovery signal through simultaneous fundamental and technical support.
Want to Capitalise on the Next Major Gold or Mineral Discovery Before the Broader Market?
Discovery Alert's proprietary Discovery IQ model delivers real-time alerts on significant ASX mineral discoveries, transforming complex geological and market data into actionable investment insights the moment they are announced — explore Discovery Alert's dedicated discoveries page to see how historic finds like De Grey Mining and WA1 Resources generated extraordinary returns, and begin your 14-day free trial today to position yourself ahead of the market.