July 12, 2026

The Structural Divide Between Real Assets and Financial Markets
Across long economic cycles, the relationship between gold and equities reveals something that short-term market commentary consistently misses: when one asset class enters a genuine structural bull market, the other tends to underperform in real terms. This is not a rule invented by precious metals enthusiasts. It is a pattern embedded in more than a century of capital market data, reflecting how investors collectively reassess the nature of value during periods of monetary and fiscal stress. Understanding gold-stock secular cycles is essential context for interpreting today's environment.
The current environment sits at an unusually complex intersection. Equity valuations measured in traditional earnings terms have reached levels that statistically exceed every major pre-crash benchmark in modern financial history. At the same time, gold has completed a 75% surge over the prior 12-month period, briefly breaching $5,000 per ounce in January 2026 before entering a corrective consolidation phase. Understanding whether the gold rally and S&P overvaluation dynamic now represents a genuine regime shift requires looking beyond headline prices and into the structural mechanics of how these two asset classes compete for capital.
When big ASX news breaks, our subscribers know first
The SPX/Gold Ratio: A Century-Long Wealth Transfer Indicator
Most investors track the S&P 500 in dollar terms. Fewer track it in gold ounces, yet this alternative framing carries perhaps greater analytical weight when assessing genuine wealth creation versus monetary illusion.
The S&P 500 measured in gold currently sits near 1.95 oz per index unit, a level that sits meaningfully above the century-long average of 1.36 oz. This ratio has traversed an extraordinary 30-fold range across 100 years of market history, with the most compelling buy signals for gold appearing at extreme lows:
- 0.17 oz in 1980, during the peak of stagflationary distress when gold commanded extraordinary purchasing power relative to equities
- 0.66 oz in 2011, following the post-GFC equity collapse and aggressive central bank stimulus programs
- 5.10 oz at the dot-com peak in 2000, when financial assets were priced at their most extreme premium relative to real assets in modern history
Today's reading of 1.95 oz places the ratio above its long-run average but well below the euphoric extremes of 2000. Furthermore, the most important near-term development is that this ratio is currently testing its 200-day moving average. A sustained breakdown through this threshold would provide a compelling structural signal that capital is beginning to rotate away from equities and into gold at a scale beyond tactical repositioning.
The SPX/Gold ratio functions less as a valuation tool for either asset class individually and more as a relative wealth transfer indicator, revealing when productive capital is systematically migrating between financial and real asset categories at a generational scale.
How Overvalued Is the S&P 500? The P/E Picture in 2026
Earnings Multiples Across Historical Market Crises
The earnings-based valuation case for S&P 500 overvaluation is, at this point, difficult to argue against using conventional analytical tools. The following table contextualises the current reading against every major pre-crash valuation benchmark in modern US financial history:
| Market Event | Timing | S&P 500 P/E Ratio |
|---|---|---|
| Garzarelli Crash | October 1987 (eve) | 20.3x |
| Dot-Com Bubble Peak | Early 2000 (eve) | 29.3x |
| Global Financial Crisis | 2007 (eve) | 18.7x |
| Current Reading (July 2026) | Present | 47.0x |
At 47.0x earnings, the current S&P 500 P/E ratio is not merely elevated. It is 59% higher than the dot-com peak multiple of 29.3x, which itself preceded a multi-year bear market that erased trillions in equity wealth. The index itself, sitting near 7,575, remains within striking distance of its all-time high above 7,616, even as underlying earnings growth has visibly decelerated.
The analytical case for a correction of 10% or greater remains mathematically consistent with historical mean reversion dynamics at these valuation extremes. This scenario has not been abandoned simply because the market has continued to levitate. History suggests that the longer extreme valuations persist, the more disorderly the eventual mean reversion tends to become.
Supply-Push Inflation and Its Dual Headwind for Corporate Earnings
One of the most underappreciated distinctions in the current inflationary debate is the difference between demand-pull and supply-push inflation mechanics, and what each implies for equity profitability.
Demand-pull inflation occurs when consumer spending outpaces the productive capacity of the economy. Traditional monetary tightening through rate increases is well-designed to address this dynamic by reducing the cost-competitiveness of borrowing and cooling spending.
Supply-push inflation, by contrast, originates from production constraints, energy disruption, and geopolitical trade friction. Rate hikes applied to a supply-push inflationary environment create a particularly damaging outcome for corporate earnings: they compress profit margins through higher financing costs without resolving the underlying cost pressures that are squeezing input prices. Companies face simultaneously higher costs of goods and higher costs of capital, creating a dual earnings headwind that P/E ratios at 47.0x do not yet appear to reflect. Consequently, the gold rally and S&P overvaluation divergence may widen considerably as this dynamic plays out.
What the Economic Barometer Is Signalling
Broad economic momentum indicators began their upward trajectory approximately 12 months before mainstream financial commentary recognised the trend shift. This lead time is not a minor detail. It illustrates how systematically quantitative frameworks can identify directional changes before they become consensus narratives.
Since June 2026, the pace of economic improvement has demonstrably decelerated. This is not yet a contraction signal, but it is a leading indicator that earnings revisions may follow. The next reporting cycle carries 18 incoming economic metrics alongside Q2 financial sector earnings, creating a critical data cluster that will either confirm or challenge the current equity valuation thesis.
Gold's Technical Structure: Reading the Buy Signal Correctly
Where Gold Stands After the Corrective Phase
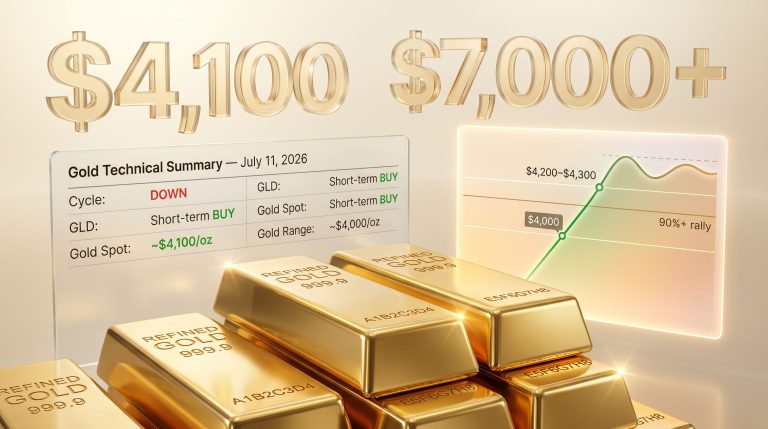
Gold settled near $4,129 per ounce at the close of the most recent weekly session after trading as high as $4,216 and as low as $4,033 within the same period. The prior weekly low of $3,955 represents the critical near-term support threshold. A sustained hold above this level is necessary to preserve the constructive technical thesis. If this floor gives way, the near-term bullish case materially weakens.
| Metric | Gold | Silver |
|---|---|---|
| Recent Weekly High | $4,216 | $63.73 |
| Recent Weekly Low | $4,033 | $57.61 |
| Weekly Settlement | $4,129 | $60.30 |
| Buy Signal Entry | $4,049 (July 2) | $59.25 (July 1) |
| Status vs. Entry | Above | Above |
Understanding the Baby Blues Methodology
The regression trendline consistency indicator, widely referenced in technical analysis of futures markets as the Baby Blues methodology, tracks directional momentum through a 21-day linear regression framework. Understanding how this signal works is important for evaluating its current significance for the gold rally and S&P overvaluation thesis.
Step-by-step signal interpretation:
- Price enters a negative 21-day linear regression, confirming a downtrend via a diagonal trendline moving lower
- Despite the negative trendline, the regression consistency dots begin rising, indicating the downtrend is losing its rate of decline and internal momentum is shifting
- The consistency dots cross above the -80% axis threshold, triggering the formal buy signal
- Because this signal activates before the trendline officially reverses direction, it provides a leading rather than lagging entry point
- More than 25 years of testing across multiple market cycles confirm this signal has consistently functioned as a reliable leading indicator
The most recent Gold buy signal was triggered at the open on July 2, 2026 at $4,049. Silver's corresponding signal activated one day earlier at $59.25 on July 1, 2026. Both metals remain above their respective signal entry points, though upside momentum remains constrained by the geopolitical overlay described below.
The BEGOS Valuation Model: A Near-Term Upside Catalyst
The BEGOS Market Value framework, developed around the mathematical interrelationship of five core markets (Bonds, Euro, Gold, Oil, and the S&P 500), provides a quantitatively derived fair value estimate for gold independent of sentiment-driven price action. Furthermore, gold and bond dynamics within this framework offer additional context for understanding gold's current positioning.
Gold's current price sits approximately $46 (-1.1%) below its BEGOS-derived market value. Critically, this is a historically narrow gap. Across century-to-date analysis covering 240 prior upside crossover events, the average maximum price gain during each signal's active lifespan has been +4.3%.
Applied to current price levels, a confirmed upside crossover could theoretically project gold toward $4,300 within a two-week window from signal confirmation. Given gold's expected daily trading range of approximately $109, crossover confirmation could theoretically arrive as early as a single settlement session.
The BEGOS framework's track record across 240+ crossover events provides a statistically grounded basis for near-term price projection that momentum-based analysis alone cannot replicate.
The Counterintuitive War-Gold Relationship
Why Geopolitical Escalation Is Suppressing Rather Than Supporting Gold
Conventional financial wisdom holds that military conflict and geopolitical instability are bullish for gold. However, the current environment is challenging this assumption in ways that carry important implications for positioning.
The transmission mechanism runs as follows:
- Geopolitical escalation disrupts oil supply chains
- Oil price spikes because supply is constrained
- US dollar demand increases because oil is globally priced and settled in dollars
- Dollar strengthens as energy importers globally require more dollar liquidity
- Gold falls in USD terms because of the mathematically inverse relationship between dollar strength and gold's denominated price
This chain explains why gold has tended to rise during ceasefire periods and decline when hostilities intensify in the current conflict environment. The initial war spike on February 28 saw gold gap up +$64 on the first trade of the session, but subsequent attempts at sustained rallies have been consistently sold into during periods of conflict intensification.
The most recent leg lower in precious metals followed the termination of a US-Iran ceasefire, consistent with this transmission pattern. Recognising this dynamic is essential for timing entries and managing drawdown risk in the current environment.
Gold's Purchasing Power Across Millennia
Beyond the currency dynamics, gold's deepest characteristic is its preservation of real purchasing power across timeframes that dwarf any fiat monetary system. Ancient historical accounts reference transactions where ten talents of fine gold equated to what would represent approximately $45 million in today's purchasing power, suggesting a remarkable continuity of gold's relative exchange value across more than three thousand years.
Egypt's current GDP of approximately $430 billion relative to that historical transaction context illustrates the scale of economic development that gold's intrinsic value has quietly observed and outlasted. This is the characteristic that distinguishes gold from fiat-denominated assets during periods of monetary debasement, and it is why central bank gold demand has been accelerating at a record pace globally.
The Federal Reserve Decision: Rate Implications for Precious Metals
July 29 FOMC Meeting: The Binary Outcome for Gold
The Federal Reserve's Open Market Committee is scheduled to release its next policy statement in 13 trading days from mid-July 2026. The current Federal Funds Rate target range sits at 3.50% to 3.75%. The analytical debate within fixed income and commodities markets is intensely focused on whether the FOMC will raise to 3.75% to 4.00% or hold at current levels.
The case for hiking:
- Inflation readings remain persistently above target despite previous tightening cycles
- Allowing above-target inflation to persist risks de-anchoring long-term inflation expectations
- Historical policy precedent supports rate normalisation during extended inflationary episodes
The case for holding:
- The dominant character of current inflation is supply-push rather than demand-driven
- Rate hikes cannot resolve production bottlenecks or geopolitical supply chain disruption
- Unnecessary tightening risks suppressing economic activity without achieving the inflation objective
If the Federal Reserve holds rates steady at its July 29 meeting, the gold market would likely interpret this as an implicit acknowledgment that conventional monetary tools are insufficient to address the current inflationary environment, potentially triggering a swift repricing higher in precious metals.
The next major ASX story will hit our subscribers first
Gold's Volatility Problem: The Risk That Momentum Investors Are Underpricing
What a 75% Rally Actually Means for Drawdown Risk
Year-to-date volatility in gold has surged 46%, a level that technically makes gold more volatile than equities on a near-term basis. The precious metal surrendered approximately $1,000 in gains within a 72-hour window during its most recent corrective episode, illustrating the fragility embedded within momentum-driven rallies. In addition, gold's safe-haven appeal does not insulate it from sharp short-term drawdowns driven by momentum reversals.
It is important to distinguish between the structural drivers of gold demand and the momentum-driven flows that amplify price moves in both directions:
Structural demand drivers (considered more durable):
- Central bank accumulation programmes designed to reduce dependency on dollar reserves
- Sovereign wealth fund diversification away from US Treasury holdings
- Rising government debt levels globally reducing institutional confidence in fiat monetary systems
Momentum-driven demand (considered more fragile):
- Retail and institutional momentum-chasing following the 75% price surge
- ETF inflows driven by recency bias rather than fundamental reallocation decisions
- Speculative futures positioning accumulated at elevated price levels
Risk Warning: When momentum-driven demand reverses, gold can experience sharp and rapid corrections that exceed what the structural fundamental drivers alone would justify. The $1,000 intraday drawdown episode serves as a live demonstration of this dynamic, and position sizing should reflect it.
Silver's higher beta relative to gold means that any confirmed gold breakout would likely produce amplified percentage gains in silver, but also amplified losses in a corrective scenario. The 10-day Market Profile for both metals currently shows price consolidating near volume-dominant trading zones, suggesting a neutral-to-constructive technical posture that has not yet resolved in either direction.
A Multi-Framework Assessment: What the Data Convergence Suggests
The current analytical environment presents a rare convergence of signals that individually would each be notable. Together, they create a framework that deserves careful attention:
- The S&P 500's P/E ratio of 47.0x sits at a level that has no modern historical precedent prior to a market correction
- The SPX/Gold ratio at 1.95 oz sits above its century average of 1.36 oz, testing its 200-day moving average at a structurally critical juncture
- Gold's Baby Blues buy signal is active from $4,049, with both metals above their entry points
- The BEGOS model shows gold trading $46 below fair value, historically close enough to generate an upside crossover with a single strong session
- The Federal Reserve's July 29 decision creates a binary outcome that could provide either a sharp catalyst or a temporary headwind for gold
Furthermore, undervalued mining stocks represent an additional dimension of this structural rotation that equity-focused investors may be overlooking. A simultaneous S&P 500 decline of 10% and a gold appreciation of 4.3% aligned with the BEGOS crossover average would shift the SPX/Gold ratio from 1.95 oz toward approximately 1.60 to 1.65 oz, a meaningful step back toward the century-long average. This would confirm that the gold rally and S&P overvaluation divergence is translating into genuine structural capital rotation.
The near-term critical level remains the prior weekly low of $3,955 in gold. A hold above this floor sustains the constructive case. A break below it would require reassessment of the entire near-term technical thesis, regardless of the strength of the fundamental structural argument. For further context on what drives gold's price, a range of macroeconomic and monetary factors continue to interact with the technical signals described above. Additionally, BlackRock's analysis of gold and silver volatility provides institutional-level perspective on managing the drawdown risks inherent in the current precious metals environment.
Disclaimer: This article is provided for informational and educational purposes only and does not constitute financial advice or a recommendation to buy or sell any security or commodity. All price targets, valuation models, and scenario projections discussed herein involve significant uncertainty and are subject to change. Past performance of any indicator, ratio, or analytical methodology is not a guarantee of future results. Investors should conduct their own due diligence and consult a qualified financial adviser before making investment decisions. Gold and silver markets carry substantial risk of loss, particularly during periods of elevated volatility.
Want to Be First to Identify the Next Major Mineral Discovery Amid This Structural Shift?
As capital continues rotating between financial and real assets, Discovery Alert's proprietary Discovery IQ model instantly scans ASX announcements across 30+ commodities, delivering real-time alerts on significant mineral discoveries — explore historic discovery returns to understand the potential scale of these opportunities, then begin a 14-day free trial at Discovery Alert to position yourself ahead of the broader market.