July 11, 2026
When Cycle Indicators Contradict Each Other: Navigating Gold's Complex Technical Landscape
Precious metals markets have an uncanny ability to produce conflicting signals at precisely the moments when clarity is most needed. This gold price exclusive update examines a period where traders who have followed gold through multiple bull and bear cycles understand that the most dangerous phases are rarely the obvious crashes or euphoric surges. Instead, the genuinely treacherous periods are those characterised by mixed signals, where short-term price action points one direction while intermediate-term structural indicators point another. That is exactly the environment gold investors are navigating right now.
As of mid-July 2026, gold is holding just above $4,100 per ounce while its technical landscape has fractured into a collection of divergent readings across cycle indicators, ETF signals, currency trends, and speculation metrics. Understanding what each of these signals means in isolation is straightforward. Understanding what they mean collectively requires a more disciplined analytical framework.
When big ASX news breaks, our subscribers know first
Gold at $4,100: The Significance of Where Price Has Settled
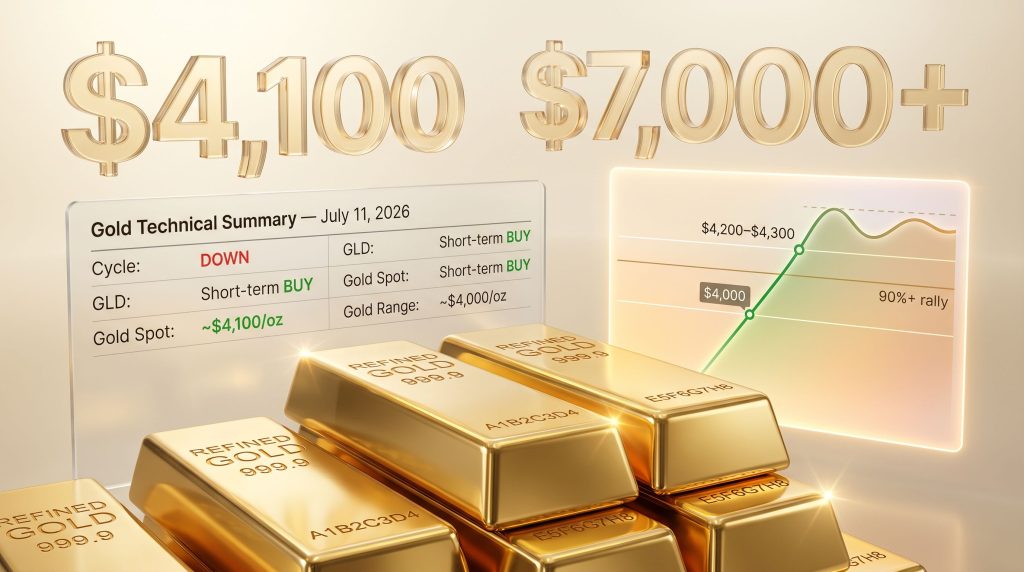
The $4,100 level is not an arbitrary number. Earlier in July 2026, gold briefly slipped below the psychologically significant $4,000 threshold for the first time since November 2025, triggering a wave of concern among both retail and institutional market participants. The recovery that followed, with spot gold gaining more than 1.30% during the North American session on July 9, was notable not just for its magnitude but for what it confirmed: the $4,000 level has undergone a classic technical role reversal from former resistance ceiling to active support floor.
This kind of role reversal is one of the most reliable structural signals in technical analysis. When a price level that previously halted advances subsequently becomes a platform from which price bounces, it signals that buyers have absorbed sellers at that zone and are willing to defend it. For gold, this validation of $4,000 as support has important implications for how both traders and longer-term investors should calibrate their positioning.
To appreciate how significant the current juncture is, consider the broader trajectory:
- Gold has rallied more than 60% over the prior 12-month period
- The 14-month gain from the late 2024 lows now exceeds 90%, placing this rally among the most sustained in modern precious metals history
- The $4,000 level represents a former breakout zone that, if lost on a closing basis, would represent a meaningful technical deterioration
The metal's ability to recover above $4,100 after its brief dip below $4,000 temporarily steadied short-term sentiment. However, the broader technical picture remains considerably more complicated. Consulting a reliable gold price forecast can help investors contextualise these movements within a longer-term framework.
The Cycle Indicator Has Shifted: What a DOWN Reading Actually Means
Cycle-based timing models occupy a specific and often misunderstood niche in technical analysis. Unlike trend-following indicators that respond to recent price momentum, or oscillators that measure overbought and oversold conditions, cycle indicators attempt to identify recurring rhythmic patterns in price behaviour that repeat across time. Their core purpose is not to explain why a market is moving, but to signal when the probabilistic balance of directional risk has shifted.
As of July 11, 2026, the proprietary cycle indicator tracking the gold sector has moved to a DOWN position. This is a meaningful development, but it requires careful interpretation:
- A DOWN cycle reading does not signal an imminent price collapse
- It indicates that the probability-weighted direction of near-term price movement has tilted bearish
- It functions as a timing signal that adjusts the risk-reward calculus for both new entries and existing positions
The practical implications differ depending on investor type:
For long-term investors, a down cycle has historically represented an opportunity to pause accumulation rather than exit entirely. The cycle model suggests holding existing positions while waiting for conditions to rotate back to an UP reading before adding meaningful new exposure.
For active traders, the shift to DOWN signals that cycle tops should be used as exit points, and initiating new long positions before a confirmed cycle bottom represents an asymmetrically unfavourable risk trade.
This distinction between investor and trader frameworks is critical. The same signal can be appropriately interpreted in two opposing ways depending on the time horizon and objectives of the market participant.
ETF Signal Divergence: Why GLD and the Mining ETFs Are Telling Different Stories
One of the most instructive features of the current gold price exclusive update is the visible divergence between signals across gold-related instruments. This kind of cross-instrument divergence is far more informative than any single reading in isolation.
| Instrument | Short-Term Signal | What It Represents |
|---|---|---|
| GLD (SPDR Gold Trust) | BUY | Physical gold price exposure |
| GDX (VanEck Gold Miners ETF) | SELL | Large-cap global gold producers |
| GDXJ (Junior Gold Miners ETF) | SELL | Small/mid-cap miners, higher beta |
| XGD.TO (TSX Gold Index) | SELL | Canadian-listed gold producers |
The GLD buy signal is best understood as a counter-trend bounce indicator rather than a green light to add strategic long exposure. Within a broader downward cycle, short-term buy signals in the underlying commodity often precede temporary price recoveries before the dominant trend reasserts itself.
The alignment of sell signals across GDX, GDXJ, and XGD.TO is considerably more telling. Gold mining equities are structurally leveraged to the gold price, meaning their price movements tend to amplify gold's directional moves. Furthermore, a 1% decline in gold can translate into a 2-4% decline in major mining ETFs, a relationship that reflects the operating leverage embedded in mining company economics. When three separate mining equity instruments simultaneously register sell signals, the collective message is difficult to dismiss as noise.
This pattern also reflects a well-documented phenomenon in precious metals markets: mining stocks frequently lead the underlying metal at turning points. The fact that GDX, GDXJ, and XGD.TO have all deteriorated while GLD still shows a short-term buy suggests the equity market may be anticipating further weakness in gold before it materialises in spot price.
The USD Trend: The Macro Variable That Overrides Everything Else
No gold price exclusive update would be complete without addressing the U.S. dollar. The inverse relationship between USD strength and gold pricing is one of the most statistically durable correlations across all financial markets, and right now, that relationship is applying meaningful downward pressure on the metal.
The USD trend is currently pointing upward. For gold, a strengthening dollar creates multiple headwinds simultaneously:
- It makes gold more expensive in non-USD currencies, reducing international demand
- It increases the opportunity cost of holding non-yielding assets like gold, particularly in an environment where rate hike expectations remain elevated
- It signals that dollar-denominated assets are attracting capital flows away from commodities
Layered on top of this, hawkish Federal Reserve commentary has reinforced the possibility of additional rate hikes. Higher rates strengthen the dollar further while simultaneously increasing the yield available on competing assets. Gold, which generates no income, becomes comparatively less attractive in this environment on a pure opportunity-cost basis. However, the gold safe-haven appeal continues to underpin long-term demand despite these short-term pressures.
When both the USD trend and gold's own price trend are simultaneously pointing in opposing directions to an investor's desired outcome, technical models consistently identify this configuration as a patience window rather than an entry window.
Speculation Metrics and What Bear Market Valuations Signal
Perhaps the least discussed but most analytically rich component of the current technical picture is the state of speculative positioning. As of this update, speculation metrics have retreated to levels consistent with bear market valuations. This is a nuanced data point that carries two entirely different implications depending on an investor's analytical framework.
The bearish interpretation is straightforward: speculative capital, which tends to amplify momentum in both directions, is exiting the gold sector. Reduced speculative participation typically leads to lower volatility and continued price drift in the direction of the dominant trend, which is currently downward.
The contrarian interpretation is more interesting. Historically, periods when speculative positioning in gold retreats to bear market threshold levels have often preceded some of the most significant accumulation opportunities in the metal's longer cycle. Speculative washouts clear the market of weak holders, reduce the overhead supply of sellers who bought at higher prices, and create conditions in which a relatively modest influx of new buying can produce disproportionate price moves to the upside.
This dynamic helps explain why long-term analysts continue to reference ambitious price targets even in the context of deteriorating short-term technicals:
- $4,200-$4,300 represents the immediate resistance zone and prior consolidation ceiling
- $4,000 remains the critical near-term support floor
- $3,800-$3,850 constitutes secondary technical support at the prior late-2025 breakout zone
- $7,000+ represents the target cited by long-duration technical and macro analysts who view the current pullback as consolidation within a secular bull market rather than a structural reversal
The $7,000+ target is grounded in several structural arguments. In particular, central bank demand, especially among emerging market economies, continues to support gold accumulation. Alongside this, continued de-dollarisation trends among BRICS-aligned nations and the historical precedent for gold's multi-year bull cycles following central bank policy pivots are long-horizon arguments. These do not provide near-term trading signals but do contextualise why strategic investors are reluctant to abandon gold exposure despite deteriorating short-term technicals.
The next major ASX story will hit our subscribers first
Geopolitical Risk Premium and ETF Flow Dynamics
Two additional variables complicate the technical picture in meaningful ways. Renewed conflict dynamics involving Iran have injected a geopolitical risk premium into gold pricing. Safe-haven demand of this nature tends to produce sharp, short-duration price spikes that can temporarily override bearish technical signals. However, geopolitical bids in gold are historically unreliable as trend-setting catalysts unless they are accompanied by sustained macro deterioration.
On the institutional side, global gold ETFs recorded net additions during the first half of 2026, even after notable outflows in May and June, according to reporting from Gold-Eagle.com. This divergence between short-term tactical outflows and medium-term net accumulation suggests institutional positioning remains constructively oriented toward gold over a multi-quarter horizon, even as shorter-duration traders reduce exposure. In addition, the evolving gold-silver ratio is worth monitoring, as shifts in this relationship can provide supplementary confirmation of broader precious metals trends.
A Practical Framework for Different Market Participants
Given the complexity of the current signal environment, investors and traders benefit from distinct decision frameworks:
For long-term gold investors:
- Recognise the down cycle as a potential accumulation phase over a multi-month horizon, not a signal to liquidate strategic positions
- Avoid adding material new exposure before the cycle indicator rotates back to UP
- Treat the $4,000 level as the key risk management reference point for existing holdings
- Monitor the USD trend closely, as a reversal in dollar strength would be among the most important catalysts for gold's next upward leg
For active gold traders:
- Treat the GLD short-term buy signal as a tactical counter-trend opportunity only, with tight position sizing and defined exit levels
- Avoid initiating fresh long positions in GDX, GDXJ, or XGD.TO while sell signals remain active across all three instruments
- Wait for confirmed cycle bottom readings before re-entering with conviction
- Use $4,000 as a stop-loss reference and $4,200-$4,300 as a resistance target for any short-duration long trades
Disclaimer: Cycle indicators, like all technical tools, are probabilistic frameworks rather than predictive instruments. Short-term whipsaws occur regularly, particularly during periods of elevated macroeconomic volatility. Nothing in this article constitutes financial advice. Investors should conduct their own due diligence and consider seeking advice from a licensed financial professional before making investment decisions.
Technical Summary: Gold Market Dashboard, July 11, 2026
| Indicator | Current Reading | Implication |
|---|---|---|
| Proprietary Cycle | DOWN | Intermediate-term bearish bias |
| GLD Signal | Short-term BUY | Counter-trend bounce possible |
| GDX Signal | Short-term SELL | Avoid new long positions in large-cap miners |
| GDXJ Signal | Short-term SELL | Junior miners under elevated pressure |
| XGD.TO Signal | Short-term SELL | Canadian gold equities weak |
| USD Trend | UP | Structural headwind for gold pricing |
| Gold Price Trend | DOWN | Momentum deteriorating |
| Gold Stock Trend | DOWN | Equity risk elevated across sector |
| Speculation Level | Bear Market Value | Contrarian accumulation watch zone |
| Gold Spot Price | ~$4,100/oz | Holding key former-resistance-turned-support |
The current environment demands discipline over conviction. The gold sector's cycle is down, the dollar trend is working against the metal, and mining equity signals are uniformly bearish in the short term. Yet speculation has washed out to levels that have historically preceded meaningful recoveries, and the $4,000 floor has demonstrated its significance as structural support.
Consequently, the most productive posture for most market participants is neither aggressive buying nor panic selling. It is patience, informed by a clear understanding of which signals apply to which time horizon, and an appreciation for the fact that gold's secular story remains very much intact even when its short-term technical picture is clouded.
Want to Stay Ahead of the Next Major Mineral Discovery on the ASX?
While gold's technical landscape grows increasingly complex, Discovery Alert's proprietary Discovery IQ model cuts through the noise by delivering real-time alerts on significant ASX mineral discoveries — explore historic discoveries that have generated exceptional returns and begin your 14-day free trial today to position yourself ahead of the broader market.